South Australian state election, 8 April 1933 [1] Contents | ||||||
---|---|---|---|---|---|---|
Enrolled voters | 338,576 | |||||
Votes cast | 182,693 | Turnout | 59.45% | –11.91% | ||
Informal votes | 8,904 | Informal | 4.87% | -0.84% | ||
Summary of votes by party | ||||||
Party | Primary votes | % | Swing | Seats | Change | |
Liberal and Country | 60,159 | 34.62% | * | 29 | * | |
Labor | 48,273 | 27.78% | –20.86% | 6 | – 24 | |
Parliamentary Labor | 28,319 | 16.30% | * | 4 | * | |
Lang Labor | 6,398 | 3.68% | * | 3 | * | |
Single Tax League | 5,429 | 3.12% | +1.80% | 1 | ± 0 | |
Communist | 1,908 | 1.10% | +0.77% | 0 | ± 0 | |
Independent | 23,303 | 13.41% | +11.09% | 3 | + 3 | |
Total | 173,789 | 46 |
This is a list of House of Assembly results for the 1933 South Australian state election. Each district elected multiple members.
Party | Candidate | Votes | % | ±% | |
---|---|---|---|---|---|
Lang Labor | Doug Bardolph (elected 1) | 2,669 | 35.4 | +35.4 | |
Lang Labor | Bob Dale (elected 2) | 153 | 2.0 | +2.0 | |
Lang Labor | Tom Howard (elected 3) | 30 | 0.4 | +0.4 | |
Labor | Martin Collaton | 1,516 | 20.1 | +20.1 | |
Labor | Herbert George | 240 | 3.2 | -0.2 | |
Labor | Edward McDonnell | 181 | 2.4 | +2.4 | |
Parliamentary Labor | Bill Denny | 1,072 | 14.2 | -67.5 | |
Parliamentary Labor | Clement Wells | 180 | 2.4 | +2.4 | |
Parliamentary Labor | Martin Dwyer | 25 | 0.3 | +0.3 | |
Liberal and Country | Kingsley Hilton | 1,073 | 14.2 | +14.2 | |
Liberal and Country | Duncan Menzies | 64 | 0.9 | +0.9 | |
Liberal and Country | J Trego-Williams | 39 | 0.5 | +0.5 | |
Communist | Tom Garland | 307 | 4.1 | +4.1 | |
Total formal votes | 7,549 | 91.4 | −0.8 | ||
Informal votes | 713 | 8.6 | +0.8 | ||
Turnout | 8,262 | 61.2 | +2.3 | ||
Party total votes | |||||
Lang Labor | 2,847 | 37.7 | +37.7 | ||
Labor | 1,937 | 25.7 | -63.9 | ||
Parliamentary Labor | 1,277 | 16.9 | +16.9 | ||
Liberal and Country | 1,176 | 15.6 | +15.6 | ||
Communist | 307 | 4.1 | -0.7 |
Party | Candidate | Votes | % | ±% | |
---|---|---|---|---|---|
Liberal and Country | Malcolm McIntosh (elected 1) | 3,695 | 40.7 | +4.0 | |
Liberal and Country | Frederick McMillan | 187 | 2.1 | -0.5 | |
Independent | Tom Stott (elected 2) | 3,013 | 33.2 | +33.2 | |
Single Tax League | Jacob Groth | 1,908 | 21.0 | +21.0 | |
Single Tax League | Oscar Kunoth | 277 | 3.1 | +3.1 | |
Total formal votes | 9,080 | 94.1 | 0.0 | ||
Informal votes | 365 | 3.9 | 0.0 | ||
Turnout | 9,445 | 61.1 | −12.9 | ||
Party total votes | |||||
Liberal and Country | 3,882 | 42.8 | +3.5 | ||
Independent | Tom Stott | 3,013 | 33.2 | +33.2 | |
Single Tax League | 2,185 | 24.1 | +24.1 |
Party | Candidate | Votes | % | ±% | |
---|---|---|---|---|---|
Liberal and Country | George Laffer (elected 1) | unopposed | |||
Liberal and Country | Herbert Hudd (elected 2) | unopposed | |||
Liberal and Country | Percy Heggaton (elected 3) | unopposed |
Party | Candidate | Votes | % | ±% | |
---|---|---|---|---|---|
Liberal and Country | Henry Crosby (elected 1) | 3,522 | 39.5 | +5.3 | |
Liberal and Country | Reginald Rudall | 184 | 2.1 | +2.1 | |
Liberal and Country | Herbert Lyons (elected 3) | 124 | 1.4 | -1.7 | |
Parliamentary Labor | Thomas Edwards | 2,007 | 22.5 | +20.0 | |
Parliamentary Labor | Harold Zadow | 54 | 0.6 | +0.6 | |
Parliamentary Labor | Arthur McArthur | 47 | 0.5 | +0.5 | |
Independent | Herbert Basedow (elected 2) | 1,672 | 18.8 | -4.3 | |
Independent | Lindsay Yelland | 64 | 0.7 | +0.7 | |
Labor | Leslie McMullin | 1,135 | 12.7 | +12.7 | |
Labor | John Whitfield | 64 | 0.7 | +0.7 | |
Labor | Sid O'Flaherty | 38 | 0.4 | +0.4 | |
Total formal votes | 8,911 | 94.9 | +1.4 | ||
Informal votes | 474 | 5.1 | −1.4 | ||
Turnout | 9,385 | 66.6 | −11.9 | ||
Party total votes | |||||
Liberal and Country | 3,830 | 43.0 | +5.6 | ||
Parliamentary Labor | 2,108 | 23.7 | +23.7 | ||
Independent | 1,736 | 19.5 | +5.0 | ||
Labor | 1,237 | 13.9 | -32.8 |
Party | Candidate | Votes | % | ±% | |
---|---|---|---|---|---|
Liberal and Country | George Jenkins (elected 1) | 3,464 | 39.0 | +1.9 | |
Liberal and Country | Alexander Melrose (elected 2) | 199 | 2.2 | +2.2 | |
Liberal and Country | Archibald McDonald (elected 3) | 172 | 1.9 | +1.9 | |
Parliamentary Labor | Jack Critchley | 1,940 | 21.8 | -19.2 | |
Parliamentary Labor | Sydney McHugh | 467 | 5.3 | -4.9 | |
Parliamentary Labor | Even George | 224 | 2.5 | +1.0 | |
Labor | Thomas Canny | 2,208 | 24.8 | +24.8 | |
Labor | Leonard Wilcott | 160 | 1.8 | +1.8 | |
Labor | James Marner | 63 | 0.7 | +0.7 | |
Total formal votes | 8,897 | 96.0 | +2.2 | ||
Informal votes | 375 | 4.0 | −2.2 | ||
Turnout | 9,272 | 71.2 | −7.1 | ||
Party total votes | |||||
Liberal and Country | 3,835 | 43.1 | -4.2 | ||
Parliamentary Labor | 2,631 | 29.6 | +29.6 | ||
Labor | 2,431 | 27.3 | -25.1 |
Party | Candidate | Votes | % | ±% | |
---|---|---|---|---|---|
Liberal and Country | Charles Abbott (elected 1) | 8,207 | 40.3 | +40.3 | |
Liberal and Country | Walter Hamilton (elected 2) | 470 | 2.3 | -3.8 | |
Liberal and Country | Frank Perry (elected 3) | 460 | 2.3 | +2.3 | |
Labor | Loftus Fenwick | 6,179 | 30.3 | +30.3 | |
Labor | Beasley Kearney | 496 | 2.4 | -42.4 | |
Labor | Cecil Nicholls | 222 | 1.1 | +1.1 | |
Parliamentary Labor | Herbert Byrne | 3,663 | 18.0 | +18.0 | |
Parliamentary Labor | Herman Dankel | 521 | 2.6 | +2.6 | |
Parliamentary Labor | Clarence Cooke | 144 | 0.7 | +0.7 | |
Total formal votes | 20,362 | 94.9 | +0.2 | ||
Informal votes | 1,097 | 5.1 | −0.2 | ||
Turnout | 21,459 | 55.7 | −14.2 | ||
Party total votes | |||||
Liberal and Country | 9,137 | 44.9 | -5.0 | ||
Labor | 6,897 | 33.9 | -16.2 | ||
Parliamentary Labor | 4,328 | 21.3 | +21.3 |
Party | Candidate | Votes | % | ±% | |
---|---|---|---|---|---|
Single Tax League | Edward Craigie (elected 1) | 3,190 | 41.0 | +7.0 | |
Single Tax League | James Moore | 54 | 0.7 | +0.7 | |
Liberal and Country | Arthur Christian (elected 2) | 2,186 | 28.1 | +28.1 | |
Liberal and Country | James McDonald | 358 | 4.6 | +4.6 | |
Labor | Leo Cash | 1,419 | 18.2 | +18.2 | |
Labor | Thomas Cash | 172 | 2.2 | +2.2 | |
Independent | Albert Pfitzner | 411 | 5.3 | +5.3 | |
Total formal votes | 7,790 | 95.7 | +0.1 | ||
Informal votes | 353 | 4.3 | −0.1 | ||
Turnout | 8,143 | 64.1 | −6.5 | ||
Party total votes | |||||
Single Tax League | 3,244 | 41.7 | +7.7 | ||
Liberal and Country | 2,544 | 32.7 | +2.7 | ||
Labor | 1,591 | 20.4 | +3.8 | ||
Independent | Albert Pfitzner | 411 | 5.3 | +5.3 |
Party | Candidate | Votes | % | ±% | |
---|---|---|---|---|---|
Liberal and Country | George Morphett (elected 1) | 3,304 | 41.3 | +30.0 | |
Liberal and Country | Thomas Playford (elected 2) | 341 | 4.3 | +4.3 | |
Liberal and Country | Howard Shannon (elected 3) | 233 | 2.9 | +2.9 | |
Parliamentary Labor | Clement Collins | 1,800 | 22.5 | -7.3 | |
Parliamentary Labor | Frank Staniford | 1,009 | 12.6 | +5.9 | |
Parliamentary Labor | Robert Hunter | 46 | 0.6 | -0.3 | |
Labor | John Cassidy | 1,124 | 14.1 | +14.1 | |
Labor | Davis Fraser | 88 | 1.1 | +1.1 | |
Labor | Herbert Gersch | 56 | 0.7 | +0.7 | |
Total formal votes | 8,001 | 95.1 | +3.7 | ||
Informal votes | 411 | 4.9 | −3.7 | ||
Turnout | 8,412 | 59.1 | −16.2 | ||
Party total votes | |||||
Liberal and Country | 3,878 | 48.5 | -1.2 | ||
Parliamentary Labor | 2,855 | 35.7 | +35.7 | ||
Labor | 1,268 | 15.8 | -31.6 |
Party | Candidate | Votes | % | ±% | |
---|---|---|---|---|---|
Labor | James Beerworth (elected 1) | 1,639 | 40.5 | ||
Labor | Lindsay Riches (elected 2) | 168 | 4.2 | ||
Liberal and Country | Corba Sunman | 1,059 | 26.2 | ||
Liberal and Country | Robert McEwin | 163 | 4.0 | ||
Parliamentary Labor | Thomas Butterfield | 886 | 21.9 | ||
Parliamentary Labor | William Harvey | 131 | 3.2 | ||
Total formal votes | 4,046 | 96.1 | |||
Informal votes | 163 | 3.9 | |||
Turnout | 4,209 | 68.9 | |||
Party total votes | |||||
Labor | 1,807 | 44.7 | |||
Liberal and Country | 1,222 | 30.2 | |||
Parliamentary Labor | 1,017 | 25.1 |
Party | Candidate | Votes | % | ±% | |
---|---|---|---|---|---|
Liberal and Country | Shirley Jeffries (elected 1) | 4,904 | 40.7 | +1.4 | |
Liberal and Country | Victor Newland (elected 2) | 467 | 3.9 | -4.5 | |
Labor | Walter Warne | 3,436 | 28.5 | +22.0 | |
Labor | Frank Wilton | 175 | 1.5 | +1.5 | |
Parliamentary Labor | A S Horne | 2,940 | 24.4 | +24.4 | |
Parliamentary Labor | C G Johnson | 129 | 1.1 | +1.1 | |
Total formal votes | 12,051 | 95.8 | −1.2 | ||
Informal votes | 528 | 4.2 | +1.2 | ||
Turnout | 12,579 | 57.2 | −15.2 | ||
Party total votes | |||||
Liberal and Country | 5,371 | 44.6 | -3.0 | ||
Labor | 3,611 | 30.0 | -22.3 | ||
Parliamentary Labor | 3,069 | 25.4 | +25.4 |
Party | Candidate | Votes | % | ±% | |
---|---|---|---|---|---|
Labor | James Stephens (elected 1) | 5,562 | 34.0 | +34.0 | |
Labor | Albert Thompson (elected 2) | 2,416 | 14.8 | +4.5 | |
Independent | Ernest Evans | 3,046 | 18.6 | +18.6 | |
Independent | Arthur Lewis | 1,411 | 8.6 | +8.6 | |
Lang Labor | Arthur Dadleff | 2,223 | 13.6 | +13.6 | |
Lang Labor | Frederick Hearne | 192 | 1.2 | +1.2 | |
Communist | John Zwolsman | 897 | 5.5 | +5.5 | |
Independent | Charles Hayter | 619 | 3.8 | +3.8 | |
Total formal votes | 16,366 | 94.6 | −0.4 | ||
Informal votes | 927 | 5.4 | +0.4 | ||
Turnout | 17,293 | 58.5 | −12.3 | ||
Party total votes | |||||
Labor | 7,978 | 48.7 | -30.3 | ||
Independent | 4,457 | 27.2 | +27.2 | ||
Lang Labor | 2,415 | 14.8 | +14.8 | ||
Communist | 897 | 5.5 | +5.5 | ||
Independent | Charles Hayter | 619 | 3.8 | +3.8 |
Party | Candidate | Votes | % | ±% | |
---|---|---|---|---|---|
Labor | Andrew Lacey (elected 1) | unopposed | |||
Labor | John Fitzgerald (elected 2) | unopposed |
Party | Candidate | Votes | % | ±% | |
---|---|---|---|---|---|
Liberal and Country | Robert Nicholls (elected 1) | unopposed | |||
Liberal and Country | John Lyons (elected 2) | unopposed |
Party | Candidate | Votes | % | ±% | |
---|---|---|---|---|---|
Liberal and Country | Ernest Anthoney (elected 1) | 13,423 | 50.7 | +12.6 | |
Liberal and Country | Henry Dunks (elected 2) | 620 | 2.3 | +2.3 | |
Liberal and Country | Horace Hogben (elected 3) | 512 | 1.9 | +1.9 | |
Labor | Edgar Dawes | 10,975 | 41.4 | +39.9 | |
Labor | Thomas Grealy | 673 | 2.5 | -1.1 | |
Labor | James Hawke | 293 | 1.1 | +1.1 | |
Total formal votes | 26,496 | 95.2 | +1.8 | ||
Informal votes | 1,335 | 4.8 | −1.8 | ||
Turnout | 27,831 | 51.2 | −18.3 | ||
Party total votes | |||||
Liberal and Country | 14,555 | 54.9 | +10.8 | ||
Labor | 11,941 | 45.1 | -7.1 |
Party | Candidate | Votes | % | ±% | |
---|---|---|---|---|---|
Liberal and Country | Vernon Petherick (elected 1) | 3,315 | 35.7 | +25.3 | |
Liberal and Country | Ronald Hunt (elected 2) | 713 | 7.7 | +7.7 | |
Parliamentary Labor | Eric Shepherd | 1,949 | 21.0 | -24.1 | |
Parliamentary Labor | Jim Corcoran | 1,641 | 17.7 | +17.7 | |
Independent | Anthony Sutton | 1,225 | 13.2 | +13.2 | |
Independent | Peter Crafter | 453 | 4.9 | +4.9 | |
Total formal votes | 9,296 | 96.2 | +1.9 | ||
Informal votes | 364 | 3.8 | −1.9 | ||
Turnout | 9,660 | 68.3 | −16.3 | ||
Party total votes | |||||
Liberal and Country | 4,028 | 43.3 | -8.4 | ||
Parliamentary Labor | 3,590 | 38.6 | +38.6 | ||
Independent | Anthony Sutton | 1,225 | 13.2 | +13.2 | |
Independent | Peter Crafter | 453 | 4.9 | +4.9 |
Party | Candidate | Votes | % | ±% | |
---|---|---|---|---|---|
Parliamentary Labor | Robert Richards (elected 1) | 2,197 | 42.9 | +33.5 | |
Parliamentary Labor | John Pedler (elected 2) | 161 | 3.2 | -46.9 | |
Independent | Cecil Chapman | 1,293 | 25.8 | +25.8 | |
Independent | Frank Filmer | 294 | 5.9 | -17.1 | |
Labor | Percival Chynoweth | 993 | 19.8 | +19.8 | |
Labor | John Phillips | 70 | 1.4 | +1.4 | |
Total formal votes | 5,008 | 97.0 | +0.9 | ||
Informal votes | 156 | 3.0 | −0.9 | ||
Turnout | 5,164 | 84.5 | +0.8 | ||
Party total votes | |||||
Parliamentary Labor | 2,358 | 47.1 | +47.1 | ||
Independent | 1,587 | 31.7 | -3.5 | ||
Labor | 1,063 | 21.2 | -38.3 |
Party | Candidate | Votes | % | ±% | |
---|---|---|---|---|---|
Labor | Horace Barnes | 5,534 | 31.5 | +31.5 | |
Labor | Harry Kneebone | 978 | 5.6 | +5.6 | |
Parliamentary Labor | John McInnes (elected 1) | 3,438 | 19.5 | -14.2 | |
Parliamentary Labor | Alfred Blackwell (elected 2) | 1,648 | 9.4 | -60.3 | |
Independent | Jules Langdon | 3,699 | 21.0 | +21.0 | |
Independent | Charles Lloyd | 460 | 2.6 | +2.6 | |
Lang Labor | Joseph Naylon | 1,064 | 6.1 | +6.1 | |
Lang Labor | Arthur Sonnemann | 67 | 0.4 | +0.4 | |
Communist | Thomas McGillick | 704 | 4.0 | +2.2 | |
Total formal votes | 17,592 | 94.0 | −0.8 | ||
Informal votes | 1,113 | 6.0 | +0.8 | ||
Turnout | 18,705 | 53.9 | −11.4 | ||
Party total votes | |||||
Labor | 6,512 | 37.0 | -38.0 | ||
Parliamentary Labor | 5,086 | 28.9 | +28.9 | ||
Independent | 4,159 | 23.6 | +23.6 | ||
Lang Labor | 1,131 | 6.4 | +6.4 | ||
Communist | 704 | 4.0 | +2.2 |
Party | Candidate | Votes | % | ±% | |
---|---|---|---|---|---|
Liberal and Country | Richard Butler (elected 1) | 3,256 | 46.3 | +0.7 | |
Liberal and Country | Archie Cameron (elected 2) | 481 | 6.8 | -42.0 | |
Liberal and Country | Samuel Dennison (elected 3) | 278 | 4.0 | +2.8 | |
Independent | Maurice Collins | 2,024 | 28.8 | +28.8 | |
Independent | Alfred Parker | 833 | 11.8 | +11.8 | |
Independent | Edgar Wills | 165 | 2.3 | +2.3 | |
Total formal votes | 7,037 | 95.1 | +0.1 | ||
Informal votes | 366 | 4.9 | −0.1 | ||
Turnout | 7,403 | 67.0 | −14.2 | ||
Party total votes | |||||
Liberal and Country | 4,015 | 57.1 | +8.3 | ||
Independent | Maurice Collins | 2,024 | 28.8 | +28.8 | |
Independent | Alfred Parker | 833 | 11.8 | +11.8 | |
Independent | Edgar Wills | 165 | 2.3 | +2.3 |
Party | Candidate | Votes | % | ±% | |
---|---|---|---|---|---|
Liberal and Country | Baden Pattinson (elected 2) | 2,254 | 42.5 | +15.7 | |
Liberal and Country | Edward Giles | 432 | 8.1 | +31.1 | |
Independent | Daniel Davies (elected 1) | 2,263 | 42.6 | +42.6 | |
Independent | Hugh Hudson | 358 | 6.8 | +6.8 | |
Total formal votes | 5,307 | 97.0 | +1.9 | ||
Informal votes | 164 | 3.0 | −1.9 | ||
Turnout | 5,471 | 71.8 | −1.7 | ||
Party total votes | |||||
Liberal and Country | 2,686 | 50.6 | -15.4 | ||
Independent | 2,621 | 49.6 | +49.6 |
The House of Assembly, or lower house; Is one of the two chambers of the Parliament of South Australia. The other is the Legislative Council. It sits in Parliament House in the state capital, Adelaide.
The Parliament of South Australia is the bicameral legislature of the Australian state of South Australia. It consists of the 47-seat House of Assembly and the 22-seat Legislative Council. General elections are held every 4 years, with all of the lower house and half of the upper house filled at each election. It follows a Westminster system of parliamentary government with the executive branch required to both sit in parliament and hold the confidence of the House of Assembly. The parliament is based at Parliament House on North Terrace in the state capital of Adelaide.
Since 1970, the South Australian House of Assembly — the lower house of the Parliament of South Australia — has consisted of 47 single-member electoral districts consisting of approximately the same number of enrolled voters. The district boundaries are regulated by the State Electoral Office, according to the requirements of the South Australian Constitution and are subject to mandatory redistributions by the South Australian Electoral Districts Boundaries Commission in order to respond to changing demographics.
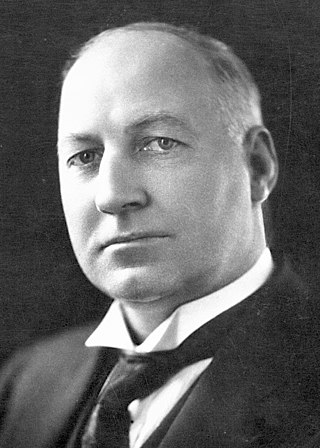
Sir Richard Layton Butler KCMG was the 31st Premier of South Australia, serving two disjunct terms in office: from 1927 to 1930, and again from 1933 to 1938.
The Liberal Federation was a South Australian political party from 16 October 1923 to 1932. It came into existence as a merger between the rival Liberal Union and National Party, to oppose Labor.
Andrew William Lacey was the 22nd Leader of the Opposition in the Parliament of South Australia from 1933 to 1938, representing the South Australian Branch of the Australian Labor Party. Lacey was previously the Labor member for the seat of Grey in the Australian House of Representatives from 1922 to 1931.
This is a list of members of the South Australian House of Assembly from 1933 to 1938, as elected at the 1933 state election:
Sydney McHugh was an Australian politician. Born in Quorn, South Australia, he was educated at state schools before becoming a farmer and grazier. He served in the military from 1914 to 1918, during World War I. In 1924, he was elected to the South Australian House of Assembly as the Labor member for Burra Burra. He was defeated in 1927, but held the seat again from 1930 to 1933.
State elections were held in South Australia on 3 March 1962. All 39 seats in the South Australian House of Assembly were up for election. The incumbent Liberal and Country League led by Premier of South Australia Thomas Playford IV defeated the Australian Labor Party led by Leader of the Opposition Frank Walsh.
State elections were held in South Australia on 5 April 1930. All 46 seats in the South Australian House of Assembly were up for election. The incumbent Liberal Federation government led by Premier of South Australia Richard L. Butler was defeated by the opposition Australian Labor Party led by Leader of the Opposition Lionel Hill.
State elections were held in South Australia on 8 April 1933. All 46 seats in the South Australian House of Assembly were up for election. The incumbent Parliamentary Labor Party government led by Premier Robert Richards was defeated by the opposition Liberal and Country League led by Leader of the Opposition Richard L. Butler. Each district elected multiple members.
State elections were held in South Australia on 19 March 1938. All 39 seats in the South Australian House of Assembly were up for election. The incumbent Liberal and Country League government led by Premier of South Australia Richard L. Butler defeated the opposition Australian Labor Party led by Leader of the Opposition Andrew Lacey.
This is a list of members of the Tasmanian Legislative Council between 1933 and 1939. Terms of the Legislative Council did not coincide with Legislative Assembly elections, and members served six year terms, with a number of members facing election each year.
Thomas Patrick Howard was an Australian trade unionist and politician. He was a member of the South Australian House of Assembly from 1933 to 1938, representing the Lang Labor Party (1933), South Australian Lang Labor Party (1933–1934) and Labor Party (1934–1938).
Even Ernest George was an Australian politician. He was the Labor member for Burra Burra in the South Australian House of Assembly from 1930 to 1933.
This is a list of members of the South Australian Legislative Council from 1933 to 1938
John Nicholas Pedler was an Australian politician. He was a member of the South Australian House of Assembly from 1918 to 1938, representing the electorate of Wallaroo.
Sir Herbert Sydney Hudd was an Australian politician who represented the South Australian House of Assembly seats of Torrens from 1912 to 1915 for the Liberal Union and Alexandra from 1920 to 1938 and from 1941 to 1948 for the Liberal Federation and the Liberal and Country League.
Samuel Dennison was an Australian politician. He represented the South Australian House of Assembly multi-member seat of Wooroora from 1930 to 1938 for the Country Party and its successor the Liberal and Country League.
George Cooke was an Australian politician who represented the South Australian House of Assembly multi-member seat of Barossa from 1924 to 1933. He was elected as a member of the Labor Party, but was expelled from the party in the 1931 Labor split and sat with the splinter Parliamentary Labor Party for the remainder of his term.