Results of the 1965 South Australian state election (House of Assembly)

Last updated

South Australian state election, 6 March 1965 [1]
House of Assembly
<< 19621968 >>

Contents

Enrolled voters562,824
Votes cast513,064 Turnout 94.59%+0.61%
Informal votes14,424Informal2.81%+0.35%
Summary of votes by party
PartyPrimary votes %SwingSeatsChange
  Labor 274,43255.04%+1.06%21+ 2
  Liberal and Country 179,18335.93%+1.43%17– 1
  Democratic Labor 21,6794.35%–3.40%0± 0
  Social Credit 9,5531.92%+1.92%0± 0
  National 2,2270.45%+0.45%0± 0
  Communist 2,2140.44%–0.18%0± 0
  Independent 9,3521.88%–1.27%1– 1
Total498,640  39 
Two-party-preferred
  Labor 54.30%0.00%
  Liberal and Country 45.70%0.00%

This is a list of House of Assembly results for the 1965 South Australian state election.

Results by electoral district

Adelaide

1965 South Australian state election: Adelaide [2]
PartyCandidateVotes%±%
Labor Sam Lawn 10,44472.9−4.0
Democratic Labor George Basivovs2,37216.6−1.9
Social Credit Thomas Ellis7745.4+5.4
Communist Elliott Johnston 7465.2+0.6
Total formal votes14,33692.9−2.1
Informal votes1,1007.1+2.1
Turnout 15,43691.9+0.8
Two-candidate-preferred result
Labor Sam Lawn 11,20478.2−2.1
Democratic Labor George Basivovs3,13221.8+2.1
Labor hold Swing -2.1

Albert

1965 South Australian state election: Albert
PartyCandidateVotes%±%
Liberal and Country Bill Nankivell unopposed
Liberal and Country hold Swing

Alexandra

1965 South Australian state election: Alexandra
PartyCandidateVotes%±%
Liberal and Country David Brookman 5,55757.7−1.1
Labor Desmond Merton4,06842.3+10.5
Total formal votes9,62598.1−0.5
Informal votes1851.9+0.5
Turnout 9,81095.8+0.1
Liberal and Country hold Swing -5.8

Angas

1965 South Australian state election: Angas
PartyCandidateVotes%±%
Liberal and Country Berthold Teusner unopposed
Liberal and Country hold Swing

Barossa

1965 South Australian state election: Barossa
PartyCandidateVotes%±%
Labor Molly Byrne 6,01551.5+51.5
Liberal and Country Condor Laucke 5,40546.2−39.7
Social Credit David Wood1651.4+1.4
Democratic Labor Andrew Shore1040.9+0.9
Total formal votes11,68998.6+5.7
Informal votes1701.4−5.7
Turnout 11,85995.6+1.2
Two-party-preferred result
Labor Molly Byrne 6,11352.3+52.3
Liberal and Country Condor Laucke 5,57647.7−38.2
Labor gain from Liberal and Country Swing N/A

Burnside

1965 South Australian state election: Burnside
PartyCandidateVotes%±%
Liberal and Country Joyce Steele 18,39459.6+1.1
Labor Joyce Henriott10,86435.2+0.8
Social Credit William Carruthers1,6245.3+5.3
Total formal votes30,88297.4−0.3
Informal votes8212.6+0.3
Turnout 31,70394.20.0
Two-party-preferred result
Liberal and Country Joyce Steele 19,20662.2−2.0
Labor Joyce Henriott11,67637.8+2.0
Liberal and Country hold Swing -2.0

Burra

1965 South Australian state election: Burra
PartyCandidateVotes%±%
Liberal and Country Percy Quirke 3,46762.3+18.8
Labor John Phelan2,10137.7+37.7
Total formal votes5,56898.6−0.2
Informal votes781.4+0.2
Turnout 5,64695.9+0.2
Liberal and Country gain from Independent Swing N/A

Chaffey

1965 South Australian state election: Chaffey
PartyCandidateVotes%±%
Labor Reg Curren 3,44948.6−1.5
Liberal and Country Harold King 3,35647.3−2.6
Independent Herbert Wilson1692.4+2.4
Democratic Labor William Ahern1241.8+1.8
Total formal votes7,09897.4−0.4
Informal votes1892.6+0.4
Turnout 7,28795.90.0
Two-party-preferred result
Labor Reg Curren 3,59950.7+0.6
Liberal and Country Harold King 3,49949.3−0.6
Labor hold Swing +0.6

Edwardstown

1965 South Australian state election: Edwardstown
PartyCandidateVotes%±%
Labor Frank Walsh 17,91760.4−11.2
Liberal and Country Laurence Daly9,57832.3+32.3
Democratic Labor Allan Anderson1,8946.4−22.0
Independent Brian Waters2971.0+1.0
Total formal votes29,68698.0+1.9
Informal votes5992.0−1.9
Turnout 30,28594.9+0.2
Two-party-preferred result
Labor Frank Walsh 18,35061.8−9.8
Liberal and Country Laurence Daly11,33638.2+38.2
Labor hold Swing N/A

Enfield

1965 South Australian state election: Enfield
PartyCandidateVotes%±%
Labor Jack Jennings 21,95161.2−16.5
Liberal and Country Allan Stock9,12525.4+25.4
Social Credit David Beavan2,9478.2+8.2
Democratic Labor Desmond Timlin1,4093.9−18.4
Communist Alan Miller4341.2+1.2
Total formal votes35,86696.5+0.7
Informal votes1,3013.5−0.7
Turnout 37,16795.1+1.2
Two-party-preferred result
Labor Jack Jennings 24,02567.0−10.7
Liberal and Country Allan Stock11,84133.0+33.0
Labor hold Swing N/A

Eyre

1965 South Australian state election: Eyre
PartyCandidateVotes%±%
Liberal and Country George Bockelberg 3,20646.8−53.2
Labor Isaac Rayson1,84326.9+26.9
National Harold Schiller1,80626.4+26.4
Total formal votes6,85598.4
Informal votes1101.6
Turnout 6,96595.6
Two-party-preferred result
Liberal and Country George Bockelberg 4,13060.2−39.8
Labor Isaac Rayson2,72539.8+39.8
Liberal and Country hold Swing N/A

Flinders

1965 South Australian state election: Flinders
PartyCandidateVotes%±%
Liberal and Country Glen Pearson 3,67853.6+0.1
Labor James Hudson2,68039.0−7.5
Democratic Labor Douglas Barnes5087.4+7.4
Total formal votes6,86698.6+0.4
Informal votes971.4−0.4
Turnout 6,96396.3+0.8
Two-party-preferred result
Liberal and Country Glen Pearson 4,11059.9+6.4
Labor James Hudson2,75640.1−6.4
Liberal and Country hold Swing +6.4

Frome

1965 South Australian state election: Frome
PartyCandidateVotes%±%
Labor Tom Casey 2,66657.9+2.3
Liberal and Country Maxwell Hams1,79939.0−1.3
Democratic Labor John McMahon1423.1−1.0
Total formal votes4,60798.5+0.5
Informal votes681.5−0.5
Turnout 4,67592.4+0.9
Two-party-preferred result
Labor Tom Casey 2,68758.3+2.1
Liberal and Country Maxwell Hams1,92041.7−2.1
Labor hold Swing +2.1

Gawler

1965 South Australian state election: Gawler
PartyCandidateVotes%±%
Labor John Clark 16,41364.8−1.5
Liberal and Country Phillip Hockey6,44125.4−4.1
Independent Desmond Clark1,8937.5+7.5
Independent John Fielder5692.3+2.3
Total formal votes25,31697.5−0.4
Informal votes6512.5+0.4
Turnout 25,96794.0+1.6
Two-party-preferred result
Labor John Clark 17,64469.7+2.8
Liberal and Country Phillip Hockey7,67230.3−2.8
Labor hold Swing +2.8

Glenelg

1965 South Australian state election: Glenelg
PartyCandidateVotes%±%
Labor Hugh Hudson 16,86951.5+7.4
Liberal and Country Baden Pattinson 14,61344.6−5.3
Democratic Labor Mark Posa1,2673.9−2.1
Total formal votes32,74998.6+0.1
Informal votes4571.4−0.1
Turnout 33,20695.0+0.8
Two-party-preferred result
Labor Hugh Hudson 17,05952.1+5.4
Liberal and Country Baden Pattinson 15,69047.9−5.4
Labor gain from Liberal and Country Swing +5.4

Gouger

1965 South Australian state election: Gouger
PartyCandidateVotes%±%
Liberal and Country Steele Hall 5,38463.5−36.5
Labor Robert Thredgold3,09436.5+36.5
Total formal votes8,47897.4
Informal votes2232.6
Turnout 8,70195.4
Liberal and Country hold Swing N/A

Gumeracha

1965 South Australian state election: Gumeracha
PartyCandidateVotes%±%
Liberal and Country Thomas Playford 4,36564.8−16.3
Labor Ernie Crimes 1,44921.5+21.5
Democratic Labor Patrick Coffey4206.2−12.7
Social Credit Marcus Dodd3755.6+5.6
Communist Brian Rooney1301.9+1.9
Total formal votes6,73997.9+2.5
Informal votes1432.1−2.5
Turnout 6,88296.2+0.4
Two-party-preferred result
Liberal and Country Thomas Playford 4,92373.1−8.0
Labor Ernie Crimes 1,81626.9+26.9
Liberal and Country hold Swing N/A

Hindmarsh

1965 South Australian state election: Hindmarsh
PartyCandidateVotes%±%
Labor Cyril Hutchens 16,24180.1−19.9
Democratic Labor Cyril Holasek4,02419.9+19.9
Total formal votes20,26594.7
Informal votes1,1365.3
Turnout 21,40194.2
Labor hold Swing N/A

Light

1965 South Australian state election: Light
PartyCandidateVotes%±%
Liberal and Country John Freebairn unopposed
Liberal and Country hold Swing

Millicent

1965 South Australian state election: Millicent
PartyCandidateVotes%±%
Labor Des Corcoran 4,16061.8+8.7
Liberal and Country John Osborne2,56938.2−7.1
Total formal votes6,72998.8−0.5
Informal votes781.2+0.5
Turnout 6,80795.0−1.5
Labor hold Swing +8.5

Mitcham

1965 South Australian state election: Mitcham
PartyCandidateVotes%±%
Liberal and Country Robin Millhouse 15,01565.6+1.8
Labor Murty Conlon7,42732.4+2.0
Social Credit Ernst Hergstrom4542.0+2.0
Total formal votes22,89698.2−0.6
Informal votes4411.8+0.6
Turnout 23,33793.8+1.3
Two-party-preferred result
Liberal and Country Robin Millhouse 15,24266.6−2.2
Labor Murty Conlon7,65433.4+2.2
Liberal and Country hold Swing -2.2

Mount Gambier

1965 South Australian state election: Mount Gambier
PartyCandidateVotes%±%
Labor Allan Burdon 5,39960.6−8.1
Liberal and Country Mary Hill3,50739.4+8.1
Total formal votes8,90698.2−0.4
Informal votes1661.8+0.4
Turnout 9,07294.5−0.5
Labor hold Swing -8.1

Murray

1965 South Australian state election: Murray
PartyCandidateVotes%±%
Labor Gabe Bywaters 5,14467.1−3.5
Liberal and Country Eric Doecke2,52232.9+3.5
Total formal votes7,66698.1−0.3
Informal votes1521.9+0.3
Turnout 7,81896.30.0
Labor hold Swing -3.5

Norwood

1965 South Australian state election: Norwood
PartyCandidateVotes%±%
Labor Don Dunstan 10,45257.6−0.5
Liberal and Country Sidney Daws7,67942.4+5.2
Total formal votes18,13196.7−1.4
Informal votes6103.3+1.4
Turnout 18,74193.4−0.4
Labor hold Swing -1.2

Onkaparinga

1965 South Australian state election: Onkaparinga
PartyCandidateVotes%±%
Liberal and Country Howard Shannon 3,83657.1+0.7
Labor Frank Staniford 2,60838.8−4.8
Social Credit Harvey Burns2784.1+4.1
Total formal votes6,72298.2+2.4
Informal votes1221.8−2.4
Turnout 6,84495.80.0
Two-party-preferred result
Liberal and Country Howard Shannon 3,97559.1+2.7
Labor Frank Staniford 2,74740.9−2.7
Liberal and Country hold Swing +2.7

Port Adelaide

1965 South Australian state election: Port Adelaide
PartyCandidateVotes%±%
Labor John Ryan 15,46076.8−6.5
Democratic Labor Donald Boys3,76818.7+5.6
Communist Peter Symon 9044.5+0.9
Total formal votes20,13294.3−1.7
Informal votes1,2165.7+1.7
Turnout 21,34894.7+1.1
Two-candidate-preferred result
Labor John Ryan 16,22880.6−5.7
Democratic Labor Donald Boys3,90419.4+5.7
Labor hold Swing -5.7

Port Pirie

1965 South Australian state election: Port Pirie
PartyCandidateVotes%±%
Labor Dave McKee 5,46889.4−1.4
Independent Allan Mossop64910.6+10.6
Total formal votes6,11796.8−0.1
Informal votes2043.2+0.1
Turnout 6,32196.2+1.4
Labor hold Swing -1.4

Ridley

1965 South Australian state election: Ridley
PartyCandidateVotes%±%
Independent Tom Stott 4,48366.9+28.2
Labor Arnold Busbridge2,21533.1+8.1
Total formal votes6,69898.4−0.6
Informal votes1061.6+0.6
Turnout 6,80498.0+1.8
Independent hold Swing N/A

Rocky River

1965 South Australian state election: Rocky River
PartyCandidateVotes%±%
Liberal and Country James Heaslip 3,65266.6−33.4
Labor George Smart1,83233.4+33.4
Total formal votes5,48498.3
Informal votes961.7
Turnout 5,58096.5
Liberal and Country hold Swing N/A

Semaphore

1965 South Australian state election: Semaphore
PartyCandidateVotes%±%
Labor Reg Hurst 16,43078.1−21.9
Democratic Labor Charles Coffey2,74713.1+13.1
Social Credit George Heritage1,8218.7+8.7
Total formal votes21,02894.9
Informal votes1,1165.1
Turnout 22,14495.5
Two-candidate-preferred result
Labor Reg Hurst 17,34182.5−17.5
Democratic Labor Charles Coffey3,68717.5+17.5
Labor hold Swing N/A

Stirling

1965 South Australian state election: Stirling
PartyCandidateVotes%±%
Liberal and Country William McAnaney 4,90670.9+4.7
Labor Allan Stevens2,01129.1+29.1
Total formal votes6,91799.0+0.5
Informal votes1021.5−0.5
Turnout 6,98996.5+0.4
Liberal and Country hold Swing N/A

Stuart

1965 South Australian state election: Stuart
PartyCandidateVotes%±%
Labor Lindsay Riches 6,61887.7−0.3
Independent William Young92612.3+12.3
Total formal votes7,54495.7−0.7
Informal votes3364.3+0.7
Turnout 7,88093.1−0.2
Labor hold Swing -0.3

Torrens

1965 South Australian state election: Torrens
PartyCandidateVotes%±%
Liberal and Country John Coumbe 8,93748.5−1.3
Labor Chris Hurford 8,06343.7−1.6
Democratic Labor Charles Bradley1,1366.2+1.4
Social Credit Russell Sellars3101.7+1.7
Total formal votes18,44697.9−0.5
Informal votes3972.1+0.5
Turnout 18,84394.2+0.2
Two-party-preferred result
Liberal and Country John Coumbe 9,98254.1+0.2
Labor Chris Hurford 8,46445.9−0.2
Liberal and Country hold Swing +0.2

Unley

1965 South Australian state election: Unley
PartyCandidateVotes%±%
Labor Gil Langley 9,06250.7+0.2
Liberal and Country John McLeay 8,02444.9+1.7
Democratic Labor Mary Dempsey6603.7+3.7
Independent John Hennessey790.4+0.4
Independent William Wallace560.3+0.3
Total formal votes17,88197.6+4.9
Informal votes4552.4−4.9
Turnout 18,33694.0+1.3
Two-party-preferred result
Labor Gil Langley 9,22951.6−2.0
Liberal and Country John McLeay 8,65248.4+2.0
Labor hold Swing -2.0

Victoria

1965 South Australian state election: Victoria
PartyCandidateVotes%±%
Liberal and Country Allan Rodda 3,51151.1−2.6
Labor David Walker2,71339.5−6.8
National James McLachlan4216.1+6.1
Independent John Gartner2213.2+3.2
Total formal votes6,86699.1+0.1
Informal votes590.9−0.1
Turnout 6,92595.2+0.1
Two-party-preferred result
Liberal and Country Allan Rodda 4,00158.3+4.6
Labor David Walker2,86541.7−4.6
Liberal and Country hold Swing +4.6

Wallaroo

1965 South Australian state election: Wallaroo
PartyCandidateVotes%±%
Labor Lloyd Hughes 3,34659.1−3.8
Liberal and Country Clarence Green2,31340.9+3.8
Total formal votes5,65998.1−0.7
Informal votes1121.9+0.7
Turnout 5,77196.5−0.1
Labor hold Swing -3.8

West Torrens

1965 South Australian state election: West Torrens
PartyCandidateVotes%±%
Labor Glen Broomhill 18,49656.8−0.7
Liberal and Country Parker Morton14,06843.2+4.8
Total formal votes32,56497.3−1.3
Informal votes8992.7+1.3
Turnout 33,46394.1+0.3
Labor hold Swing -1.3

Whyalla

1965 South Australian state election: Whyalla
PartyCandidateVotes%±%
Labor Ron Loveday 7,58979.8−7.5
Democratic Labor Gordon Kimpton1,04311.0+11.0
Independent Clarence Young5445.7+5.7
Independent James Yates3323.5+3.5
Total formal votes9,50896.4−0.5
Informal votes3483.6+0.5
Turnout 9,85687.6−1.0
Two-candidate-preferred result
Labor Ron Loveday 8,02784.4−2.9
Democratic Labor Gordon Kimpton1,48115.6+15.6
Labor hold Swing N/A

Yorke Peninsula

1965 South Australian state election: Yorke Peninsula
PartyCandidateVotes%±%
Liberal and Country James Ferguson 4,27669.5−30.5
Labor Michael Kennedy1,87530.5+30.5
Total formal votes6,15198.2
Informal votes1111.8
Turnout 6,26297.5
Liberal and Country hold Swing N/A

See also

Related Research Articles

<span class="mw-page-title-main">South Australian Legislative Council</span> Upper house of the parliament in South Australia, Australia

The Legislative Council, or upper house, is one of the two chambers of the Parliament of South Australia. Its central purpose is to act as a house of review for legislation passed through the lower house, the House of Assembly. It sits in Parliament House in the state capital, Adelaide.

<span class="mw-page-title-main">South Australian House of Assembly</span> Lower house of the states Parliament

The House of Assembly, or lower house; Is one of the two chambers of the Parliament of South Australia. The other is the Legislative Council. It sits in Parliament House in the state capital, Adelaide.

<span class="mw-page-title-main">Parliament of South Australia</span> Bicameral legislature of the Australian state of South Australia

The Parliament of South Australia is the bicameral legislature of the Australian state of South Australia. It consists of the 47-seat House of Assembly and the 22-seat Legislative Council. General elections are held every 4 years, with all of the lower house and half of the upper house filled at each election. It follows a Westminster system of parliamentary government with the executive branch required to both sit in parliament and hold the confidence of the House of Assembly. The parliament is based at Parliament House on North Terrace in the state capital of Adelaide.

<span class="mw-page-title-main">2006 South Australian state election</span>

The state election for the 51st Parliament of South Australia was held in the Australian state of South Australia on 18 March 2006 to elect all members of the South Australian House of Assembly and 11 members of the South Australian Legislative Council. The election was conducted by the independent State Electoral Office.

<span class="mw-page-title-main">Electoral district of Torrens</span> Australian electorate

Torrens is a single-member electoral district for the South Australian House of Assembly. Located along the River Torrens, it is named after Sir Robert Richard Torrens, a 19th-century Premier of South Australia noted for being the founder of the "Torrens title" land registration system. Torrens is an 18.8 square kilometres (7.3 sq mi) suburban electorate in Adelaide's north-east. It includes the suburbs of Gilles Plains, Greenacres, Hampstead Gardens, Hillcrest, Holden Hill, Klemzig, Manningham, Oakden, Vale Park, Valley View and Windsor Gardens.

<span class="mw-page-title-main">South Australian National Party</span> Political party

The South Australian National Party is a political party in South Australia, and an affiliated state party of the National Party of Australia. Like the National Party of Western Australia, it is an independent party, and not part of the Liberal/National Coalition. First contesting the 1965 state election, the party has held two South Australian House of Assembly seats at alternating periods: Peter Blacker (1973–1993) in Flinders; and Karlene Maywald (1997–2010) in Chaffey.

<span class="mw-page-title-main">1973 South Australian state election</span>

State elections were held in South Australia on 10 March 1973. All 47 seats in the South Australian House of Assembly were up for election. The incumbent Australian Labor Party led by Premier of South Australia Don Dunstan won a second term in government, defeating the Liberal and Country League led by Leader of the Opposition Bruce Eastick.

<span class="mw-page-title-main">1970 South Australian state election</span>

State elections were held in South Australia on 30 May 1970. All 47 seats in the South Australian House of Assembly were up for election. The incumbent Liberal and Country League led by Premier of South Australia Steele Hall was defeated by the Australian Labor Party led by Leader of the Opposition Don Dunstan.

<span class="mw-page-title-main">1965 South Australian state election</span>

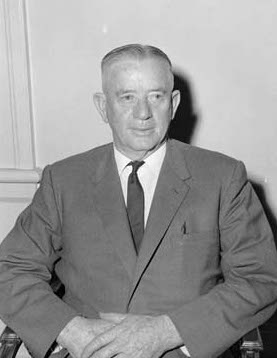
State elections were held in South Australia on 6 March 1965. All 39 seats in the South Australian House of Assembly were up for election. The incumbent Liberal and Country League led by Premier of South Australia Thomas Playford IV, in power since 1938, was defeated by the Australian Labor Party led by Leader of the Opposition Frank Walsh.

<span class="mw-page-title-main">1962 South Australian state election</span>

State elections were held in South Australia on 3 March 1962. All 39 seats in the South Australian House of Assembly were up for election. The incumbent Liberal and Country League led by Premier of South Australia Thomas Playford IV defeated the Australian Labor Party led by Leader of the Opposition Frank Walsh.

<span class="mw-page-title-main">1896 South Australian colonial election</span>

The 1896 South Australian colonial election was held on 25 April 1896 to elect all 54 seats in the South Australian House of Assembly. In the seat of Northern Territory, the election was on 2 May. All 54 seats in the South Australian House of Assembly were up for election. The incumbent liberal government led by Premier of South Australia Charles Kingston in an informal coalition with the United Labor Party (ULP) led by John McPherson defeated the conservative opposition. Each district elected multiple members, with voters casting multiple votes.

<span class="mw-page-title-main">2014 South Australian state election</span>

The 2014 South Australian state election elected members to the 53rd Parliament of South Australia on 15 March 2014, to fill all 47 seats in the House of Assembly and 11 of 22 seats in the Legislative Council. The 12-year-incumbent Australian Labor Party (SA) government, led by Premier Jay Weatherill, won its fourth consecutive four-year term in government, a record 16 years of Labor government, defeating the opposition Liberal Party of Australia (SA), led by Opposition Leader Steven Marshall.

Murray is a defunct electoral district that elected members to the House of Assembly, the lower house of the bicameral legislature of the Australian state of South Australia. The electorate, incorporating part of the River Murray, was rural in nature, with Mannum the only large town within its boundaries. From its establishment to the 1938 state election, Murray was a three-member electorate, but was made a single-member electorate afterwards, as part of a system of electoral malapportionment known as the "Playmander". In both incarnations it elected candidates from both major parties as marginal and safe seat holders at various times. If just 21 LCL votes were Labor votes in Murray at the 1968 election, Labor would have formed majority government. Murray was one of two gains in 1968 that put the LCL in office. The electorate was abolished prior to the 1985 election, with its territory now forming part of the districts of Hammond, Kavel, and Schubert. In total, 24 people represented Murray between 1902 and 1985, with its most notable member being Thomas Playford IV, who later served as Premier of South Australia.

<span class="mw-page-title-main">2018 South Australian state election</span>

The 2018 South Australian state election to elect members to the 54th Parliament of South Australia was held on 17 March 2018. All 47 seats in the House of Assembly or lower house, whose members were elected at the 2014 election, and 11 of 22 seats in the Legislative Council or upper house, last filled at the 2010 election, were contested. The record-16-year-incumbent Australian Labor Party (SA) government led by Premier Jay Weatherill was seeking a fifth four-year term, but was defeated by the opposition Liberal Party of Australia (SA), led by Opposition Leader Steven Marshall. Nick Xenophon's new SA Best party unsuccessfully sought to obtain the balance of power.

This is a list of House of Assembly results for the 1962 South Australian state election.

<span class="mw-page-title-main">South Australian Labor Party</span> Political party in Australia

The South Australian Labor Party, officially known as the Australian Labor Party (South Australian Branch) and commonly referred to simply as South Australian Labor, is the South Australian Branch of the Australian Labor Party, originally formed in 1891 as the United Labor Party of South Australia. It is one of two major parties in the bicameral Parliament of South Australia, the other being the Liberal Party of Australia (SA Division).

<span class="mw-page-title-main">South Australian Liberal Party</span> Political party in Australia

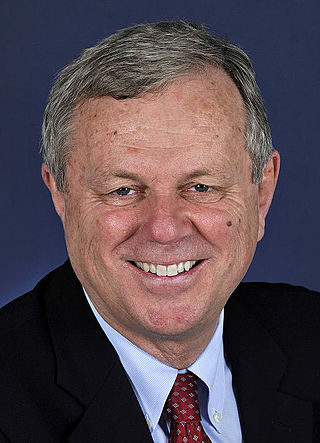
The South Australian Liberal Party, officially known as the Liberal Party of Australia (South Australian Division), and often shortened to SA Liberals, is the South Australian Division of the Liberal Party of Australia. It was formed as the Liberal and Country League (LCL) in 1932 and became the South Australian Division of the Liberal Party when the Liberal Party was formed in 1945. It retained its Liberal and Country League name before changing to its current name in 1974. It is one of two major parties in the bicameral Parliament of South Australia, the other being the Australian Labor Party (SA Branch). The party has been led by Leader of the Opposition David Speirs since the 2022 state election after a one-term government.

<span class="mw-page-title-main">SA-Best</span> Political party in Australia

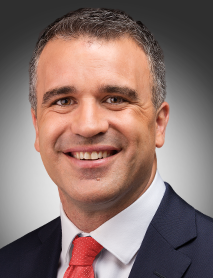
SA-Best, formerly known as Nick Xenophon's SA-BEST, is a political party in South Australia. It was founded in 2017 by Nick Xenophon as a state-based partner to his Nick Xenophon Team party. After an unsuccessful 2022 South Australian state election, the party has one representative in the South Australian Legislative Council, Connie Bonaros, whose term expires in 2026.

<span class="mw-page-title-main">2022 South Australian state election</span>

The 2022 South Australian state election was held on 19 March 2022 to elect members to the 55th Parliament of South Australia. All 47 seats in the House of Assembly, and half the seats in the Legislative Council were up for re-election.

References

  1. "Details of SA 1965 Election". Australian Politics and Elections Database.
  2. "History of South Australian Elections 1857 - 2006". Electoral Commission SA. Retrieved 13 March 2014.