South Australian state election, 17 September 1977 [1] Contents
| ||||||
---|---|---|---|---|---|---|
Enrolled voters | 818,341 | |||||
Votes cast | 764,077 | Turnout | 93.37 | -0.19 | ||
Informal votes | 20,743 | Informal | 2.71 | -1.14 | ||
Summary of votes by party | ||||||
Party | Primary votes | % | Swing | Seats | Change | |
Labor | 383,831 | 51.64 | +5.31 | 27 | + 4 | |
Liberal | 306,356 | 41.21 | +9.68 | 17 | – 3 | |
Democrats | 25,855 | 3.48 | * | 1 | – 1 | |
National Country | 11,855 | 1.59 | -1.18 | 1 | ± 0 | |
Independent Liberal | 10,793 | 1.45 | * | 1 | + 1 | |
Independent | 2,914 | 0.39 | -0.51 | 0 | – 1 | |
Other | 1,730 | 0.23 | * | 0 | ± 0 | |
Total | 743,334 | 47 | ||||
Two-party-preferred | ||||||
Labor | 396,957 | 53.40 | +4.20 | |||
Liberal | 346,372 | 46.60 | –4.20 |
This is a list of House of Assembly results for the 1977 South Australian state election.
Party | Candidate | Votes | % | ±% | |
---|---|---|---|---|---|
Labor | Jack Wright | 9,996 | 66.2 | +5.9 | |
Liberal | Terry McClean | 5,102 | 33.8 | +12.8 | |
Total formal votes | 15,098 | 96.1 | |||
Informal votes | 605 | 3.9 | |||
Turnout | 15,703 | 90.1 | |||
Labor hold | Swing | +4.0 | |||
Party | Candidate | Votes | % | ±% | |
---|---|---|---|---|---|
Labor | Charles Harrison | 10,188 | 64.1 | +2.1 | |
Liberal | Glendon Stotter | 5,701 | 35.9 | +13.5 | |
Total formal votes | 15,889 | 96.2 | |||
Informal votes | 621 | 3.8 | |||
Turnout | 16,510 | 94.6 | |||
Labor hold | Swing | 0.0 | |||
Party | Candidate | Votes | % | ±% | |
---|---|---|---|---|---|
Liberal | Ted Chapman | 9,822 | 61.5 | +8.6 | |
Labor | Kenneth Jared | 4,159 | 26.1 | +6.7 | |
Democrats | Kaye Gibbs | 1,976 | 12.4 | +12.4 | |
Total formal votes | 15,957 | 98.2 | |||
Informal votes | 298 | 1.8 | |||
Turnout | 16,255 | 93.8 | |||
Two-party-preferred result | |||||
Liberal | Ted Chapman | 11,134 | 69.8 | −6.6 | |
Labor | Kenneth Jared | 4,823 | 30.2 | +6.6 | |
Liberal hold | Swing | -6.6 | |||
Party | Candidate | Votes | % | ±% | |
---|---|---|---|---|---|
Labor | Geoff Virgo | 9,331 | 59.2 | +1.1 | |
Liberal | Dean Le Poidevin | 4,594 | 29.1 | +5.3 | |
Democrats | Kenneth Johnson | 1,845 | 11.7 | +11.7 | |
Total formal votes | 15,770 | 98.1 | |||
Informal votes | 299 | 1.9 | |||
Turnout | 16,069 | 94.3 | |||
Two-party-preferred result | |||||
Labor | Geoff Virgo | 9,856 | 62.5 | +1.7 | |
Liberal | Dean Le Poidevin | 5,914 | 37.5 | −1.7 | |
Labor hold | Swing | +1.7 | |||
Party | Candidate | Votes | % | ±% | |
---|---|---|---|---|---|
Labor | Don Hopgood | 11,463 | 66.7 | +9.6 | |
Liberal | Mervyn Sawade | 5,722 | 33.3 | +11.9 | |
Total formal votes | 17,185 | 96.0 | |||
Informal votes | 713 | 4.0 | |||
Turnout | 17,898 | 93.7 | |||
Labor hold | Swing | +6.4 | |||
Party | Candidate | Votes | % | ±% | |
---|---|---|---|---|---|
Liberal | David Tonkin | 10,134 | 65.3 | +12.8 | |
Labor | Kevin Winn | 5,390 | 34.7 | +7.3 | |
Total formal votes | 15,524 | 97.6 | |||
Informal votes | 380 | 2.4 | |||
Turnout | 15,904 | 91.6 | |||
Liberal hold | Swing | -4.2 | |||
Party | Candidate | Votes | % | ±% | |
---|---|---|---|---|---|
Labor | Hugh Hudson | 8,911 | 52.6 | −0.6 | |
Liberal | Natalie Richardson | 5,822 | 34.3 | +13.1 | |
Democrats | Ronald Moulds | 2,224 | 13.1 | +13.1 | |
Total formal votes | 16,957 | 98.5 | |||
Informal votes | 256 | 1.5 | |||
Turnout | 17,213 | 94.7 | |||
Two-party-preferred result | |||||
Labor | Hugh Hudson | 9,848 | 58.1 | +1.3 | |
Liberal | Natalie Richardson | 7,109 | 41.9 | −1.3 | |
Labor hold | Swing | +1.3 | |||
Party | Candidate | Votes | % | ±% | |
---|---|---|---|---|---|
Liberal | Peter Arnold | 9,522 | 59.6 | +7.5 | |
Labor | John Howe | 6,445 | 40.4 | +11.0 | |
Total formal votes | 15,967 | 97.5 | |||
Informal votes | 401 | 2.5 | |||
Turnout | 16,368 | 93.4 | |||
Liberal hold | Swing | -8.2 | |||
Party | Candidate | Votes | % | ±% | |
---|---|---|---|---|---|
Liberal | Jennifer Adamson | 8,355 | 51.4 | +12.7 | |
Labor | Greg Crafter | 7,903 | 48.6 | +5.1 | |
Total formal votes | 16,258 | 97.2 | |||
Informal votes | 468 | 2.8 | |||
Turnout | 16,726 | 94.4 | |||
Liberal hold | Swing | -2.4 | |||
Party | Candidate | Votes | % | ±% | |
---|---|---|---|---|---|
Liberal | Dean Brown | 10,311 | 64.5 | +11.8 | |
Labor | Terry Cameron | 3,226 | 20.2 | −2.8 | |
Democrats | Michael Lee | 2,112 | 13.2 | +13.2 | |
Workers | Ewan Hutchison | 345 | 2.1 | +2.1 | |
Total formal votes | 15,994 | 98.8 | |||
Informal votes | 200 | 1.2 | |||
Turnout | 16,194 | 92.9 | |||
Two-party-preferred result | |||||
Liberal | Dean Brown | 11,865 | 74.2 | +0.9 | |
Labor | Terry Cameron | 4,129 | 25.8 | −0.9 | |
Liberal hold | Swing | +0.9 | |||
Party | Candidate | Votes | % | ±% | |
---|---|---|---|---|---|
Labor | Peter Duncan | 11,082 | 72.4 | +8.4 | |
Liberal | Anthony Hutton | 4,235 | 27.6 | +11.8 | |
Total formal votes | 15,317 | 94.7 | |||
Informal votes | 862 | 5.3 | |||
Turnout | 16,179 | 92.4 | |||
Labor hold | Swing | +4.3 | |||
Party | Candidate | Votes | % | ±% | |
---|---|---|---|---|---|
Liberal | Graham Gunn | 7,259 | 53.5 | −2.5 | |
Labor | Michael Sachsse | 3,179 | 23.4 | −14.4 | |
Labor | Barry Piltz | 3,131 | 23.1 | +23.1 | |
Total formal votes | 13,569 | 97.9 | |||
Informal votes | 296 | 2.1 | |||
Turnout | 13,865 | 88.8 | |||
Two-party-preferred result | |||||
Liberal | Graham Gunn | 7,589 | 55.9 | −5.4 | |
Labor | Michael Sachsse | 5,980 | 44.1 | +5.4 | |
Liberal hold | Swing | -5.4 | |||
Party | Candidate | Votes | % | ±% | |
---|---|---|---|---|---|
Liberal | Stan Evans | 10,429 | 60.4 | +17.9 | |
Labor | Sean Dawes | 6,828 | 39.6 | +6.4 | |
Total formal votes | 17,257 | 97.5 | |||
Informal votes | 439 | 2.5 | |||
Turnout | 17,696 | 93.6 | |||
Liberal hold | Swing | -2.3 | |||
Party | Candidate | Votes | % | ±% | |
---|---|---|---|---|---|
National | Peter Blacker | 7,618 | 51.5 | +11.2 | |
Labor | Terrence Krieg | 3,700 | 25.0 | +0.3 | |
Liberal | Victor Gerschwitz | 3,477 | 23.5 | −8.4 | |
Total formal votes | 14,795 | 98.7 | |||
Informal votes | 188 | 1.3 | |||
Turnout | 14,983 | 95.2 | |||
Two-party-preferred result | |||||
National | Peter Blacker | 10,986 | 74.2 | +2.9 | |
Labor | Terrence Krieg | 3,809 | 25.8 | +25.8 | |
National hold | Swing | N/A | |||
Party | Candidate | Votes | % | ±% | |
---|---|---|---|---|---|
Labor | Charles Wells | 10,824 | 67.0 | +6.1 | |
Liberal | John Wadey | 5,325 | 33.0 | +11.7 | |
Total formal votes | 16,149 | 96.6 | |||
Informal votes | 573 | 3.4 | |||
Turnout | 16,722 | 93.3 | |||
Labor hold | Swing | +3.4 | |||
Party | Candidate | Votes | % | ±% | |
---|---|---|---|---|---|
Labor | Jack Slater | 9,339 | 58.1 | +2.7 | |
Liberal | Lois Bell | 4,905 | 30.5 | +7.5 | |
Democrats | Andrew Graham | 1,841 | 11.4 | +11.4 | |
Total formal votes | 16,085 | 97.9 | |||
Informal votes | 350 | 2.1 | |||
Turnout | 16,435 | 93.7 | |||
Two-party-preferred result | |||||
Labor | Jack Slater | 10,101 | 62.8 | +3.7 | |
Liberal | Lois Bell | 5,984 | 37.2 | −3.7 | |
Labor hold | Swing | +3.7 | |||
Party | Candidate | Votes | % | ±% | |
---|---|---|---|---|---|
Liberal | John Mathwin | 9,421 | 59.5 | +23.9 | |
Labor | Barbara Wiese | 6,423 | 40.5 | −0.4 | |
Total formal votes | 15,844 | 97.7 | |||
Informal votes | 374 | 2.3 | |||
Turnout | 16,218 | 92.8 | |||
Liberal hold | Swing | +4.2 | |||
Party | Candidate | Votes | % | ±% | |
---|---|---|---|---|---|
Liberal | David Boundy | 6,088 | 38.8 | +1.3 | |
Independent Liberal | Keith Russack | 5,907 | 37.7 | +37.7 | |
Labor | Roger Thomas | 3,690 | 23.5 | +4.6 | |
Total formal votes | 15,685 | 98.6 | |||
Informal votes | 226 | 1.4 | |||
Turnout | 15,911 | 94.7 | |||
Two-candidate-preferred result | |||||
Independent Liberal | Keith Russack | 9,082 | 57.9 | +57.9 | |
Liberal | David Boundy | 6,603 | 42.1 | ||
Independent Liberal gain from Liberal Movement | Swing | N/A | |||
Party | Candidate | Votes | % | ±% | |
---|---|---|---|---|---|
Liberal | Heini Becker | 8,885 | 55.4 | +18.1 | |
Labor | Reece Jennings | 7,150 | 44.6 | +2.0 | |
Total formal votes | 16,035 | 97.0 | |||
Informal votes | 490 | 3.0 | |||
Turnout | 16,525 | 92.9 | |||
Liberal hold | Swing | +1.1 | |||
Party | Candidate | Votes | % | ±% | |
---|---|---|---|---|---|
Labor | Des Corcoran | 9,965 | 58.5 | +7.2 | |
Liberal | George Trotta | 6,329 | 37.2 | +9.1 | |
Workers | William Forster | 734 | 4.3 | +4.3 | |
Total formal votes | 17,028 | 96.8 | |||
Informal votes | 556 | 3.2 | |||
Turnout | 17,584 | 94.1 | |||
Two-party-preferred result | |||||
Labor | Des Corcoran | 10,292 | 60.4 | +5.7 | |
Liberal | George Trotta | 6,736 | 39.6 | −5.7 | |
Labor hold | Swing | +5.7 | |||
Party | Candidate | Votes | % | ±% | |
---|---|---|---|---|---|
Labor | Glen Broomhill | 9,780 | 59.3 | +4.4 | |
Liberal | Barry Lawson | 6,702 | 40.7 | +11.3 | |
Total formal votes | 16,482 | 96.5 | |||
Informal votes | 590 | 3.5 | |||
Turnout | 17,072 | 94.0 | |||
Labor hold | Swing | +2.0 | |||
Party | Candidate | Votes | % | ±% | |
---|---|---|---|---|---|
Liberal | Roger Goldsworthy | 10,260 | 63.8 | +12.6 | |
Labor | Sydney Tilmouth | 4,589 | 28.5 | +8.1 | |
Democrats | Reginald Goldsworthy | 1,244 | 7.7 | +7.7 | |
Total formal votes | 16,093 | 98.2 | |||
Informal votes | 288 | 1.8 | |||
Turnout | 16,381 | 94.4 | |||
Two-party-preferred result | |||||
Liberal | Roger Goldsworthy | 11,064 | 68.7 | −6.3 | |
Labor | Sydney Tilmouth | 5,029 | 31.3 | +6.3 | |
Liberal hold | Swing | -6.3 | |||
Party | Candidate | Votes | % | ±% | |
---|---|---|---|---|---|
Liberal | Bruce Eastick | 8,968 | 60.7 | +12.0 | |
Labor | James Reese | 5,815 | 39.3 | +9.3 | |
Total formal votes | 14,783 | 97.6 | |||
Informal votes | 362 | 2.4 | |||
Turnout | 15,145 | 93.7 | |||
Liberal hold | Swing | -6.1 | |||
Party | Candidate | Votes | % | ±% | |
---|---|---|---|---|---|
Liberal | Bill Nankivell | 8,684 | 60.5 | +6.4 | |
Labor | Gerald Lea | 3,353 | 23.3 | +4.4 | |
National | Leslie Ficken | 2,329 | 16.2 | +2.4 | |
Total formal votes | 14,366 | 98.1 | |||
Informal votes | 283 | 1.9 | |||
Turnout | 14,649 | 94.4 | |||
Two-party-preferred result | |||||
Liberal | Bill Nankivell | 10,611 | 73.8 | −2.6 | |
Labor | Gerald Lea | 3,755 | 26.2 | +2.6 | |
Liberal hold | Swing | -2.6 | |||
Party | Candidate | Votes | % | ±% | |
---|---|---|---|---|---|
Labor | Leslie Drury | 9,428 | 51.8 | +1.1 | |
Liberal | Tony Boyle | 6,858 | 37.6 | +18.0 | |
Democrats | Charles Ferdinands | 1,924 | 10.6 | +10.6 | |
Total formal votes | 18,210 | 98.4 | |||
Informal votes | 295 | 1.6 | |||
Turnout | 18,505 | 95.7 | |||
Two-party-preferred result | |||||
Labor | Leslie Drury | 10,283 | 56.5 | +1.3 | |
Liberal | Tony Boyle | 7,927 | 43.5 | +43.5 | |
Labor hold | Swing | N/A | |||
Party | Candidate | Votes | % | ±% | |
---|---|---|---|---|---|
Liberal | Robert Worth | 6,663 | 41.8 | +14.1 | |
Democrats | Robin Millhouse | 5,146 | 32.3 | +32.3 | |
Labor | Rosemary Crowley | 4,130 | 25.9 | −3.2 | |
Total formal votes | 15,939 | 99.0 | |||
Informal votes | 166 | 1.0 | |||
Turnout | 16,105 | 93.0 | |||
Two-candidate-preferred result | |||||
Democrats | Robin Millhouse | 9,002 | 56.5 | +56.5 | |
Liberal | Robert Worth | 6,937 | 43.5 | +43.5 | |
Democrats gain from Liberal Movement | Swing | N/A | |||
Party | Candidate | Votes | % | ±% | |
---|---|---|---|---|---|
Labor | Ron Payne | 8,952 | 56.1 | +1.9 | |
Liberal | June Schaeffer | 5,046 | 31.6 | +7.6 | |
Democrats | Kevin Whitby | 1,566 | 9.8 | +9.8 | |
Independent | Peter Amor | 250 | 1.6 | +1.6 | |
Workers | John Pocius | 137 | 0.9 | +0.9 | |
Total formal votes | 15,951 | 97.8 | |||
Informal votes | 351 | 2.2 | |||
Turnout | 16,302 | 93.5 | |||
Two-party-preferred result | |||||
Labor | Ron Payne | 9,794 | 61.4 | +1.6 | |
Liberal | June Schaeffer | 6,157 | 38.6 | −1.6 | |
Labor hold | Swing | +1.6 | |||
Party | Candidate | Votes | % | ±% | |
---|---|---|---|---|---|
Labor | Terry Groom | 7,581 | 47.5 | +5.2 | |
Liberal | Mark Hamilton | 7,026 | 44.0 | +5.3 | |
Democrats | Margaret Sesr | 1,361 | 8.5 | +8.5 | |
Total formal votes | 15,968 | 98.0 | |||
Informal votes | 333 | 2.0 | |||
Turnout | 16,301 | 93.2 | |||
Two-party-preferred result | |||||
Labor | Terry Groom | 8,040 | 50.3 | +5.2 | |
Liberal | Mark Hamilton | 7,928 | 49.7 | −5.2 | |
Labor gain from Liberal | Swing | +5.2 | |||
Party | Candidate | Votes | % | ±% | |
---|---|---|---|---|---|
Liberal | Harold Allison | 8,181 | 51.4 | +13.7 | |
Labor | James Hennessy | 7,726 | 48.6 | +7.3 | |
Total formal votes | 15,907 | 98.1 | |||
Informal votes | 308 | 1.9 | |||
Turnout | 16,215 | 94.9 | |||
Liberal hold | Swing | -1.7 | |||
Party | Candidate | Votes | % | ±% | |
---|---|---|---|---|---|
Labor | Douglas Gerrie | 5,734 | 35.9 | +1.8 | |
Liberal | David Wotton | 5,121 | 32.0 | −20.2 | |
Independent Liberal | Ivon Wardle | 4,886 | 30.6 | +30.6 | |
Independent | Maurice Thiele | 243 | 1.5 | +1.5 | |
Total formal votes | 15,984 | 98.1 | |||
Informal votes | 305 | 1.9 | |||
Turnout | 16,289 | 93.9 | |||
Two-party-preferred result | |||||
Liberal | David Wotton | 9,595 | 60.0 | −3.0 | |
Labor | Douglas Gerrie | 6,389 | 40.0 | +3.0 | |
Liberal hold | Swing | -3.0 | |||
Party | Candidate | Votes | % | ±% | |
---|---|---|---|---|---|
Labor | Terry Hemmings | 10,350 | 71.0 | +3.3 | |
Liberal | Elizabeth Pooley | 4,238 | 29.0 | +10.9 | |
Total formal votes | 14,588 | 95.2 | |||
Informal votes | 727 | 4.8 | |||
Turnout | 15,315 | 91.6 | |||
Labor hold | Swing | +1.2 | |||
Party | Candidate | Votes | % | ±% | |
---|---|---|---|---|---|
Labor | John Klunder | 9,437 | 53.7 | +0.1 | |
Liberal | Emily Perry | 5,774 | 32.9 | +9.0 | |
Democrats | Betty Knott | 2,345 | 13.4 | +13.4 | |
Total formal votes | 17,556 | 97.9 | |||
Informal votes | 380 | 2.1 | |||
Turnout | 17,936 | 94.2 | |||
Two-party-preferred result | |||||
Labor | John Klunder | 10,350 | 59.8 | +2.3 | |
Liberal | Emily Perry | 7,056 | 40.2 | −2.3 | |
Labor hold | Swing | +2.3 | |||
Party | Candidate | Votes | % | ±% | |
---|---|---|---|---|---|
Labor | Don Dunstan | 9,361 | 60.2 | +4.6 | |
Liberal | William Zacharia | 6,181 | 39.8 | +8.2 | |
Total formal votes | 15,542 | 96.8 | |||
Informal votes | 505 | 3.2 | |||
Turnout | 16,047 | 90.5 | |||
Labor hold | Swing | +2.7 | |||
Party | Candidate | Votes | % | ±% | |
---|---|---|---|---|---|
Labor | Don Simmons | 10,325 | 67.4 | +6.7 | |
Liberal | Mark Tregoning | 4,989 | 32.6 | +11.4 | |
Total formal votes | 15,314 | 96.2 | |||
Informal votes | 607 | 3.8 | |||
Turnout | 15,921 | 92.9 | |||
Labor hold | Swing | +4.0 | |||
Party | Candidate | Votes | % | ±% | |
---|---|---|---|---|---|
Labor | Terry McRae | 10,011 | 60.6 | +1.9 | |
Liberal | John McGowan | 4,052 | 24.5 | +8.5 | |
Democrats | John Longhurst | 2,271 | 13.7 | +13.7 | |
Communist | Donald Sutherland | 195 | 1.2 | +1.2 | |
Total formal votes | 16,529 | 97.1 | |||
Informal votes | 492 | 2.9 | |||
Turnout | 17,021 | 93.9 | |||
Two-party-preferred result | |||||
Labor | Terry McRae | 11,080 | 65.1 | +1.8 | |
Liberal | John McGowan | 5,449 | 34.9 | −1.8 | |
Labor hold | Swing | +1.8 | |||
Party | Candidate | Votes | % | ±% | |
---|---|---|---|---|---|
Labor | George Whitten | 10,304 | 69.4 | +8.8 | |
Liberal | Jean Lawrie | 4,545 | 30.6 | +8.0 | |
Total formal votes | 14,849 | 95.6 | |||
Informal votes | 676 | 4.4 | |||
Turnout | 15,525 | 93.2 | |||
Labor hold | Swing | +6.3 | |||
}
Party | Candidate | Votes | % | ±% | |
---|---|---|---|---|---|
Liberal | Howard Venning | 6,344 | 40.2 | +2.1 | |
Labor | Ted Connelly | 6,121 | 38.8 | +11.0 | |
National | Peter Longmire | 1,908 | 12.0 | −8.7 | |
Independent | Nevin Newbold | 1,417 | 9.0 | +9.0 | |
Total formal votes | 15,790 | 98.6 | |||
Informal votes | 219 | 1.4 | |||
Turnout | 18,009 | 95.4 | |||
Two-party-preferred result | |||||
Liberal | Howard Venning | 9,193 | 58.2 | −7.1 | |
Labor | Ted Connelly | 6,597 | 41.8 | +7.1 | |
Liberal hold | Swing | -7.1 | |||
Party | Candidate | Votes | % | ±% | |
---|---|---|---|---|---|
Labor | John Bannon | 10,773 | 72.2 | +7.2 | |
Liberal | Paul Baloglou | 4,156 | 27.8 | +9.2 | |
Total formal votes | 14,929 | 96.2 | |||
Informal votes | 594 | 3.8 | |||
Turnout | 15,523 | 94.2 | |||
Labor hold | Swing | +4.7 | |||
Party | Candidate | Votes | % | ±% | |
---|---|---|---|---|---|
Labor | Reg Groth | 12,150 | 69.5 | +7.1 | |
Liberal | Ann Allen | 5,333 | 30.5 | +10.4 | |
Total formal votes | 17,483 | 95.0 | |||
Informal votes | 919 | 5.0 | |||
Turnout | 18,402 | 93.2 | |||
Labor hold | Swing | +4.5 | |||
Party | Candidate | Votes | % | ±% | |
---|---|---|---|---|---|
Labor | Jack Olson | 11,601 | 70.8 | +0.3 | |
Liberal | Terence Hanson | 4,447 | 27.1 | +11.1 | |
Socialist | J Mitchell | 343 | 2.1 | +2.1 | |
Total formal votes | 16,391 | 97.1 | |||
Informal votes | 481 | 2.9 | |||
Turnout | 16,872 | 93.2 | |||
Two-party-preferred result | |||||
Labor | Jack Olson | 11,833 | 72.2 | −0.3 | |
Liberal | Terence Hanson | 4,558 | 27.8 | +0.3 | |
Labor hold | Swing | -0.3 | |||
Party | Candidate | Votes | % | ±% | |
---|---|---|---|---|---|
Labor | Roy Abbott | 11,307 | 77.3 | +6.3 | |
Liberal | George Basivovs | 3,316 | 22.7 | +6.4 | |
Total formal votes | 14,623 | 95.7 | |||
Informal votes | 658 | 4.3 | |||
Turnout | 15,281 | 93.1 | |||
Labor hold | Swing | +4.4 | |||
Party | Candidate | Votes | % | ±% | |
---|---|---|---|---|---|
Labor | Gavin Keneally | 11,295 | 73.9 | +27.0 | |
Liberal | Colin Struck | 3,985 | 26.1 | +14.3 | |
Total formal votes | 15,280 | 96.6 | |||
Informal votes | 530 | 3.4 | |||
Turnout | 15,810 | 94.0 | |||
Labor hold | Swing | N/A | |||
Party | Candidate | Votes | % | ±% | |
---|---|---|---|---|---|
Labor | Molly Byrne | 9,273 | 56.5 | +1.9 | |
Liberal | Robert Ritson | 7,136 | 43.5 | +21.2 | |
Total formal votes | 16,409 | 97.6 | |||
Informal votes | 407 | 2.4 | |||
Turnout | 16,816 | 95.0 | |||
Labor hold | Swing | -1.9 | |||
Party | Candidate | Votes | % | ±% | |
---|---|---|---|---|---|
Liberal | Michael Wilson | 7,819 | 50.5 | +10.7 | |
Labor | Ralph Clarke | 7,138 | 46.2 | +5.8 | |
Workers | Leslie Huxley | 514 | 3.3 | +3.3 | |
Total formal votes | 15,471 | 97.7 | |||
Informal votes | 362 | 2.3 | |||
Turnout | 15,833 | 90.3 | |||
Two-party-preferred result | |||||
Liberal | Michael Wilson | 8,119 | 52.5 | −4.1 | |
Labor | Ralph Clarke | 7,347 | 47.5 | +4.1 | |
Liberal hold | Swing | -4.1 | |||
Party | Candidate | Votes | % | ±% | |
---|---|---|---|---|---|
Labor | Gil Langley | 8,848 | 58.9 | +6.8 | |
Liberal | Craig Spiel | 5,707 | 38.0 | −6.8 | |
Independent | Victoria Wawryk | 466 | 3.1 | +3.1 | |
Total formal votes | 15,021 | 97.5 | |||
Informal votes | 389 | 2.5 | |||
Turnout | 15,410 | 90.2 | |||
Two-party-preferred result | |||||
Labor | Gil Langley | 9,022 | 60.1 | +4.6 | |
Liberal | Craig Spiel | 5,999 | 39.9 | −4.6 | |
Labor hold | Swing | +4.6 | |||
Party | Candidate | Votes | % | ±% | |
---|---|---|---|---|---|
Liberal | Allan Rodda | 9,285 | 65.3 | +12.9 | |
Labor | Graeme Richardson | 4,923 | 34.7 | +8.4 | |
Total formal votes | 14,208 | 97.9 | |||
Informal votes | 306 | 2.1 | |||
Turnout | 14,514 | 93.8 | |||
Liberal hold | Swing | -5.1 | |||
Party | Candidate | Votes | % | ±% | |
---|---|---|---|---|---|
Labor | Max Brown | 11,203 | 73.2 | +5.0 | |
Liberal | Vivienne Cruickshank | 4,102 | 26.8 | +8.9 | |
Total formal votes | 15,305 | 96.1 | |||
Informal votes | 615 | 3.9 | |||
Turnout | 15,920 | 93.7 | |||
Labor hold | Swing | +2.9 | |||
The Australia Party was a minor political party established initially in 1966 as the Liberal Reform Group. As the Australia Party, it became influential, particularly in the landmark 1972 federal election when its preferences assisted the Australian Labor Party to victory—ending 23 years of Liberal/Country Coalition government.
The Legislative Council, or upper house, is one of the two chambers of the Parliament of South Australia. Its central purpose is to act as a house of review for legislation passed through the lower house, the House of Assembly. It sits in Parliament House in the state capital, Adelaide.
The House of Assembly, or lower house; Is one of the two chambers of the Parliament of South Australia. The other is the Legislative Council. It sits in Parliament House in the state capital, Adelaide.
The Parliament of South Australia is the bicameral legislature of the Australian state of South Australia. It consists of the 47-seat House of Assembly and the 22-seat Legislative Council. General elections are held every 4 years, with all of the lower house and half of the upper house filled at each election. It follows a Westminster system of parliamentary government with the executive branch required to both sit in parliament and hold the confidence of the House of Assembly. The parliament is based at Parliament House on North Terrace in the state capital of Adelaide.
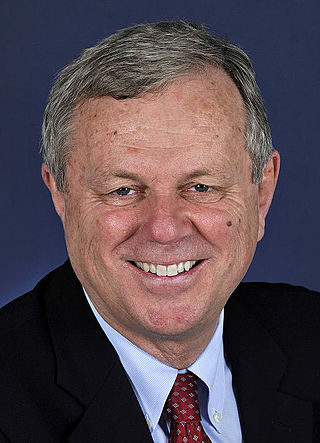
The state election for the 51st Parliament of South Australia was held in the Australian state of South Australia on 18 March 2006 to elect all members of the South Australian House of Assembly and 11 members of the South Australian Legislative Council. The election was conducted by the independent State Electoral Office.
State elections were held in South Australia on 9 February 2002. All 47 seats in the South Australian House of Assembly were up for election, along with half of the 22 seats in the South Australian Legislative Council. The incumbent Liberal Party of Australia led by Premier of South Australia Rob Kerin was defeated by the Australian Labor Party led by Leader of the Opposition Mike Rann. The Labor Party won 23 out of 47 seats, and then secured the one more seat it needed for a majority by gaining the support of independent Peter Lewis.
State elections were held in South Australia on 15 September 1979. All 47 seats in the South Australian House of Assembly were up for election. The incumbent Australian Labor Party led by Premier of South Australia Des Corcoran was defeated by the Liberal Party of Australia led by Leader of the Opposition David Tonkin.
State elections were held in South Australia on 17 September 1977. All 47 seats in the South Australian House of Assembly were up for election. The incumbent Australian Labor Party led by Premier of South Australia Don Dunstan won a fourth term in government, defeating the Liberal Party of Australia led by Leader of the Opposition David Tonkin.
State elections were held in South Australia on 12 July 1975. All 47 seats in the South Australian House of Assembly were up for election. The incumbent Australian Labor Party led by Premier of South Australia Don Dunstan won a third term in government, defeating the Liberal Party of Australia led by Leader of the Opposition Bruce Eastick.
State elections were held in South Australia on 10 March 1973. All 47 seats in the South Australian House of Assembly were up for election. The incumbent Australian Labor Party led by Premier of South Australia Don Dunstan won a second term in government, defeating the Liberal and Country League led by Leader of the Opposition Bruce Eastick.
State elections were held in South Australia on 4 March 1950. All 39 seats in the South Australian House of Assembly were up for election. The incumbent Liberal and Country League led by Premier of South Australia Thomas Playford IV defeated the Australian Labor Party led by Leader of the Opposition Mick O'Halloran.
State elections were held in South Australia on 8 March 1947. All 39 seats in the South Australian House of Assembly were up for election. The incumbent Liberal and Country League government led by Premier of South Australia Thomas Playford IV defeated the opposition Australian Labor Party led by Leader of the Opposition Robert Richards.
The 2014 South Australian state election elected members to the 53rd Parliament of South Australia on 15 March 2014, to fill all 47 seats in the House of Assembly and 11 of 22 seats in the Legislative Council. The 12-year-incumbent Australian Labor Party (SA) government, led by Premier Jay Weatherill, won its fourth consecutive four-year term in government, a record 16 years of Labor government, defeating the opposition Liberal Party of Australia (SA), led by Opposition Leader Steven Marshall.
The 2018 South Australian state election to elect members to the 54th Parliament of South Australia was held on 17 March 2018. All 47 seats in the House of Assembly or lower house, whose members were elected at the 2014 election, and 11 of 22 seats in the Legislative Council or upper house, last filled at the 2010 election, were contested. The record-16-year-incumbent Australian Labor Party (SA) government led by Premier Jay Weatherill was seeking a fifth four-year term, but was defeated by the opposition Liberal Party of Australia (SA), led by Opposition Leader Steven Marshall. Nick Xenophon's new SA Best party unsuccessfully sought to obtain the balance of power.
This is a list of House of Assembly results for the 1975 South Australian state election.
The South Australian Liberal Party, officially known as the Liberal Party of Australia (South Australian Division), and often shortened to SA Liberals, is the South Australian Division of the Liberal Party of Australia. It was formed as the Liberal and Country League (LCL) in 1932 and became the South Australian Division of the Liberal Party when the Liberal Party was formed in 1945. It retained its Liberal and Country League name before changing to its current name in 1974. It is one of two major parties in the bicameral Parliament of South Australia, the other being the Australian Labor Party (SA Branch). The party has been led by Leader of the Opposition David Speirs since the 2022 state election after a one-term government.
SA-Best, formerly known as Nick Xenophon's SA-BEST, is a political party in South Australia. It was founded in 2017 by Nick Xenophon as a state-based partner to his Nick Xenophon Team party. After an unsuccessful 2022 South Australian state election, the party has one representative in the South Australian Legislative Council, Connie Bonaros, whose term expires in 2026.
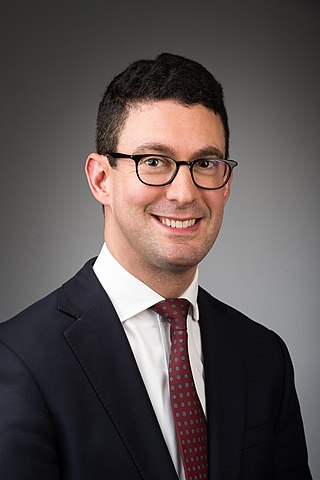
Daniel Cregan is an Australian lawyer and Independent politician who has served as Speaker of the South Australian House of Assembly and as a Cabinet Minister. He has represented Kavel in the House of Assembly since the 2018 South Australian state election.
The 2022 South Australian state election was held on 19 March 2022 to elect members to the 55th Parliament of South Australia. All 47 seats in the House of Assembly, and half the seats in the Legislative Council were up for re-election.