South Australian state election, 6 November 1982 [1] Contents
| ||||||
---|---|---|---|---|---|---|
Enrolled voters | 871,235 | |||||
Votes cast | 811,783 | Turnout | 93.18 | +0.14 | ||
Informal votes | 46,921 | Informal | 5.78 | +1.35 | ||
Summary of votes by party | ||||||
Party | Primary votes | % | Swing | Seats | Change | |
Labor | 353,999 | 46.28 | +5.43 | 24 | + 5 | |
Liberal | 326,372 | 42.67 | –5.27 | 21 | – 4 | |
Democrats | 54,457 | 7.12 | –1.18 | 0 | –1 | |
National | 17,782 | 2.32 | +0.42 | 1 | ± 0 | |
Independent | 12,252 | 1.60 | +0.60 | 1 | ± 0 | |
Total | 764,862 | 47 | ||||
Two-party-preferred | ||||||
Labor | 389,625 | 50.94 | +5.94 | |||
Liberal | 375,237 | 49.06 | –5.94 |
This is a list of House of Assembly results for the 1982 South Australian state election.
Party | Candidate | Votes | % | ±% | |
---|---|---|---|---|---|
Labor | Jack Wright | 7,888 | 60.6 | +6.1 | |
Liberal | Terry McClean | 3,822 | 29.4 | −3.6 | |
Democrats | Catherine Hannaford | 1,295 | 10.0 | −1.3 | |
Total formal votes | 13,005 | 90.6 | −2.8 | ||
Informal votes | 1,356 | 9.4 | +2.8 | ||
Turnout | 14,361 | 88.9 | −0.8 | ||
Two-party-preferred result | |||||
Labor | Jack Wright | 8,536 | 65.6 | +4.9 | |
Liberal | Terry McClean | 4,469 | 34.4 | −4.9 | |
Labor hold | Swing | +4.9 | |||
Party | Candidate | Votes | % | ±% | |
---|---|---|---|---|---|
Labor | Kevin Hamilton | 11,012 | 62.7 | +13.1 | |
Liberal | Graham Ingerson | 5,661 | 32.2 | −8.6 | |
Democrats | Ben Michael | 894 | 5.1 | −4.5 | |
Total formal votes | 17,567 | 93.7 | −0.5 | ||
Informal votes | 1,184 | 6.3 | +0.5 | ||
Turnout | 18,751 | 94.1 | −0.1 | ||
Two-party-preferred result | |||||
Labor | Kevin Hamilton | 11,459 | 61.1 | +7.2 | |
Liberal | Graham Ingerson | 6,108 | 38.9 | −7.2 | |
Labor hold | Swing | +7.2 | |||
Party | Candidate | Votes | % | ±% | |
---|---|---|---|---|---|
Liberal | Ted Chapman | 10,519 | 57.8 | −11.9 | |
Labor | Helen McSkimming | 4,235 | 23.3 | +1.6 | |
Democrats | Andrew Mills | 2,158 | 11.9 | +3.3 | |
National | Rex Tilbrook | 1,279 | 7.0 | +7.0 | |
Total formal votes | 18,191 | 95.3 | −1.5 | ||
Informal votes | 906 | 4.7 | +1.5 | ||
Turnout | 19,097 | 94.6 | +1.2 | ||
Two-party-preferred result | |||||
Liberal | Ted Chapman | 12,557 | 69.0 | −5.0 | |
Labor | Helen McSkimming | 5,634 | 31.0 | +5.0 | |
Liberal hold | Swing | -5.0 | |||
Party | Candidate | Votes | % | ±% | |
---|---|---|---|---|---|
Labor | John Trainer | 8,409 | 56.2 | +8.2 | |
Liberal | Chris Gellie | 5,613 | 37.5 | −4.0 | |
Democrats | Michael Rogers | 938 | 6.3 | −4.2 | |
Total formal votes | 14,960 | 94.7 | −1.0 | ||
Informal votes | 835 | 5.3 | +1.0 | ||
Turnout | 15,795 | 94.3 | +0.7 | ||
Two-party-preferred result | |||||
Labor | John Trainer | 8,878 | 59.3 | +7.6 | |
Liberal | Chris Gellie | 6,082 | 40.7 | −7.6 | |
Labor hold | Swing | +7.6 | |||
Party | Candidate | Votes | % | ±% | |
---|---|---|---|---|---|
Labor | Don Hopgood | 12,802 | 61.8 | +13.6 | |
Liberal | Deane Clough | 6,068 | 29.3 | −8.9 | |
Democrats | Ivor Childs | 1,838 | 8.9 | −4.7 | |
Total formal votes | 20,708 | 93.5 | −1.5 | ||
Informal votes | 1,441 | 6.5 | +1.5 | ||
Turnout | 22,149 | 93.4 | +1.0 | ||
Two-party-preferred result | |||||
Labor | Don Hopgood | 13,721 | 66.2 | +10.5 | |
Liberal | Deane Clough | 6,987 | 33.8 | −10.5 | |
Labor hold | Swing | +10.5 | |||
Party | Candidate | Votes | % | ±% | |
---|---|---|---|---|---|
Liberal | David Tonkin | 9,177 | 63.0 | −3.0 | |
Labor | Neill Lean | 3,910 | 26.9 | +3.9 | |
Democrats | Guy Harley | 1,475 | 10.1 | −0.9 | |
Total formal votes | 14,562 | 95.9 | −0.5 | ||
Informal votes | 614 | 4.1 | +0.5 | ||
Turnout | 15,176 | 93.3 | +1.3 | ||
Two-party-preferred result | |||||
Liberal | David Tonkin | 9,915 | 68.1 | −3.4 | |
Labor | Neill Lean | 4,647 | 31.9 | +3.4 | |
Liberal hold | Swing | -3.4 | |||
Party | Candidate | Votes | % | ±% | |
---|---|---|---|---|---|
Labor | June Appleby | 8,486 | 47.3 | +6.3 | |
Liberal | Dick Glazbrook | 8,192 | 45.6 | −3.1 | |
Democrats | Bob Ralph | 1,272 | 7.1 | −3.2 | |
Total formal votes | 17,950 | 95.8 | −0.8 | ||
Informal votes | 792 | 4.2 | +0.8 | ||
Turnout | 18,742 | 94.3 | +0.8 | ||
Two-party-preferred result | |||||
Labor | June Appleby | 9,123 | 50.8 | +5.5 | |
Liberal | Dick Glazbrook | 8,827 | 49.2 | −5.5 | |
Labor gain from Liberal | Swing | +5.5 | |||
Party | Candidate | Votes | % | ±% | |
---|---|---|---|---|---|
Liberal | Peter Arnold | 10,219 | 61.5 | +0.4 | |
Labor | Roland Telfer | 5,109 | 30.7 | −2.8 | |
Democrats | Mike Elliott | 1,291 | 7.8 | +2.4 | |
Total formal votes | 16,619 | 94.5 | −1.1 | ||
Informal votes | 975 | 5.5 | +1.1 | ||
Turnout | 17,594 | 92.0 | −2.3 | ||
Two-party-preferred result | |||||
Liberal | Peter Arnold | 10,865 | 65.4 | +1.6 | |
Labor | Roland Telfer | 5,754 | 34.6 | −1.6 | |
Liberal hold | Swing | +1.6 | |||
Party | Candidate | Votes | % | ±% | |
---|---|---|---|---|---|
Liberal | Jennifer Adamson | 8,470 | 48.3 | −12.8 | |
Labor | Rosalie McDonald | 7,756 | 44.3 | +10.8 | |
Democrats | Stephen Swift | 1,294 | 7.4 | +2.0 | |
Total formal votes | 17,520 | 93.2 | −2.7 | ||
Informal votes | 1,277 | 6.8 | +2.7 | ||
Turnout | 18,797 | 94.8 | +1.7 | ||
Two-party-preferred result | |||||
Liberal | Jennifer Adamson | 8,980 | 51.3 | −10.7 | |
Labor | Rosalie McDonald | 8,540 | 48.7 | +10.7 | |
Liberal hold | Swing | -10.7 | |||
Party | Candidate | Votes | % | ±% | |
---|---|---|---|---|---|
Liberal | Dean Brown | 12,133 | 71.2 | −3.8 | |
Labor | Emanuel Frossinakis | 3,102 | 18.2 | +2.6 | |
Democrats | Merilyn de Guerin Pedrick | 1,796 | 10.6 | +1.2 | |
Total formal votes | 17,031 | 96.7 | −1.3 | ||
Informal votes | 584 | 3.3 | +1.3 | ||
Turnout | 17,615 | 92.5 | −0.1 | ||
Two-party-preferred result | |||||
Liberal | Dean Brown | 13,031 | 76.5 | −3.2 | |
Labor | Emanuel Frossinakis | 4,000 | 23.5 | +3.2 | |
Liberal hold | Swing | -3.2 | |||
Party | Candidate | Votes | % | ±% | |
---|---|---|---|---|---|
Labor | Peter Duncan | 8,809 | 64.3 | +9.6 | |
Liberal | Esmond McKeown | 4,129 | 24.4 | −8.4 | |
Democrats | Barbara Barlow | 1,927 | 11.4 | −1.1 | |
Total formal votes | 16,952 | 91.6 | −2.5 | ||
Informal votes | 1,558 | 8.4 | +2.5 | ||
Turnout | 18,510 | 91.9 | −0.3 | ||
Two-party-preferred result | |||||
Labor | Peter Duncan | 11,860 | 70.0 | +9.1 | |
Liberal | Esmond McKeown | 5,092 | 30.0 | −9.1 | |
Labor hold | Swing | +9.1 | |||
Party | Candidate | Votes | % | ±% | |
---|---|---|---|---|---|
Liberal | Graham Gunn | 7,977 | 62.1 | +2.2 | |
Labor | Christina Phillis | 4,862 | 37.9 | −2.2 | |
Total formal votes | 12,839 | 92.7 | −3.4 | ||
Informal votes | 1,010 | 7.3 | +3.4 | ||
Turnout | 13,849 | 89.1 | 0.0 | ||
Liberal hold | Swing | +2.2 | |||
Party | Candidate | Votes | % | ±% | |
---|---|---|---|---|---|
Liberal | Stan Evans | 11,436 | 52.5 | −10.0 | |
Labor | Annice Vass | 7,156 | 32.9 | +7.8 | |
Democrats | John Coulter | 3,188 | 14.6 | +2.2 | |
Total formal votes | 21,780 | 96.4 | −1.2 | ||
Informal votes | 812 | 3.6 | +1.2 | ||
Turnout | 22,592 | 93.9 | −3.7 | ||
Two-party-preferred result | |||||
Liberal | Stan Evans | 13,030 | 59.8 | −8.9 | |
Labor | Annice Vass | 8,750 | 40.2 | +8.9 | |
Liberal hold | Swing | -8.9 | |||
Party | Candidate | Votes | % | ±% | |
---|---|---|---|---|---|
National | Peter Blacker | 8,106 | 53.6 | −0.3 | |
Liberal | Rex Mader | 3,679 | 24.3 | −2.7 | |
Labor | Terrence Krieg | 2,968 | 19.6 | +0.5 | |
Democrats | Helen Breakey | 363 | 2.4 | +2.4 | |
Total formal votes | 15,116 | 96.7 | −0.6 | ||
Informal votes | 509 | 3.3 | +0.6 | ||
Turnout | 15,625 | 94.2 | +0.4 | ||
Two-party-preferred result | |||||
National | Peter Blacker | 11,137 | 73.7 | −0.4 | |
Labor | Terrence Krieg | 3,979 | 26.3 | +0.4 | |
National hold | Swing | -0.4 | |||
Party | Candidate | Votes | % | ±% | |
---|---|---|---|---|---|
Labor | Bob Gregory | 9,213 | 57.9 | +8.8 | |
Liberal | Philip Bayly | 5,004 | 31.4 | −7.4 | |
Democrats | Andrew Sickerdick | 1,698 | 10.7 | −1.4 | |
Total formal votes | 15,915 | 93.7 | −0.7 | ||
Informal votes | 1,070 | 6.3 | +0.7 | ||
Turnout | 16,985 | 93.7 | +0.5 | ||
Two-party-preferred result | |||||
Labor | Bob Gregory | 10,062 | 63.2 | +9.5 | |
Liberal | Philip Bayly | 5,853 | 36.8 | −9.5 | |
Labor hold | Swing | +9.5 | |||
Party | Candidate | Votes | % | ±% | |
---|---|---|---|---|---|
Labor | Jack Slater | 8,120 | 55.3 | +7.0 | |
Liberal | Gregory Minuzzo | 4,970 | 33.8 | −4.9 | |
Democrats | Eileen Farmer | 1,597 | 10.9 | −2.1 | |
Total formal votes | 14,687 | 92.6 | −2.1 | ||
Informal votes | 1,165 | 7.4 | +2.1 | ||
Turnout | 15,852 | 93.7 | +0.1 | ||
Two-party-preferred result | |||||
Labor | Jack Slater | 8,919 | 60.7 | +5.3 | |
Liberal | Gregory Minuzzo | 5,768 | 39.3 | −5.3 | |
Labor hold | Swing | +5.3 | |||
Party | Candidate | Votes | % | ±% | |
---|---|---|---|---|---|
Liberal | John Mathwin | 9,110 | 59.9 | −2.8 | |
Labor | Robert Dancer | 5,387 | 35.4 | +6.7 | |
Democrats | Ronald Moulds | 720 | 4.7 | −3.9 | |
Total formal votes | 15,217 | 95.9 | −0.9 | ||
Informal votes | 646 | 4.1 | +0.9 | ||
Turnout | 15,863 | 93.1 | +1.1 | ||
Two-party-preferred result | |||||
Liberal | John Mathwin | 9,490 | 62.4 | −4.8 | |
Labor | Robert Dancer | 5,727 | 37.6 | +4.8 | |
Liberal hold | Swing | -4.8 | |||
Party | Candidate | Votes | % | ±% | |
---|---|---|---|---|---|
Liberal | John Meier | 9,468 | 60.6 | −16.5 | |
Labor | Stephan Oulianoff | 3,437 | 22.0 | −0.9 | |
National | Terence Halford | 1,832 | 11.7 | +11.7 | |
Democrats | Kevin Jones | 881 | 5.6 | +5.6 | |
Total formal votes | 15,618 | 95.5 | −0.6 | ||
Informal votes | 740 | 4.5 | +0.6 | ||
Turnout | 16,358 | 93.9 | −0.2 | ||
Two-party-preferred result | |||||
Liberal | John Meier | 11,725 | 75.1 | −2.0 | |
Labor | Stephan Oulianoff | 3,893 | 24.9 | +2.0 | |
Liberal hold | Swing | -2.0 | |||
Party | Candidate | Votes | % | ±% | |
---|---|---|---|---|---|
Liberal | Heini Becker | 8,720 | 55.1 | −5.7 | |
Labor | Derek Robertson | 6,165 | 39.0 | +5.7 | |
Democrats | Clifford Boyd | 936 | 5.9 | 0.0 | |
Total formal votes | 15,821 | 95.2 | −1.2 | ||
Informal votes | 804 | 4.8 | +1.2 | ||
Turnout | 16,625 | 92.7 | −0.2 | ||
Two-party-preferred result | |||||
Liberal | Heini Becker | 9,212 | 58.2 | −6.3 | |
Labor | Derek Robertson | 6,609 | 41.8 | +6.3 | |
Liberal hold | Swing | -6.3 | |||
Party | Candidate | Votes | % | ±% | |
---|---|---|---|---|---|
Labor | Terry Groom | 8,734 | 52.0 | +1.3 | |
Liberal | Barry James | 6,070 | 36.2 | −4.8 | |
Democrats | George Belperio | 1,983 | 11.8 | +3.5 | |
Total formal votes | 16,787 | 92.3 | −1.9 | ||
Informal votes | 1,408 | 7.7 | +1.9 | ||
Turnout | 18,195 | 92.6 | −0.8 | ||
Two-party-preferred result | |||||
Labor | Terry Groom | 10,076 | 60.0 | +4.9 | |
Liberal | Barry James | 6,711 | 40.0 | −4.9 | |
Labor hold | Swing | +4.9 | |||
Party | Candidate | Votes | % | ±% | |
---|---|---|---|---|---|
Labor | Don Ferguson | 8,782 | 51.4 | +7.5 | |
Liberal | Bob Randall | 7,409 | 43.4 | −1.1 | |
Democrats | Trevor Turner | 882 | 5.2 | −6.4 | |
Total formal votes | 17,073 | 94.2 | −0.8 | ||
Informal votes | 1,049 | 5.8 | +0.8 | ||
Turnout | 18,122 | 94.3 | +1.3 | ||
Two-party-preferred result | |||||
Labor | Don Ferguson | 9,216 | 54.0 | +5.0 | |
Liberal | Bob Randall | 7,857 | 46.0 | −5.0 | |
Labor gain from Liberal | Swing | +5.0 | |||
Party | Candidate | Votes | % | ±% | |
---|---|---|---|---|---|
Liberal | Roger Goldsworthy | 10,878 | 63.4 | −5.4 | |
Labor | Geoffrey Anderson | 5,019 | 29.2 | +7.0 | |
Democrats | Brian Fain | 1,261 | 7.4 | −1.6 | |
Total formal votes | 17,158 | 95.2 | −2.0 | ||
Informal votes | 855 | 4.8 | +2.0 | ||
Turnout | 18,013 | 93.5 | −0.3 | ||
Two-party-preferred result | |||||
Liberal | Roger Goldsworthy | 11,452 | 66.7 | −7.6 | |
Labor | Geoffrey Anderson | 5,706 | 33.3 | +7.6 | |
Liberal hold | Swing | -7.6 | |||
Party | Candidate | Votes | % | ±% | |
---|---|---|---|---|---|
Liberal | Bruce Eastick | 9,553 | 62.3 | −1.3 | |
Labor | William Young | 4,933 | 32.2 | +2.5 | |
Democrats | Nicholas Wedge | 845 | 5.5 | −1.2 | |
Total formal votes | 15,331 | 95.3 | −1.3 | ||
Informal votes | 751 | 4.7 | +1.3 | ||
Turnout | 16,082 | 94.9 | +0.6 | ||
Two-party-preferred result | |||||
Liberal | Bruce Eastick | 10,000 | 65.2 | −2.0 | |
Labor | William Young | 5,331 | 34.8 | +2.0 | |
Liberal hold | Swing | -2.0 | |||
Party | Candidate | Votes | % | ±% | |
---|---|---|---|---|---|
Liberal | Peter Lewis | 8,374 | 57.5 | +11.6 | |
National | Guy Wheal | 3,260 | 22.4 | −2.6 | |
Labor | Norman Napper | 2,661 | 18.3 | +0.4 | |
Democrats | Samuel Pope | 256 | 1.8 | +1.8 | |
Total formal votes | 14,551 | 96.9 | −0.3 | ||
Informal votes | 468 | 3.1 | +0.3 | ||
Turnout | 15,019 | 94.7 | +1.1 | ||
Two-party-preferred result | |||||
Liberal | Peter Lewis | 11,641 | 80.0 | +2.6 | |
Labor | Norman Napper | 2,910 | 20.0 | −2.6 | |
Liberal hold | Swing | +2.6 | |||
Party | Candidate | Votes | % | ±% | |
---|---|---|---|---|---|
Labor | Susan Lenehan | 11,968 | 53.1 | +11.8 | |
Liberal | Ivar Schmidt | 9,067 | 40.3 | −6.8 | |
Democrats | Jay McMerrick | 1,488 | 6.6 | −5.0 | |
Total formal votes | 22,523 | 95.3 | −1.0 | ||
Informal votes | 1,113 | 4.7 | +1.0 | ||
Turnout | 23,636 | 94.6 | −0.1 | ||
Two-party-preferred result | |||||
Labor | Susan Lenehan | 12,737 | 56.6 | +9.6 | |
Liberal | Ivar Schmidt | 9,786 | 43.4 | −9.6 | |
Labor gain from Liberal | Swing | +9.6 | |||
Party | Candidate | Votes | % | ±% | |
---|---|---|---|---|---|
Liberal | Stephen Baker | 7,759 | 50.8 | +13.5 | |
Democrats | Heather Southcott | 4,574 | 30.0 | −15.1 | |
Labor | John Hill | 2,933 | 19.2 | +1.9 | |
Total formal votes | 15,266 | 96.9 | −1.2 | ||
Informal votes | 493 | 3.1 | +1.2 | ||
Turnout | 15,759 | 93.0 | −0.5 | ||
Two-candidate-preferred result | |||||
Liberal | Stephen Baker | 9,226 | 60.4 | +15.1 | |
Democrats | Heather Southcott | 6,040 | 39.6 | −15.1 | |
Liberal gain from Democrats | Swing | +15.1 | |||
Party | Candidate | Votes | % | ±% | |
---|---|---|---|---|---|
Labor | Ron Payne | 8,971 | 57.6 | +7.8 | |
Liberal | David Phelps | 5,574 | 35.8 | −3.2 | |
Democrats | Kevin Whitby | 1,026 | 6.6 | −4.6 | |
Total formal votes | 15,571 | 94.7 | −1.5 | ||
Informal votes | 877 | 5.3 | +1.5 | ||
Turnout | 16,448 | 92.9 | −0.4 | ||
Two-party-preferred result | |||||
Labor | Ron Payne | 9,448 | 60.7 | +6.4 | |
Liberal | David Phelps | 6,123 | 39.3 | −6.4 | |
Labor hold | Swing | +6.4 | |||
Party | Candidate | Votes | % | ±% | |
---|---|---|---|---|---|
Liberal | John Oswald | 7,346 | 49.1 | −2.7 | |
Labor | Stephen Blight | 6,888 | 46.1 | +3.8 | |
Democrats | Graham Pamount | 721 | 4.8 | −1.1 | |
Total formal votes | 14,955 | 95.1 | −1.6 | ||
Informal votes | 764 | 4.9 | +1.6 | ||
Turnout | 15,719 | 92.5 | −1.2 | ||
Two-party-preferred result | |||||
Liberal | John Oswald | 7,696 | 51.5 | −3.8 | |
Labor | Stephen Blight | 7,259 | 48.5 | +3.8 | |
Liberal hold | Swing | -3.8 | |||
Party | Candidate | Votes | % | ±% | |
---|---|---|---|---|---|
Liberal | Harold Allison | 8,444 | 50.0 | −5.6 | |
Labor | Kenneth Bonython | 7,670 | 45.4 | +1.0 | |
Democrats | Meg Lees | 767 | 4.5 | +4.5 | |
Total formal votes | 16,881 | 96.3 | −1.0 | ||
Informal votes | 652 | 3.7 | +1.0 | ||
Turnout | 17,533 | 94.2 | +0.4 | ||
Two-party-preferred result | |||||
Liberal | Harold Allison | 8,816 | 52.2 | −3.4 | |
Labor | Kenneth Bonython | 8,065 | 47.8 | +3.4 | |
Liberal hold | Swing | -3.4 | |||
Party | Candidate | Votes | % | ±% | |
---|---|---|---|---|---|
Liberal | David Wotton | 9,959 | 58.5 | −4.3 | |
Labor | Geoffrey McCulloch | 6,326 | 37.1 | +5.4 | |
Democrats | Gerhard Weissmann | 743 | 4.4 | −1.1 | |
Total formal votes | 17,028 | 94.5 | −1.7 | ||
Informal votes | 988 | 5.5 | +1.7 | ||
Turnout | 18,016 | 94.3 | +0.8 | ||
Two-party-preferred result | |||||
Liberal | David Wotton | 10,327 | 60.6 | −5.3 | |
Labor | Geoffrey McCulloch | 6,701 | 39.4 | +5.3 | |
Liberal hold | Swing | -5.3 | |||
Party | Candidate | Votes | % | ±% | |
---|---|---|---|---|---|
Labor | Terry Hemmings | 9,862 | 63.4 | +10.8 | |
Liberal | Eric Bates | 3,775 | 24.3 | −6.7 | |
Democrats | John Ferguson | 1,920 | 12.3 | −4.0 | |
Total formal votes | 15,557 | 91.9 | −1.5 | ||
Informal votes | 1,365 | 8.1 | +1.5 | ||
Turnout | 16,922 | 90.3 | −0.7 | ||
Two-party-preferred result | |||||
Labor | Terry Hemmings | 10,768 | 69.2 | +9.7 | |
Liberal | Eric Bates | 4,789 | 30.8 | −9.7 | |
Labor hold | Swing | +9.7 | |||
Party | Candidate | Votes | % | ±% | |
---|---|---|---|---|---|
Labor | John Klunder | 11,120 | 50.2 | +11.9 | |
Liberal | Brian Billard | 9,555 | 43.1 | −7.2 | |
Democrats | Robert Mason | 1,121 | 5.0 | −6.4 | |
National | Glen Stevens | 372 | 1.7 | +1.7 | |
Total formal votes | 22,168 | 95.6 | 0.0 | ||
Informal votes | 1,011 | 4.4 | 0.0 | ||
Turnout | 23,179 | 94.4 | +0.6 | ||
Two-party-preferred result | |||||
Labor | John Klunder | 11,871 | 53.6 | +9.8 | |
Liberal | Brian Billard | 10,297 | 46.4 | −9.8 | |
Labor gain from Liberal | Swing | +9.8 | |||
Party | Candidate | Votes | % | ±% | |
---|---|---|---|---|---|
Labor | Greg Crafter | 8,510 | 56.1 | +9.1 | |
Liberal | Lynton Crosby | 5,756 | 38.0 | −8.9 | |
Democrats | Josephine Read | 898 | 5.9 | −0.2 | |
Total formal votes | 15,164 | 94.7 | −0.9 | ||
Informal votes | 844 | 5.3 | +0.9 | ||
Turnout | 16,008 | 90.3 | −2.0 | ||
Two-party-preferred result | |||||
Labor | Greg Crafter | 8,963 | 59.1 | +9.2 | |
Liberal | Lynton Crosby | 6,201 | 40.9 | −9.2 | |
Labor hold | Swing | +9.2 | |||
Party | Candidate | Votes | % | ±% | |
---|---|---|---|---|---|
Labor | Keith Plunkett | 8,837 | 60.9 | +3.1 | |
Liberal | Laurie Whitelaw | 3,928 | 27.1 | −15.1 | |
Democrats | Jim Mitchell | 1,744 | 12.0 | +12.0 | |
Total formal votes | 14,509 | 92.2 | −1.4 | ||
Informal votes | 1,223 | 7.8 | +1.4 | ||
Turnout | 15,732 | 92.9 | −0.3 | ||
Two-party-preferred result | |||||
Labor | Keith Plunkett | 10,077 | 69.5 | +11.7 | |
Liberal | Laurie Whitelaw | 4,432 | 30.5 | −11.7 | |
Labor hold | Swing | +11.7 | |||
Party | Candidate | Votes | % | ±% | |
---|---|---|---|---|---|
Labor | Terry McRae | 10,391 | 59.5 | +12.6 | |
Liberal | Bill Arnold | 5,510 | 31.5 | −4.8 | |
Democrats | Colin Nieass | 1,568 | 9.0 | −7.8 | |
Total formal votes | 17,469 | 92.3 | −1.4 | ||
Informal votes | 1,452 | 7.7 | +1.4 | ||
Turnout | 18,921 | 93.2 | −0.2 | ||
Two-party-preferred result | |||||
Labor | Terry McRae | 11,304 | 64.7 | +9.6 | |
Liberal | Bill Arnold | 6,165 | 35.3 | −9.6 | |
Labor hold | Swing | +9.6 | |||
Party | Candidate | Votes | % | ±% | |
---|---|---|---|---|---|
Labor | George Whitten | 8,753 | 66.1 | +9.7 | |
Liberal | Sue Crew | 4,488 | 33.9 | +1.3 | |
Total formal votes | 13,241 | 89.0 | −3.6 | ||
Informal votes | 1,634 | 11.0 | +3.6 | ||
Turnout | 14,875 | 94.1 | +1.7 | ||
Labor hold | Swing | +5.6 | |||
Party | Candidate | Votes | % | ±% | |
---|---|---|---|---|---|
Liberal | John Olsen | 8,943 | 56.4 | +7.3 | |
Labor | Denis Crisp | 6,043 | 38.1 | +4.1 | |
National | John Reilly | 522 | 3.3 | −13.6 | |
Democrats | Gordon Weber | 354 | 2.2 | +2.2 | |
Total formal votes | 15,862 | 96.2 | −0.5 | ||
Informal votes | 625 | 3.8 | +0.5 | ||
Turnout | 16,487 | 94.7 | +0.2 | ||
Two-party-preferred result | |||||
Liberal | John Olsen | 9,566 | 60.3 | −2.8 | |
Labor | Denis Crisp | 6,296 | 39.7 | +2.8 | |
Liberal hold | Swing | -2.8 | |||
Party | Candidate | Votes | % | ±% | |
---|---|---|---|---|---|
Labor | John Bannon | 10,200 | 75.7 | +11.1 | |
Liberal | Ruth Squire | 3,284 | 24.4 | −2.5 | |
Total formal votes | 13,484 | 90.4 | −3.1 | ||
Informal votes | 1,427 | 9.6 | +3.1 | ||
Turnout | 14,911 | 92.3 | −0.5 | ||
Labor hold | Swing | +7.2 | |||
Party | Candidate | Votes | % | ±% | |
---|---|---|---|---|---|
Labor | Lynn Arnold | 13,632 | 69.1 | +8.3 | |
Liberal | Derrick Rich | 4,759 | 24.1 | −15.1 | |
Democrats | David Vigor | 1,343 | 6.8 | +6.8 | |
Total formal votes | 19,734 | 91.3 | −1.7 | ||
Informal votes | 1,868 | 8.7 | +1.7 | ||
Turnout | 21,602 | 92.8 | −0.5 | ||
Two-party-preferred result | |||||
Labor | Lynn Arnold | 14,316 | 72.5 | +11.7 | |
Liberal | Derrick Rich | 5,418 | 27.5 | −11.7 | |
Labor hold | Swing | +11.7 | |||
Party | Candidate | Votes | % | ±% | |
---|---|---|---|---|---|
Independent | Norm Peterson | 7,915 | 46.8 | +15.1 | |
Labor | Peter Bicknell | 6,462 | 38.2 | +2.3 | |
Liberal | Macleay Lawrie | 2,244 | 13.3 | −14.7 | |
Democrats | Peter Gagliardi | 295 | 1.7 | −2.7 | |
Total formal votes | 16,916 | 94.9 | +0.5 | ||
Informal votes | 910 | 5.1 | −0.5 | ||
Turnout | 17,826 | 93.4 | −1.2 | ||
Two-candidate-preferred result | |||||
Independent | Norm Peterson | 10,207 | 60.3 | −1.9 | |
Labor | Peter Bicknell | 6,709 | 39.7 | +1.9 | |
Independent hold | Swing | -1.9 | |||
Party | Candidate | Votes | % | ±% | |
---|---|---|---|---|---|
Labor | Roy Abbott | 9,866 | 77.9 | +7.7 | |
Liberal | Elizabeth Bronisz | 2,803 | 22.1 | −7.7 | |
Total formal votes | 12,669 | 89.6 | −4.0 | ||
Informal votes | 1,469 | 10.4 | +4.0 | ||
Turnout | 14,138 | 92.8 | 0.0 | ||
Labor hold | Swing | +7.7 | |||
Party | Candidate | Votes | % | ±% | |
---|---|---|---|---|---|
Labor | Gavin Keneally | 10,403 | 66.6 | −0.4 | |
Liberal | Sydney Cheesman | 3,865 | 24.7 | −8.3 | |
Democrats | David Chapman | 1,364 | 8.7 | +8.7 | |
Total formal votes | 15,632 | 92.8 | −2.5 | ||
Informal votes | 1,212 | 7.2 | +2.5 | ||
Turnout | 16,844 | 93.9 | −0.3 | ||
Two-party-preferred result | |||||
Labor | Gavin Keneally | 10,942 | 70.0 | +3.1 | |
Liberal | Sydney Cheesman | 4,690 | 30.0 | −3.1 | |
Labor hold | Swing | +3.1 | |||
Party | Candidate | Votes | % | ±% | |
---|---|---|---|---|---|
Liberal | Scott Ashenden | 8,664 | 46.1 | −3.7 | |
Labor | John Lewis | 8,358 | 44.5 | +3.7 | |
Democrats | Sandra Kanck | 1,213 | 6.5 | −2.9 | |
National | Rex Senior | 538 | 2.9 | +2.9 | |
Total formal votes | 18,773 | 95.1 | −0.9 | ||
Informal votes | 959 | 4.9 | +0.9 | ||
Turnout | 19,732 | 94.9 | +0.9 | ||
Two-party-preferred result | |||||
Liberal | Scott Ashenden | 9,652 | 51.4 | −3.2 | |
Labor | John Lewis | 9,121 | 48.6 | +3.2 | |
Liberal hold | Swing | -3.2 | |||
Party | Candidate | Votes | % | ±% | |
---|---|---|---|---|---|
Liberal | Michael Wilson | 7,602 | 52.0 | −4.0 | |
Labor | Mike Duigan | 6,277 | 43.0 | +8.0 | |
Democrats | Joseph Zingarelli | 732 | 5.0 | −4.0 | |
Total formal votes | 14,611 | 95.6 | −0.8 | ||
Informal votes | 674 | 4.4 | +0.8 | ||
Turnout | 15,285 | 90.4 | +0.6 | ||
Two-party-preferred result | |||||
Liberal | Michael Wilson | 7,961 | 54.5 | −5.6 | |
Labor | Mike Duigan | 6,650 | 45.5 | +5.6 | |
Liberal hold | Swing | -5.6 | |||
Party | Candidate | Votes | % | ±% | |
---|---|---|---|---|---|
Labor | Kym Mayes | 7,704 | 53.2 | +6.1 | |
Liberal | Robert Nicholls | 5,670 | 39.1 | −4.3 | |
Democrats | Margaret-Ann Williams | 804 | 5.6 | −3.9 | |
National | Allan Osmond | 314 | 2.1 | +2.1 | |
Total formal votes | 14,492 | 94.9 | −0.3 | ||
Informal votes | 775 | 5.1 | +0.3 | ||
Turnout | 15,267 | 92.0 | +1.9 | ||
Two-party-preferred result | |||||
Labor | Kym Mayes | 8,209 | 56.6 | +4.3 | |
Liberal | Robert Nicholls | 6,283 | 43.4 | −4.3 | |
Labor hold | Swing | +4.3 | |||
Party | Candidate | Votes | % | ±% | |
---|---|---|---|---|---|
Liberal | Allan Rodda | 8,023 | 55.7 | −12.3 | |
Labor | Simon Bryant | 4,427 | 30.7 | −1.3 | |
National | Geoffrey Clothier | 1,559 | 10.8 | +10.8 | |
Democrats | Peter Butcher | 398 | 2.8 | +2.8 | |
Total formal votes | 14,407 | 95.5 | −0.4 | ||
Informal votes | 673 | 4.5 | +0.4 | ||
Turnout | 15,080 | 94.3 | +1.0 | ||
Two-party-preferred result | |||||
Liberal | Allan Rodda | 9,592 | 66.6 | −1.4 | |
Labor | Simon Bryant | 4,815 | 33.4 | +1.4 | |
Liberal hold | Swing | -1.4 | |||
Party | Candidate | Votes | % | ±% | |
---|---|---|---|---|---|
Labor | Max Brown | 7,356 | 49.1 | −14.6 | |
Independent | Peter Murphy | 4,337 | 28.9 | +28.9 | |
Liberal | Vivienne Cruickshank | 2,703 | 18.0 | −11.8 | |
Democrats | Mary Good | 596 | 4.0 | −1.0 | |
Total formal votes | 14,992 | 93.3 | −1.2 | ||
Informal votes | 1,079 | 6.7 | +1.2 | ||
Turnout | 16,071 | 90.5 | −1.3 | ||
Two-candidate-preferred result | |||||
Labor | Max Brown | 8,113 | 54.1 | −12.6 | |
Independent | Peter Murphy | 6,879 | 45.9 | +45.9 | |
Labor hold | Swing | -12.6 | |||
The Legislative Council, or upper house, is one of the two chambers of the Parliament of South Australia. Its central purpose is to act as a house of review for legislation passed through the lower house, the House of Assembly. It sits in Parliament House in the state capital, Adelaide.
The House of Assembly, or lower house; Is one of the two chambers of the Parliament of South Australia. The other is the Legislative Council. It sits in Parliament House in the state capital, Adelaide.
The Parliament of South Australia is the bicameral legislature of the Australian state of South Australia. It consists of the 47-seat House of Assembly and the 22-seat Legislative Council. General elections are held every 4 years, with all of the lower house and half of the upper house filled at each election. It follows a Westminster system of parliamentary government with the executive branch required to both sit in parliament and hold the confidence of the House of Assembly. The parliament is based at Parliament House on North Terrace in the state capital of Adelaide.
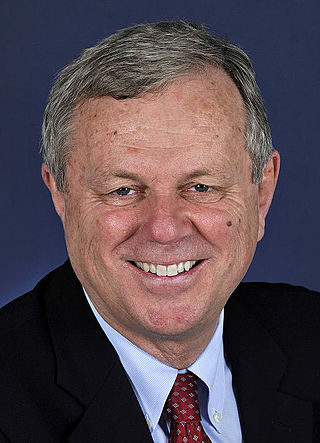
The state election for the 51st Parliament of South Australia was held in the Australian state of South Australia on 18 March 2006 to elect all members of the South Australian House of Assembly and 11 members of the South Australian Legislative Council. The election was conducted by the independent State Electoral Office.
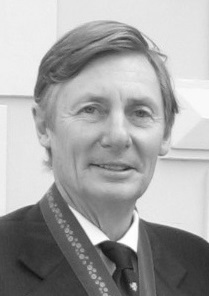
State elections were held in South Australia on 6 November 1982. All 47 seats in the South Australian House of Assembly were up for election. The incumbent Liberal Party of Australia led by Premier of South Australia David Tonkin was defeated by the Australian Labor Party led by Leader of the Opposition John Bannon.
State elections were held in South Australia on 15 September 1979. All 47 seats in the South Australian House of Assembly were up for election. The incumbent Australian Labor Party led by Premier of South Australia Des Corcoran was defeated by the Liberal Party of Australia led by Leader of the Opposition David Tonkin.
State elections were held in South Australia on 17 September 1977. All 47 seats in the South Australian House of Assembly were up for election. The incumbent Australian Labor Party led by Premier of South Australia Don Dunstan won a fourth term in government, defeating the Liberal Party of Australia led by Leader of the Opposition David Tonkin.
State elections were held in South Australia on 10 March 1973. All 47 seats in the South Australian House of Assembly were up for election. The incumbent Australian Labor Party led by Premier of South Australia Don Dunstan won a second term in government, defeating the Liberal and Country League led by Leader of the Opposition Bruce Eastick.
The 1968South AustralianState election was held in South Australia on 2 March 1968. All 39 seats in the South Australian House of Assembly were up for election; 38 of the 39 contests were won by candidates from Australia's two major political parties. The incumbent Labor Party South Australia led by Premier of South Australia Don Dunstan and the Liberal and Country League led by Leader of the Opposition Steele Hall) both won 19 seats. The sole independent candidate to win a race, Tom Stott of the Ridley electorate, joined with the LCL's 19 seats to form a coalition government that held a 20 to 19 majority, thus defeating the Dunstan Labor government.
State elections were held in South Australia on 26 March 1927. All 46 seats in the South Australian House of Assembly were up for election. The incumbent Australian Labor Party government led by Premier of South Australia Lionel Hill was defeated by the opposition Liberal Federation led by Leader of the Opposition Richard L. Butler, and the Country Party (SA) led by Archie Cameron. Each district elected multiple members, with voters casting multiple votes.
State elections were held in South Australia on 8 March 1947. All 39 seats in the South Australian House of Assembly were up for election. The incumbent Liberal and Country League government led by Premier of South Australia Thomas Playford IV defeated the opposition Australian Labor Party led by Leader of the Opposition Robert Richards.
Robert John Randall is an Australian politician. Randall was the Liberal MP for the South Australian House of Assembly seat of Henley Beach from 1979 to 1982. Randall was also Liberal State President from 2003 to 2005, and a former Liberal Mayor of Henley and Grange Council. He held membership, c. 1998, with the Christian Democrats. Since 2008 he has held membership with Family First.
The 2014 South Australian state election elected members to the 53rd Parliament of South Australia on 15 March 2014, to fill all 47 seats in the House of Assembly and 11 of 22 seats in the Legislative Council. The 12-year-incumbent Australian Labor Party (SA) government, led by Premier Jay Weatherill, won its fourth consecutive four-year term in government, a record 16 years of Labor government, defeating the opposition Liberal Party of Australia (SA), led by Opposition Leader Steven Marshall.
John Patrick Trainer is a former Australian politician.
The 2018 South Australian state election to elect members to the 54th Parliament of South Australia was held on 17 March 2018. All 47 seats in the House of Assembly or lower house, whose members were elected at the 2014 election, and 11 of 22 seats in the Legislative Council or upper house, last filled at the 2010 election, were contested. The record-16-year-incumbent Australian Labor Party (SA) government led by Premier Jay Weatherill was seeking a fifth four-year term, but was defeated by the opposition Liberal Party of Australia (SA), led by Opposition Leader Steven Marshall. Nick Xenophon's new SA Best party unsuccessfully sought to obtain the balance of power.
This is a list of House of Assembly results for the 1979 South Australian state election.
The South Australian Labor Party, officially known as the Australian Labor Party (South Australian Branch) and commonly referred to simply as South Australian Labor, is the South Australian Branch of the Australian Labor Party, originally formed in 1891 as the United Labor Party of South Australia. It is one of two major parties in the bicameral Parliament of South Australia, the other being the Liberal Party of Australia (SA Division).
This is a list of candidates of the 2018 South Australian state election. The election was held on 17 March 2018.
SA-Best, formerly known as Nick Xenophon's SA-BEST, is a political party in South Australia. It was founded in 2017 by Nick Xenophon as a state-based partner to his Nick Xenophon Team party. After an unsuccessful 2022 South Australian state election, the party has one representative in the South Australian Legislative Council, Connie Bonaros, whose term expires in 2026.
The 2022 South Australian state election was held on 19 March 2022 to elect members to the 55th Parliament of South Australia. All 47 seats in the House of Assembly, and half the seats in the Legislative Council were up for re-election.