This is a list of results for the 2021 New South Wales local elections in the Greater Sydney region. [1] [2] [3] [4]
The Liberal Party did not endorse any candidates, including its five councillors elected in 2017. [5]
Party | Votes | % | Swing | Seats | Change | ||
---|---|---|---|---|---|---|---|
Labor | 37,157 | 45.7 | −0.3 | 7 | |||
Independent | 22,563 | 27.8 | +7.8 | 4 | 1 | ||
Independent Liberal | 7,564 | 9.3 | −17.9 [lower-alpha 1] | 2 | 5 [lower-alpha 1] | ||
Peaceful Bayside | 3,015 | 3.7 | 1 | 1 | |||
Greens | 10,969 | 13.5 | +6.8 | 1 | 1 | ||
Formal votes | 81,268 |
Elected councillor | Party | |
---|---|---|
Christina Curry | Labor | |
Scott Morrissey | Labor | |
Jennifer Muscat | Independent (Group A) |
Party | Candidate | Votes | % | ±% | |
---|---|---|---|---|---|
Labor | 10,496 | 60.4 | |||
Independent (Group A) | 2,807 | 16.2 | |||
Independent (Group D) | 2,165 | 12.5 | |||
Greens | 1,911 | 11.0 | |||
Total formal votes | 17,379 | 94.2 | |||
Informal votes | 1,070 | 5.8 | |||
Turnout | 82.7 |
Elected councillor | Party | |
---|---|---|
Jo Jansyn | Labor | |
Ann Fardell | Labor | |
Michael Nagi | Ind. Liberal |
Party | Candidate | Votes | % | ±% | |
---|---|---|---|---|---|
Labor | 9,164 | 53.4 | |||
Independent Liberal | 3,173 | 18.5 | |||
Greens | 3,169 | 18.5 | |||
Independent (Group C) | 1,662 | 9.7 | |||
Total formal votes | 17,168 | 94.2 | |||
Informal votes | 1,064 | 5.8 | |||
Turnout | 80.4 |
Elected councillor | Party | |
---|---|---|
Bill Saravinovski | Labor | |
Greta Werner | Greens | |
Andrew Tsounis | Independent (Group D) |
Party | Candidate | Votes | % | ±% | |
---|---|---|---|---|---|
Labor | 6,494 | 42.7 | |||
Greens | 3,459 | 22.7 | |||
Independent (Group D) | 2,935 | 19.3 | |||
Independent (Group A) | 2,324 | 15.3 | |||
Total formal votes | 15,212 | 92.7 | |||
Informal votes | 1,202 | 7.3 | |||
Turnout | 83.2 |
Elected councillor | Party | |
---|---|---|
Liz Barlow | Independent | |
Mark Hanna | Independent | |
Joe Awada | Labor |
Party | Candidate | Votes | % | ±% | |
---|---|---|---|---|---|
Independent (Group A) | 7,412 | 44.9 | |||
Labor | 6,677 | 40.4 | |||
Greens | 2,430 | 14.7 | |||
Total formal votes | 16,519 | 93.0 | |||
Informal votes | 1,239 | 7.0 | |||
Turnout | 85.8 |
Elected councillor | Party | |
---|---|---|
Edward McDougall | Labor | |
Heidi Douglas | Peaceful Bayside | |
Paul Sedrak | Ind. Liberal |
Party | Candidate | Votes | % | ±% | |
---|---|---|---|---|---|
Independent Liberal | 4,347 | 29.0 | |||
Labor | 4,326 | 28.9 | |||
Peaceful Bayside | 3,015 | 20.1 | |||
Independent (Group E) | 2,487 | 16.1 | |||
Independent (Group D) | 771 | 5.1 | |||
Independent Liberal | Ron Bezic | 44 | 0.3 | ||
Total formal votes | 14,990 | 91.5 | |||
Informal votes | 1,398 | 8.5 | |||
Turnout | 84.4 |
The Liberal Party did not endorse any candidates, including its five councillors elected in 2016. [7] [8]
Party | Votes | % | Swing | Seats | Change | ||
---|---|---|---|---|---|---|---|
Labor | 98,633 | 53.6 | +1.8 | 10 | |||
Blacktown Coalition Team | 33,720 | 18.3 | +18.3 | 1 | 1 | ||
Independent Liberal | 32,747 | 17.8 | 3 | 3 | |||
Your Community Coalition | 9,104 | 4.9 | +4.9 | 1 | 1 | ||
Greens | 4,632 | 2.5 | 0 | ||||
Blacktown Matters Independents | 4,335 | 2.4 | 0 | ||||
Independent | 981 | 0.5 | 0 | ||||
Formal votes | 184,152 | 93.47 | |||||
Informal votes | 12,862 | 6.53 | |||||
Total | 197,014 | 100.0 |
Elected councillor | Party | |
---|---|---|
Moninder Singh | Labor | |
Christopher Quilkey | Labor | |
Jess Diaz | Ind. Liberal |
Party | Candidate | Votes | % | ±% | |
---|---|---|---|---|---|
Labor | 22,693 | 51.6 | |||
Independent Liberal | 12,285 | 27.2 | |||
Blacktown Coalition Team | 8,534 | 19.4 | |||
Independent | Anil Kumar | 500 | 1.1 | ||
Total formal votes | 44,012 | 53.9 | |||
Informal votes | 2,857 | 6.1 | |||
Turnout | 86.6 |
Elected councillor | Party | |
---|---|---|
Julie Griffiths | Labor | |
Kushpinder Kaur | Labor | |
Michael Stubley | Coalition Team |
Party | Candidate | Votes | % | ±% | |
---|---|---|---|---|---|
Labor | 16,589 | 47.6 | |||
Blacktown Coalition Team | 9,277 | 26.6 | |||
Greens | 4,632 | 13.3 | |||
Independent Liberal | 4,136 | 11.9 | |||
Independent | Kittu Randhawa | 220 | 0.6 | ||
Total formal votes | 34,854 | 94.0 | |||
Informal votes | 2,211 | 6.0 | |||
Turnout | 85.2 |
Elected councillor | Party | |
---|---|---|
Susai Benjamin | Labor | |
Kathie Collins | Labor | |
Allan Green | Community Coalition |
Party | Candidate | Votes | % | ±% | |
---|---|---|---|---|---|
Labor | 19,245 | 57.1 | |||
Your Community Coalition | 9,104 | 27.0 | |||
Blacktown Coalition Team | 5,332 | 15.8 | |||
Total formal votes | 33,681 | 93.4 | |||
Informal votes | 2,398 | 6.6 | |||
Turnout | 83.6 |
Elected councillor | Party | |
---|---|---|
Carol Israel | Labor | |
Bob Fitzgerald | Labor | |
Peter Camilleri | Ind. Liberal |
Party | Candidate | Votes | % | ±% | |
---|---|---|---|---|---|
Labor | 20,485 | 57.9 | |||
Independent Liberal | 8,905 | 25.2 | |||
Blacktown Coalition Team | 5,961 | 16.9 | |||
Total formal votes | 35,351 | 93.5 | |||
Informal votes | 2,447 | 6.5 | |||
Turnout | 84.6 |
Elected councillor | Party | |
---|---|---|
Tony Bleasdale | Labor | |
Brad Bunting | Labor | |
Livingston Chettipally | Ind. Liberal |
Party | Candidate | Votes | % | ±% | |
---|---|---|---|---|---|
Labor | 19,621 | 54.1 | |||
Independent Liberal | 7,421 | 20.5 | |||
Blacktown Coalition Team | 4,616 | 12.7 | |||
Blacktown Matters Independents | 4,335 | 12.0 | |||
Independent | Ammar Khan | 261 | 0.7 | ||
Total formal votes | 36,254 | 92.5 | |||
Informal votes | 2,949 | 7.5 | |||
Turnout | 78.4 |
Party | Votes | % | Swing | Seats | Change | ||
---|---|---|---|---|---|---|---|
Labor | 24,032 | 49.2 | +11.4 | 6 | 1 | ||
Liberal | 11,750 | 24.1 | −1.1 | 3 | 1 | ||
Greens | 7,296 | 14.9 | −4.3 | 2 | |||
Independent | 5,755 | 11.8 | −5.9 | 1 | |||
Formal votes | 48,833 | 96.48 | |||||
Informal votes | 1,784 | 3.52 | |||||
Total | 50,617 | 100.00 |
Elected councillor | Party | |
---|---|---|
Suzie van Opdorp | Labor | |
Kevin Schreiber | Liberal | |
Sarah Redshaw | Greens |
Party | Candidate | Votes | % | ±% | |
---|---|---|---|---|---|
Labor | 5,303 | 46.4 | |||
Greens | 3,267 | 28.6 | |||
Liberal | 2,865 | 25.1 | |||
Total formal votes | 11,435 | 95.8 | |||
Informal votes | 501 | 4.2 | |||
Turnout | 11,936 | 82.6 |
Elected councillor | Party | |
---|---|---|
Claire West | Labor | |
Romola Hollywood | Labor | |
Brent Hoare | Greens |
Party | Candidate | Votes | % | ±% | |
---|---|---|---|---|---|
Labor | 5,950 | 47.6 | |||
Liberal | 2,270 | 18.2 | |||
Independent | 2,145 | 17.2 | |||
Greens | 2,128 | 17.0 | |||
Total formal votes | 12,493 | 96.3 | |||
Informal votes | 474 | 3.7 | |||
Turnout | 12,967 | 88.4 |
Elected councillor | Party | |
---|---|---|
Mick Fell | Labor | |
Roza Sage | Liberal | |
Daniel Myles | Independent |
Party | Candidate | Votes | % | ±% | |
---|---|---|---|---|---|
Labor | 4,821 | 38.4 | |||
Liberal | 3,873 | 30.8 | |||
Independent | 1,972 | 15.7 | |||
Greens | 1,901 | 15.1 | |||
Total formal votes | 12,567 | 96.7 | |||
Informal votes | 425 | 3.3 | |||
Turnout | 12,992 | 88.4 |
Elected councillor | Party | |
---|---|---|
Mark Greenhill | Labor | |
Nyree Fisher | Labor | |
Brendan Christie | Liberal |
Party | Candidate | Votes | % | ±% | |
---|---|---|---|---|---|
Labor | 7,958 | 64.5 | |||
Liberal | 2,742 | 22.2 | |||
Independent | 1,638 | 13.3 | |||
Total formal votes | 12,338 | 97.0 | |||
Informal votes | 384 | 3.0 | |||
Turnout | 12,722 | 89.2 |
Elected councillor | Party | |
---|---|---|
Heather Crichton | Labor | |
George Mannah | Labor | |
Pascale Esber | Labor | |
David Hull | Liberal | |
Hugo Robinson | Liberal | |
Ned Cutcher | Greens |
Party | Candidate | Votes | % | ±% | |
---|---|---|---|---|---|
Labor | 9,002 | 52.2 | +1.1 | ||
Liberal | 4,050 | 23.5 | −2.4 | ||
Greens | 2,196 | 12.7 | +12.7 | ||
Independent | 1,277 | 7.4 | +7.4 | ||
Major Independent Group | 725 | 4.2 | +4.2 | ||
Total formal votes | 17,250 | 94.4 | |||
Informal votes | 1,030 | 5.6 | |||
Turnout | 18,280 | 87.0 | |||
Party total seats | Seats | ± | |||
Labor | 3 | ||||
Liberal | 2 | ||||
Greens | 1 | 1 |
Party | Votes | % | Swing | Seats | Change | ||
---|---|---|---|---|---|---|---|
Liberal | 27,148 | 44.0 | +12.0 | 4 | |||
Labor | 20,351 | 33.0 | +8.0 | 3 | |||
Independent | 13,913 | 22.5 | −20.5 | 2 | |||
Shooters, Fishers and Farmers | 314 | 0.5 | +0.5 | 0 | |||
Formal votes | 61,726 | 94.58 | |||||
Informal votes | 3,537 | 5.42 | |||||
Total | 65,263 | 100.0 |
Elected councillor | Party | |
---|---|---|
Therese Fedeli | Liberal | |
Ashleigh Cagney | Labor | |
Peter McLean | Independent |
Party | Candidate | Votes | % | ±% | |
---|---|---|---|---|---|
Liberal | 8,708 | 42.0 | |||
Labor | 7,539 | 36.4 | |||
Independent | 4,488 | 21.6 | |||
Total formal votes | 20,735 | 94.7 | |||
Informal votes | 1,159 | 5.3 | |||
Turnout | 21,894 | 86.7 |
Elected councillor | Party | |
---|---|---|
Lara Symkowiak | Liberal | |
Cindy Cagney | Labor | |
Usha Dommaraju | Liberal |
Party | Candidate | Votes | % | ±% | |
---|---|---|---|---|---|
Liberal | 11,291 | 49.1 | |||
Labor | 8,119 | 35.3 | |||
Independent (Group B) | 2,266 | 9.9 | |||
Independent (Group D) | 710 | 3.1 | |||
Shooters, Fishers, Farmers | Kadeja Assaad | 314 | 1.4 | ||
Independent | Muhammad Farooq | 275 | 1.2 | ||
Total formal votes | 22,975 | 94.4 | |||
Informal votes | 1,366 | 5.6 | |||
Turnout | 24,341 | 86.0 |
Elected councillor | Party | |
---|---|---|
Russel Zammit | Liberal | |
Eva Campbell | Independent | |
Paul Farrow | Labor |
Party | Candidate | Votes | % | ±% | |
---|---|---|---|---|---|
Liberal | 7,149 | 39.7 | |||
Independent (Group A) | 5,849 | 32.5 | |||
Labor | 4,693 | 26.0 | |||
Independent | Mick Jackson | 256 | 1.4 | ||
Independent | Valerie Tarela-Moyes | 69 | 0.4 | ||
Total formal votes | 18,016 | 94.7 | |||
Informal votes | 1,012 | 5.3 | |||
Turnout | 19,028 | 85.2 |
Elected councillor | Party | |
---|---|---|
George Brticevic | Labor | |
Meg Oates | Labor | |
Darcy Lound | Labor | |
Margaret Chivers | Labor | |
Rey Manoto | Labor | |
Masood Chowdhury | Labor | |
Karen Hunt | Labor | |
George Greiss | Liberal | |
Marian George | Liberal | |
Riley Munro | Liberal | |
John Chew | Liberal | |
Matt Stellino | Animal Justice | |
Josh Cotter | Community First | |
Masud Khalil | Community Voice | |
Warren Morrison | TLCP |
Party | Candidate | Votes | % | ±% | |
---|---|---|---|---|---|
Labor | 39,162 | 43.8 | +0.5 | ||
Liberal | 22,056 | 24.7 | +8.2 | ||
Community First Team | 7,561 | 8.5 | −0.4 | ||
Totally Locally Committed | 4,809 | 5.4 | −4.6 | ||
Community Voice | 4,388 | 4.9 | |||
Animal Justice | 4,261 | 4.8 | +4.8 | ||
Greens | 4,057 | 4.5 | −0.4 | ||
Campbelltown Independents | 2,857 | 3.2 | |||
Independent | Mukesh Chand | 98 | 0.1 | ||
Independent | Mick Allen | 88 | 0.1 | ||
Total formal votes | 89,337 | 93.7 | |||
Informal votes | 6,011 | 6.3 | |||
Turnout | 95,348 | 84.4 | |||
Party total seats | Seats | ± | |||
Labor | 7 | ||||
Liberal | 4 | 1 | |||
Community First Team | 1 | ||||
Totally Locally Committed | 1 | 1 | |||
Community Voice | 1 | 1 | |||
Animal Justice | 1 | 1 | |||
Greens | 0 | 1 |
Four councillors did not seek re-election:
Elected councillor | Party | |
---|---|---|
Michael Megna | Liberal | |
Stephanie Di Pasqua | Liberal | |
Anthony Bazouni | Liberal | |
Julia Little | Labor | |
Andrew Ferguson | Labor | |
Joseph Cordaro | OLC | |
Carmela Ruggeri | OLC | |
Charles Jago | Greens |
Party | Candidate | Votes | % | ±% | |
---|---|---|---|---|---|
Liberal | 14,126 | 29.8 | −8.8 | ||
Labor | 13,917 | 29.3 | −6.1 | ||
Our Local Community | 12,867 | 27.1 | +27.1 | ||
Greens | 4,653 | 9.8 | −1.5 | ||
Independent | 1,909 | 4.0 | −4.2 | ||
Total formal votes | 47,472 | 95.4 | |||
Informal votes | 2,312 | 4.6 | |||
Turnout | 49,784 | 85.6 | |||
Party total seats | Seats | ± | |||
Liberal | 3 | ||||
Labor | 2 | 1 | |||
Our Local Community | 2 | 2 | |||
Greens | 1 | ||||
Independent | 0 | 1 |
Party | Votes | % | Swing | Seats | Change | ||
---|---|---|---|---|---|---|---|
Labor | 83724 | 47.4 | +0.0 | 9 | |||
Liberal | 52960 | 30.0 | +0.6 | 5 | |||
Greens | 6,608 | 3.7 | −4.8 | 0 | 1 | ||
Independent | 16,221 | 9.1 | +4.6 | 0 | |||
Barbara Coorey Independent Group | 9,027 | 5.1 | +5.1 | 1 | 1 | ||
Our Local Community | 5105 | 2.9 | −7.2 | 0 | |||
Animal Justice | 2,746 | 8.2 | +8.2 | 0 | |||
Communist League | 99 | 0.1 | 0 | ||||
Formal votes | 176,490 |
Elected councillor | Party | |
---|---|---|
Khal Asfour | Labor | |
Bilal El-Hayek | Labor | |
George Zakhia | Liberal |
Party | Candidate | Votes | % | ±% | |
---|---|---|---|---|---|
Labor | 19,848 | 58.3 | |||
Liberal | 10,412 | 30.6 | |||
Independent | 3,802 | 11.2 | |||
Total formal votes | 34,062 | 93.5 | |||
Informal votes | 2,378 | 6.5 | |||
Turnout | 36,440 | 80.9 |
Elected councillor | Party | |
---|---|---|
Rachelle Harika | Labor | |
Christopher Cahill | Labor | |
Charlie Ishac | Liberal |
Party | Candidate | Votes | % | ±% | |
---|---|---|---|---|---|
Labor | 17,194 | 51.9 | |||
Liberal | 9,991 | 30.1 | |||
Independent | 5,968 | 18.0 | |||
Total formal votes | 33,153 | 92.9 | |||
Informal votes | 2,547 | 7.1 | |||
Turnout | 35,700 | 80.3 |
Elected councillor | Party | |
---|---|---|
Clare Raffan | Labor | |
Jessie Nguyen | Liberal | |
Barbara Coorey | BCIG |
Party | Candidate | Votes | % | ±% | |
---|---|---|---|---|---|
Labor | 12,708 | 34.1 | |||
Barbara Coorey Independent Group | 9,027 | 24.2 | +24.2 | ||
Liberal | 8,834 | 23.7 | |||
Greens | 6,608 | 17.7 | |||
Communist League | Linda Harris | 99 | 0.3 | ||
Total formal votes | 37,276 | 94.2 | |||
Informal votes | 2,310 | 5.8 | |||
Turnout | 39,586 | 85.1 |
Elected councillor | Party | |
---|---|---|
David Walsh | Labor | |
Linda Downey | Labor | |
Charbel Abouraad | Liberal |
Party | Candidate | Votes | % | ±% | |
---|---|---|---|---|---|
Labor | 16,123 | 41.9 | |||
Liberal | 14,031 | 36.5 | |||
Our Local Community | 5,105 | 13.3 | |||
Independent | 2,758 | 7.2 | |||
Independent | Chris Brogan | 429 | 1.1 | ||
Total formal votes | 38,446 | 94.9 | |||
Informal votes | 2,080 | 5.1 | |||
Turnout | 40,526 | 86.3 |
Elected councillor | Party | |
---|---|---|
Karl Saleh | Labor | |
Bhadra Waida | Labor | |
Sazeda Akter | Liberal |
Party | Candidate | Votes | % | ±% | |
---|---|---|---|---|---|
Labor | 17,851 | 53.2 | |||
Liberal | 9,692 | 28.9 | |||
Independent | 3,264 | 9.7 | |||
Animal Justice | 2,746 | 8.2 | +8.2 | ||
Total formal votes | 33,553 | 92.5 | |||
Informal votes | 2,724 | 7.5 | |||
Turnout | 36,277 | 80.7 |
| |||||||||||||||||||||||||||||||||||||||||
All 15 councillors on Cumberland City Council 8 seats needed for a majority | |||||||||||||||||||||||||||||||||||||||||
---|---|---|---|---|---|---|---|---|---|---|---|---|---|---|---|---|---|---|---|---|---|---|---|---|---|---|---|---|---|---|---|---|---|---|---|---|---|---|---|---|---|
| |||||||||||||||||||||||||||||||||||||||||
|
Cumberland City Council is composed of five three-member wards, totalling 15 councillors. At the 2017 election, Labor won a majority with eight seats. [17]
In 2017, Greystanes Ward councillor Greg Cummings was suspended from Labor, and was expelled from the party in October 2018. [18] In September 2019, Granville Ward councillor Steve Christou left Labor to join Our Local Community. [18]
The Liberal Party did not endorse any candidates, leading its incumbent councillors to contest as Independent Liberals. [19]
Party | Votes | % | Swing | Seats | Change | ||
---|---|---|---|---|---|---|---|
Labor | 47,343 | 48.6 | +9.4 | 8 | |||
Our Local Community | 27,547 | 28.3 | +14.0 | 4 | 2 | ||
Independent Liberal | 12,467 | 12.8 | −13.4 [lower-alpha 2] | 2 | 3 [lower-alpha 2] | ||
The Independents | 6,388 | 6.5 | +6.5 | 1 | 1 | ||
Greens | 2,748 | 2.8 | +1.1 | 0 | |||
Independent | 968 | 1.0 | 0 | ||||
Formal votes | 97,461 | 96.48 |
Elected councillor | Party | |
---|---|---|
Ola Hamed | Labor | |
Steve Christou | OLC | |
Joseph Rahme | Ind. Liberal |
Party | Candidate | Votes | % | ±% | |
---|---|---|---|---|---|
Labor | 8,222 | 42.5 | |||
Our Local Community | 6,252 | 32.4 | |||
Independent Liberal | 4,274 | 22.1 | |||
Independent | Carly Lewis | 422 | 2.2 | ||
Independent | Jacob Abraham | 108 | 0.6 | ||
Independent | Ibtisam Koreel | 47 | 0.2 | ||
Total formal votes | 19,325 | 93.0 | |||
Informal votes | 1,447 | 7.0 | |||
Turnout | 79.8 |
Elected councillor | Party | |
---|---|---|
Diane Colman | Labor | |
Eddy Sarkis | OLC | |
Greg Cummings | The Independents |
Party | Candidate | Votes | % | ±% | |
---|---|---|---|---|---|
Labor | 6,838 | 32.9 | |||
Our Local Community | 7,228 | 34.8 | |||
The Independents | 6,388 | 30.7 | +30.7 | ||
Independent Liberal | 325 | 1.6 | |||
Total formal votes | 20,779 | 93.9 | |||
Informal votes | 1,357 | 6.1 | |||
Turnout | 85.4 |
Elected councillor | Party | |
---|---|---|
Kun Huang | Labor | |
Sabrin Farooqui | Labor | |
Helen Hughes | OLC |
Party | Candidate | Votes | % | ±% | |
---|---|---|---|---|---|
Labor | 11,789 | 59.7 | |||
Our Local Community | 4,307 | 21.8 | |||
Independent Liberal | 3,262 | 16.5 | |||
Independent | Khaled Sunkesula | 391 | 2.0 | ||
Total formal votes | 19,749 | 94.0 | |||
Informal votes | 1,267 | 6.0 | |||
Turnout | 84.9 |
Elected councillor | Party | |
---|---|---|
Glenn Elmore | Labor | |
Mohamad Hussein | Labor | |
Paul Garrard | OLC |
Party | Candidate | Votes | % | ±% | |
---|---|---|---|---|---|
Labor | 11,291 | 64.9 | |||
Our Local Community | 6,106 | 35.1 | |||
Total formal votes | 17,397 | 92.1 | |||
Informal votes | 1,500 | 7.9 | |||
Turnout | 18,897 | 76.1 |
Elected councillor | Party | |
---|---|---|
Suman Saha | Labor | |
Lisa Lake | Labor | |
Michael Zaiter | Ind. Liberal |
Party | Candidate | Votes | % | ±% | |
---|---|---|---|---|---|
Labor | 9,203 | 45.5 | |||
Independent Liberal | 4,606 | 22.8 | |||
Our Local Community | 3,654 | 18.1 | |||
Greens | 2,748 | 13.6 | |||
Total formal votes | 20,211 | 94.7 | |||
Informal votes | 1,134 | 5.3 | |||
Turnout | 21,345 | 83.4 |
| |||||||||||||||||||||||||||||
All 12 seats on Fairfield City Council [lower-alpha 3] 7 seats needed for a majority | |||||||||||||||||||||||||||||
---|---|---|---|---|---|---|---|---|---|---|---|---|---|---|---|---|---|---|---|---|---|---|---|---|---|---|---|---|---|
| |||||||||||||||||||||||||||||
|
Fairfield City Council is composed of two six-member wards, as well as a directly-elected mayor.
The Liberal Party did not endorse any candidates, including its three councillors elected in 2016. [23]
The election was conducted by the Australian Election Company. [23]
Although Frank Carbone and Dai Le formed their own groups, they have an alliance on council. [24] [25] [26]
Party | Votes | % | Swing | Seats | Change | ||
---|---|---|---|---|---|---|---|
Frank Carbone | 39,445 | 42.5 | 6 | ||||
Dai Le | 18,774 | 20.2 | 3 | ||||
Labor | 23,081 | 24.9 | −20.2 | 3 | 3 | ||
The Real Local | 3,468 | 3.7 | +3.7 | 0 | |||
Independent | 3,007 | 3.2 | 0 | ||||
Our Local Community | 2,880 | 3.1 | +3.1 | 0 | |||
Independent Liberal | 2,207 | 2.4 | −16.1 [lower-alpha 4] | 0 | 3 [lower-alpha 4] | ||
Formal votes | 92,862 |
Party | Candidate | Votes | % | ±% | |
---|---|---|---|---|---|
Frank Carbone | 1. Charbel Saliba (elected) 2. Milovan Karajcic (elected) 3. Emmanuel Brikha 4. Antonio Carbone 5. Annie Tran 6. Rita Paul Matti | 14,975 | 31.6 | ||
Dai Le | 1. Dai Le (elected) 2. Kevin Lam (elected) 3. Joline Korkis 4. Miranda Garcia Jose 5. Sue Lee Lim 6. Ngoc My Tang | 13,047 | 27.5 | +27.5 | |
Labor | 1. Carmen Lazar (elected) 2. Kien Ly (elected) 3. Lawrence White 4. Luis Borges 5. Abrahem Wannous 6. Shawn Anfernee Lu | 12,838 | 27.0 | ||
The Real Local | 1. Basim Shamaon 2. Anthony Nguyen 3. Dunya Lazar 4. Buhendwa Ozegbe Navazu 5. Abdal Abdal 6. Hikmet Nessan Eliaa | 3,468 | 7.3 | +7.3 | |
Independent | 1. Andrew Nghiep Nguyen 2. Jolet Youkhana 3. Thanh Nha Ly 4. Kim-Hong Meas 5. Tiffany Luu 6. Jenny Lam | 2,988 | 6.3 | ||
Independent Liberal | Lachlan Hyde | 129 | 0.3 | ||
Independent | Huu Tam Luong | 19 | 0.0 | ||
Total formal votes | 47,464 | ||||
Turnout | 70.6 |
Party | Candidate | Votes | % | ±% | |
---|---|---|---|---|---|
Frank Carbone | 1. Frank Carbone 2. Reni Barkho (elected) 3. Hugo Morvillo (elected) 4. Michael Mijaiovic (elected) 5. Marie Saliba (elected) 6. Martina Hanna | 24,470 | 53.9 | ||
Labor | 1. George Barcha (elected) 2. Ninos Khoshaba 3. Sera Mesude Yilmaz 4. Tri Vo 5. Joan Pellegrino 6. Mickey Ngo | 10,243 | 22.6 | ||
Dai Le | 1. Andrew Rohan (elected) 2. Wendy Chuyen Tran 3. Ly Huynh Nguyen 4. Thi Lyfa Thach 5. Rebecca Di Noia 6. Benjamin Saliba | 5,727 | 12.6 | +12.6 | |
Our Local Community | 1. Samir Yousif 2. Vedran Maric 3. Saul Soto 4. George Korkis 5. Marlin Toma 6. David Nguyen | 2,880 | 6.3 | +6.3 | |
Independent Liberal | 1. Peter Grippaudo 2. Marko Pavlovic 3. Rabi Harmes 4. Tan Dat Le 5. Danny Mona 6. Mark Masling | 2,078 | 4.6 | ||
Total formal votes | 45,398 | ||||
Turnout | 73.6 |
| |||||||||||||||||||||||||||||||||||||||||
All 15 councillors on Georges River Council 8 seats needed for a majority | |||||||||||||||||||||||||||||||||||||||||
---|---|---|---|---|---|---|---|---|---|---|---|---|---|---|---|---|---|---|---|---|---|---|---|---|---|---|---|---|---|---|---|---|---|---|---|---|---|---|---|---|---|
| |||||||||||||||||||||||||||||||||||||||||
|
Georges River Council is composed of five three-member wards, totalling 15 councillors. At the 2017 election, Labor won a plurality with six seats.
Party | Votes | % | Swing | Seats | Change | ||
---|---|---|---|---|---|---|---|
Labor | 25,064 | 32.4 | −5.7 | 5 | 1 | ||
Liberal | 22,459 | 29.0 | −4.6 | 5 | |||
Residents and Ratepayers | 16,607 | 21.4 | +21.4 | 4 | 4 | ||
Independents | 10,279 | 13.3 | −5.1 | 0 | 3 | ||
Georges River Association | 2,105 | 2.7 | +2.7 | 1 | 1 | ||
Kogarah Residents' Association | 919 | 1.2 | −3.4 | 0 | 1 | ||
Communist League | 17 | 0.0 | +0.0 | 0 | |||
Formal votes | 77,450 | 94.56 | |||||
Informal votes | 4,456 | 5.44 | |||||
Total | 81,906 | 100.00 |
Elected councillor | Party | |
---|---|---|
Sam Elmir | Liberal | |
Natalie Mort | GRRRP | |
Kathryn Landsberry | Labor |
Party | Candidate | Votes | % | ±% | |
---|---|---|---|---|---|
Liberal | 5,109 | 31.7 | |||
Residents and Ratepayers | 4,276 | 26.5 | +26.5 | ||
Labor | 3,963 | 24.6 | |||
Independent (Group D) | 2,218 | 13.7 | |||
Independent (Group C) | 576 | 3.6 | |||
Total formal votes | 16,142 | 95.3 | |||
Informal votes | 795 | 4.7 | |||
Turnout | 16,937 | 87.7 |
Elected councillor | Party | |
---|---|---|
Colleen Symington | Labor | |
Nancy Liu | Liberal | |
Benjamin Wang | GRA |
Party | Candidate | Votes | % | ±% | |
---|---|---|---|---|---|
Labor | 4,468 | 30.2 | |||
Liberal | 3,579 | 24.2 | |||
Georges River Association | 2,105 | 14.2 | +14.2 | ||
Residents and Ratepayers | 1,617 | 10.9 | +10.9 | ||
Independent (Group A) | 1,638 | 11.1 | |||
Independent (Group D) | 1,349 | 9.1 | |||
Communist League | Robert Aiken | 17 | 0.1 | +0.1 | |
Total formal votes | 14,773 | 93.4 | |||
Informal votes | 1,039 | 6.6 | |||
Turnout | 15,812 | 85.9 |
Elected councillor | Party | |
---|---|---|
Nick Katris | Labor | |
Elise Borg | GRRRP | |
Sam Stratikopoulos | Liberal |
Party | Candidate | Votes | % | ±% | |
---|---|---|---|---|---|
Labor | 4,653 | 29.5 | |||
Residents and Ratepayers | 3,681 | 23.3 | +23.3 | ||
Liberal | 3,667 | 23.2 | |||
Independent | 2,823 | 17.9 | |||
Kogarah Residents' Association | 919 | 5.8 | |||
Independent | Greg McAleer | 54 | 0.3 | ||
Total formal votes | 15,797 | 93.9 | |||
Informal votes | 1,029 | 6.1 | |||
Turnout | 16,826 | 84.3 |
Elected councillor | Party | |
---|---|---|
Warren Tegg | Labor | |
Nick Smerdely | Liberal | |
Christina Jamieson | GRRRP |
Party | Candidate | Votes | % | ±% | |
---|---|---|---|---|---|
Labor | 5,054 | 35.0 | |||
Liberal | 4,908 | 34.0 | |||
Residents and Ratepayers | 3,044 | 21.1 | +21.1 | ||
Independent (Group D) | 866 | 6.0 | |||
Independent (Group B) | 327 | 2.3 | |||
Independent | David Perry | 128 | 0.9 | ||
Independent | Christian Stojkov | 84 | 0.6 | ||
Independent | Damian Cook | 41 | 0.3 | ||
Total formal votes | 14,452 | 94.3 | |||
Informal votes | 880 | 5.7 | |||
Turnout | 15,332 | 86.5 |
Elected councillor | Party | |
---|---|---|
Kevin Greene | Labor | |
Lou Konjarski | Liberal | |
Peter Mahoney | GRRRP |
Party | Candidate | Votes | % | ±% | |
---|---|---|---|---|---|
Labor | 6,926 | 42.5 | |||
Liberal | 5,196 | 31.9 | |||
Residents and Ratepayers | 3,989 | 24.5 | +24.5 | ||
Independent | Dina Ghazal | 175 | 1.1 | ||
Total formal votes | 16,286 | 95.8 | |||
Informal votes | 713 | 4.2 | |||
Turnout | 16,999 | 87.1 |
Elected councillor | Party | |
---|---|---|
Sarah McMahon | Liberal | |
Patrick Conolly | Liberal | |
Paul Veigel | Liberal | |
Jill Reardon | Liberal | |
Barry Calvert | Labor | |
Amanda Kotlash | Labor | |
Mary Lyons-Buckett | People Not Parties | |
Nathan Zamprogno | Ind. Liberal | |
Les Sheather | Les and The Doc | |
Shane Djuric | SFF | |
Danielle Wheeler | Greens | |
Eddie Dogramaci | Small Business |
Party | Candidate | Votes | % | ±% | |
---|---|---|---|---|---|
Liberal | 13,577 | 34.3 | +6.0 | ||
Labor | 4,783 | 12.1 | −4.3 | ||
People Not Parties | 3,846 | 9.7 | |||
Independent Liberal | 3,357 | 8.5 | |||
Les and The Doc | 2,916 | 7.4 | |||
Shooters, Fishers, Farmers | 2,821 | 7.1 | +7.1 | ||
Greens | 2,795 | 7.1 | −0.8 | ||
Small Business | 1,899 | 4.8 | +4.8 | ||
Andrew Cadman Group | 1,070 | 2.7 | |||
Independent | 947 | 2.4 | |||
Hawkesbury Alliance | 944 | 2.4 | |||
The Locals | 448 | 1.1 | |||
Independent | John Ross | 85 | 0.2 | ||
Total formal votes | 39,488 | 94.9 | |||
Informal votes | 2,135 | 5.1 | |||
Turnout | 41,623 | 86.1 |
Party | Votes | % | Swing | Seats | Change | ||
---|---|---|---|---|---|---|---|
Liberal | 42,748 | 50.2 | +6.3 | 6 | 4 | ||
Greens | 23,904 | 28.1 | +9.1 | 3 | 1 | ||
Labor | 11,755 | 13.0 | −3.8 | 0 | 2 | ||
Independent | 6,664 | 7.8 | −12.3 | 0 | 1 | ||
Formal votes | 85,071 | 96.89 | |||||
Informal votes | 2,732 | 3.11 | |||||
Total | 87,803 | 100.00 |
Elected councillor | Party | |
---|---|---|
Nathan Tilbury | Liberal | |
Warren Waddell | Liberal | |
Tania Salitra | Greens |
Party | Candidate | Votes | % | ±% | |
---|---|---|---|---|---|
Liberal | 14,496 | 50.4 | |||
Greens | 6,368 | 22.2 | |||
Labor | 5,145 | 17.9 | |||
Independent | 2,725 | 9.5 | |||
Total formal votes | 28,734 | 96.3 | |||
Informal votes | 1,111 | 3.7 | |||
Turnout | 29,845 | 88.8 |
Elected councillor | Party | |
---|---|---|
Sallianne McClelland | Liberal | |
Monika Ball | Greens | |
Janelle McIntosh | Labor |
Party | Candidate | Votes | % | ±% | |
---|---|---|---|---|---|
Liberal | 13,733 | 48.6 | |||
Greens | 7,930 | 28.0 | |||
Labor | 6,610 | 23.4 | |||
Total formal votes | 28,273 | 97.2 | |||
Informal votes | 817 | 2.8 | |||
Turnout | 29,090 | 86.5 |
Elected councillor | Party | |
---|---|---|
Verity Greenwood | Liberal | |
Sreeni Pillamarri | Liberal | |
Emma Heyde | Greens |
Party | Candidate | Votes | % | ±% | |
---|---|---|---|---|---|
Liberal | 14,519 | 51.7 | |||
Greens | 9,606 | 34.2 | |||
Independent | 3,939 | 14.0 | |||
Total formal votes | 28,064 | 97.2 | |||
Informal votes | 804 | 2.8 | |||
Turnout | 28,868 | 89.6 |
Party | Votes | % | Swing | Seats | Change | ||
---|---|---|---|---|---|---|---|
Independent | 3,372 | 41.0 | 3 | ||||
Liberal | 3,171 | 38.5 | +2.1 | 3 | |||
Team Ross | 1,260 | 15.3 | 1 | ||||
Greens | 431 | 5.2 | +5.2 | 0 | |||
Formal votes | 8,234 | 96.33 | |||||
Informal votes | 314 | 3.67 | |||||
Total | 8,548 | 100.00 |
Elected councillor | Party | |
---|---|---|
Julia Prieston | Liberal | |
Ross Williams | Team Ross | |
Elizabeth Krassoi | Independent (Group A) |
Party | Candidate | Votes | % | ±% | |
---|---|---|---|---|---|
Liberal | 1,576 | 37.8 | |||
Team Ross | 1,260 | 30.2 | |||
Independent (Group A) | 960 | 23.0 | |||
Independent (Group B) | 376 | 9.0 | |||
Total formal votes | 4,172 | 95.6 | |||
Informal votes | 193 | 4.4 | |||
Turnout | 4,365 | 85.9 |
Elected councillor | Party | |
---|---|---|
Tatyana Virgara | Liberal | |
Richard Quinn | Independent (Group F) | |
Jim Sanderson | Independent (Group B) |
Party | Candidate | Votes | % | ±% | |
---|---|---|---|---|---|
Liberal | 1,595 | 39.3 | |||
Independent (Group F) | 859 | 21.1 | |||
Independent (Group B) | 848 | 20.9 | |||
Greens | 431 | 10.6 | +10.6 | ||
Independent (Group D) | 263 | 6.5 | |||
Independent (Group C) | 66 | 1.6 | |||
Total formal votes | 4,062 | 97.1 | |||
Informal votes | 121 | 2.9 | |||
Turnout | 4,183 | 86.5 |
The Liberal Party did not endorse any candidates, including its two councillors elected in 2017. [36]
Party | Votes | % | Swing | Seats | Change | ||
---|---|---|---|---|---|---|---|
Labor | 40,113 | 38.6 | +4.7 | 8 | 3 | ||
Greens | 37,499 | 36.0 | +7.2 | 5 | |||
Independent | 15,967 | 15.3 | −2.7 | 2 | 1 | ||
Independent Liberal | 6,738 | 6.5 | −11.1 [lower-alpha 5] | 0 | 2 [lower-alpha 5] | ||
Community Independents | 1,195 | 1.1 | 0 | ||||
Community Independent | 898 | 0.9 | 0 | ||||
Animal Justice | 876 | 0.8 | +0.8 | 0 | |||
Socialist Alliance | 749 | 0.8 | –0.2 | 0 | |||
Formal votes | 104,035 | 96.49 | |||||
Informal votes | 3,795 | 3.51 | |||||
Total | 107,830 | 100.00 |
Elected councillor | Party | |
---|---|---|
Mark Drury | Labor | |
Dylan Griffiths | Greens | |
Jessica D'Arienzo | Labor |
Party | Candidate | Votes | % | ±% | |
---|---|---|---|---|---|
Labor | 8,294 | 38.9 | |||
Greens | 7,726 | 36.3 | |||
Independent | 2,243 | 20.5 | |||
Independent Liberal | 1,852 | 8.7 | |||
Community Independents | 1,195 | 5.6 | |||
Total formal votes | 21,310 | 95.9 | |||
Informal votes | 904 | 4.1 | |||
Turnout | 22,214 | 83.7 |
Elected councillor | Party | |
---|---|---|
Darcy Byrne | Labor | |
Kobi Shetty | Greens | |
John Stamolis | Independent |
Party | Candidate | Votes | % | ±% | |
---|---|---|---|---|---|
Labor | 7,751 | 36.5 | |||
Greens | 7,220 | 34.0 | |||
Independent | 3,814 | 18.0 | |||
Independent Liberal | 1,557 | 7.3 | |||
Community Independent | 898 | 4.2 | |||
Total formal votes | 21,240 | 97.5 | |||
Informal votes | 555 | 2.5 | |||
Turnout | 21,795 | 81.2 |
Elected councillor | Party | |
---|---|---|
Philippa Scott | Labor | |
Marghanita Da Cruz | Greens | |
Tim Stephens | Labor |
Party | Candidate | Votes | % | ±% | |
---|---|---|---|---|---|
Labor | 8,200 | 39.5 | |||
Greens | 7,508 | 36.1 | |||
Independent Liberal | 3,329 | 16.0 | |||
Animal Justice | 876 | +4.2 | +4.2 | ||
Independent | 870 | 4.2 | |||
Total formal votes | 20,783 | 95.8 | |||
Informal votes | 900 | 4.2 | |||
Turnout | 21,683 | 83.2 |
Elected councillor | Party | |
---|---|---|
Mat Howard | Labor | |
Justine Langford | Greens | |
Zoi Tsardoulias | Labor |
Party | Candidate | Votes | % | ±% | |
---|---|---|---|---|---|
Labor | 8,905 | 43.8 | |||
Greens | 7,293 | 35.8 | |||
Independent | 4,149 | 20.4 | |||
Total formal votes | 20,347 | 96.5 | |||
Informal votes | 731 | 3.5 | |||
Turnout | 21,078 | 80.4 |
Elected councillor | Party | |
---|---|---|
Liz Atkins | Greens | |
Chloe Smith | Labor | |
Pauline Lockie | Independent |
Party | Candidate | Votes | % | ±% | |
---|---|---|---|---|---|
Greens | 7,752 | 38.1 | |||
Labor | 6,963 | 34.2 | |||
Independent | 4,634 | 22.8 | |||
Socialist Alliance | 749 | 3.7 | |||
Independent | Daniel Ribarovski | 257 | 1.3 | ||
Total formal votes | 20,355 | 96.7 | |||
Informal votes | 705 | 3.3 | |||
Turnout | 21,060 | 78.9 |
Party | Votes | % | Swing | Seats | Change | ||
---|---|---|---|---|---|---|---|
Independent | 39,069 | 56.8 | 6 | ||||
Your Voice on Local Issues | 6,863 | 10.0 | 1 | ||||
Independent Liberal / Independent joint ticket | 6,053 | 8.8 | 0 | ||||
Independent Liberal | 5,908 | 8.6 | 2 | ||||
Preserve Ku-ring-gai | 2,600 | 3.8 | 1 | ||||
Greg Cook & Tori Huxtable | 2,455 | 3.6 | 0 | ||||
Liberal Democrats | 1,840 | 3.6 | 0 | ||||
Roshan Wickremanayake Group | 1,729 | 2.5 | 0 | ||||
Comenarra Independents | 1,170 | 1.7 | 0 | ||||
Campaign for Comenarra | 1,075 | 1.6 | 0 | ||||
Formal votes | 68,762 | 94.94 | |||||
Informal votes | 3,665 | 5.06 | |||||
Turnout | 72,427 |
Party | Candidate | Votes | % | ±% | |
---|---|---|---|---|---|
Independent | 1. Jeff Pettett (elected) 2. Trish Lynch | 5,362 | 38.8 | ||
Independent | 1. Greg Taylor (elected) 2. Mackenzie Sloan | 3,044 | 22.1 | ||
Roshan Wickremanayake Group | 1. Roshan Wickremanayake (Ind. Lib) 2. Shavera Gunasekera 3. Cameron Smith | 1,729 | 12.5 | ||
Independent Liberal/Independent joint ticket | 1. Gurdeep Singh (Ind. Lib) 2. Avtar Kaur | 1,424 | 10.3 | ||
Comenarra Independents | 1. Boru Tumulty 2. Ali Rabieli | 1,170 | 8.5 | ||
Campaign for Comenarra | 1. Jayamala Gupte (Ind. Lib) 2. Kay Smede | 1,075 | 7.8 | ||
Total formal votes | 13,804 | 94.7 | |||
Informal votes | 770 | 5.3 | |||
Turnout | 14,574 | 87.7 |
Party | Candidate | Votes | % | ±% | |
---|---|---|---|---|---|
Independent | 1. Barbara Ward (elected) 2. Mike Le | 6,802 | 49.6 | ||
Preserve Ku-ring-gai | 1. Simon Lennon (Ind. Lib) (elected) 2. Philip Hext | 2,600 | 19.0 | ||
Greg Cook & Tori Huxtable | 1. Greg Cook 2. Tori Huxtable | 2,455 | 17.9 | ||
Independent | 1. Peter Kelly 2. Anthony Carnovale | 1,863 | 13.6 | ||
Total formal votes | 13,720 | 94.0 | |||
Informal votes | 883 | 6.0 | |||
Turnout | 14,603 | 86.2 |
Party | Candidate | Votes | % | ±% | |
---|---|---|---|---|---|
Your Voice on Local Issues | 1. Sam Ngai (Ind. Lib) (elected) 2. Amanda Blackman 3. Mitchell Frater-Baird (Ind. Lib) | 6,863 | 49.8 | ||
Independent | 1. Alec Taylor (elected) 2. Shankari Nadanachandran | 3,308 | 24.0 | ||
Independent Liberal/Independent joint ticket | 1. Jennifer Anderson (Ind. Lib) 2. Annelie Kvisle | 2,606 | 18.9 | ||
Independent Liberal/Independent joint ticket | 1. Anthony Ching (Ind. Lib) 2. Carmel Heffernan | 1,008 | 7.3 | ||
Total formal votes | 13,785 | 96.1 | |||
Informal votes | 560 | 3.9 | |||
Turnout | 14,345 | 87.1 |
Party | Candidate | Votes | % | ±% | |
---|---|---|---|---|---|
Independent | 1. Martin Smith (elected) 2. Anna-Lisa Ryan | 6,977 | 50.1 | ||
Independent Liberal | 1. Christine Kay (elected) 2. Alexia Silver | 2,974 | 21.3 | ||
Independent Liberal/Independent joint ticket | 1. Henry Song (Ind. Lib) 2. Joseph Audet | 2,349 | 16.9 | ||
Independent Liberal/Independent joint ticket | 1. Amanda Brien (Ind. Lib) 2. David Howard | 1,640 | 11.8 | ||
Total formal votes | 13,940 | 94.7 | |||
Informal votes | 781 | 5.3 | |||
Turnout | 14,721 | 89.2 |
Party | Candidate | Votes | % | ±% | |
---|---|---|---|---|---|
Independent | 1. Kim Wheatley (elected) 2. Lisa Dixon | 3,767 | 27.9 | ||
Independent Liberal | 1. Cedric Spencer (elected) 2. Tony Pang | 2,934 | 21.7 | ||
Independent | 1. Sarah Beresford 2. Donna Greenfield | 2,203 | 16.3 | ||
Liberal Democrats | 1. Mitchell Strahan 2. Nathaniel Bryan | 1,840 | 13.6 | ||
Independent | 1. Sheri Evans 2. Anne Matheson | 1,660 | 12.3 | ||
Independent | 1. Adrienne McLean 2. Elizabeth McLean | 1,109 | 8.2 | ||
Total formal votes | 13,513 | 95.3 | |||
Informal votes | 671 | 4.7 | |||
Turnout | 14,184 | 87.4 |
Party | Candidate | Votes | % | ±% | |
---|---|---|---|---|---|
Liberal | 42,115 | 38.4 | +3.1 | ||
Labor | 41,732 | 38.1 | -2.6 | ||
Community Independents | 10,803 | 9.9 | -4.5 | ||
Independent | 7,504 | 6.8 | +2.8 | ||
Greens | 7,379 | 6.7 | +1.1 |
Party | Candidate | Votes | % | ±% | |
---|---|---|---|---|---|
Labor | 1. Nathan Hagarty (elected) 2. Ali Karnib (elected) 3. Loraine Usher 4. Ethan Monaghan 5. Christopher Stanley | 20,036 | 39.0 | ||
Liberal | 1. Hadid Mazhar (elected) 2. Mel Goodman (elected) 3. Paul Zadro 4. Courtney Nguyen 5. Tony Estephen | 17,892 | 34.8 | ||
Community Independents | 1. Peter Harle (elected) 2. Criss Moore 3. Marc Conners 4. Briana Jocic 5. Rayman Solagna | 5,713 | 11.1 | ||
Greens | 1. Avery Howard 2. Abdul Ayubi 3. Saad Salman 4. Suriani Ibrahim 5. Md Rashid | 4,506 | 8.8 | ||
Independent | 1. Milomir Andjelkovic 2. Natalija Ryan 3. Vasilije Bakovic 4. Marella Harris 5. Robert Pinosa | 3,198 | 6.2 | ||
Total formal votes | 51,345 | 90.3 | |||
Informal votes | 5,519 | 9.7 | |||
Turnout | 56,864 | 82.0 |
Party | Candidate | Votes | % | ±% |
---|
The Liberal Party did not endorse any candidates, including its six councillors elected in 2017. [44]
Party | Votes | % | Swing | Seats | Change | ||
---|---|---|---|---|---|---|---|
Labor | 46,022 | 41.5 | +10.3 | 7 | 2 | ||
Our Local Community | 21,476 | 19.4 | +12.3 | 4 | 2 | ||
Greens | 11,233 | 10.1 | +2.7 | 1 | |||
Lorraine Wearne Independents | 9,423 | 8.5 | +4.4 | 1 | |||
Independent Liberal | 6,310 | 5.7 | −30.8 [lower-alpha 6] | 1 | 5 [lower-alpha 6] | ||
Kellie Darley Independents | 4,637 | 4.2 | +4.2 | 1 | 1 | ||
Lee Malkoun Independents | 3,489 | 3.1 | −5.9 [lower-alpha 7] | 0 | [lower-alpha 7] | ||
Small Business | 3,126 | 2.8 | +2.8 | 0 | |||
Liberal Democrats | 2,161 | 2.0 | +2.0 | 0 | |||
Independent | 1,882 | 1.7 | 0 | ||||
Community Need Not Corporate Greed | 1,026 | 0.9 | +0.9 | 0 | |||
Formal votes | 110,785 | 95.23 | |||||
Informal votes | 5,547 | 4.77 | |||||
Total | 116,332 | 100.0 |
Elected councillor | Party | |
---|---|---|
Pierre Esber | Labor | |
Michelle Garrard | OLC | |
Kellie Darley | Kellie Darley Inds |
Party | Candidate | Votes | % | ±% | |
---|---|---|---|---|---|
Labor | 8,278 | 37.5 | |||
Our Local Community | 5,672 | 25.7 | |||
Kellie Darley Independents | 4,637 | 21.0 | +21.0 | ||
Lee Malkoun Independents | 3,489 | 15.8 | +1.9 [lower-alpha 7] | ||
Total formal votes | 22,076 | 94.33 | |||
Informal votes | 1,327 | 5.67 | |||
Turnout | 23,403 | 83.55 |
Elected councillor | Party | |
---|---|---|
Donna Davis | Labor | |
Lorraine Wearne | Lorraine Wearne Inds | |
Cameron Maclean | Labor |
Party | Candidate | Votes | % | ±% | |
---|---|---|---|---|---|
Labor | 12,156 | 51.8 | |||
Lorraine Wearne Independents | 9,423 | 40.2 | |||
Independent | Jean Pierre Abood | 1,882 | 8.0 | ||
Total formal votes | 23,461 | 95.49 | |||
Informal votes | 1,108 | 4.51 | |||
Turnout | 24,569 | 87.93 |
Elected councillor | Party | |
---|---|---|
Angela Humphries | Labor | |
Georgina Valjak | Ind. Liberal | |
Donna Wang | OLC |
Party | Candidate | Votes | % | ±% | |
---|---|---|---|---|---|
Labor | 7,541 | 33.5 | |||
Independent Liberal | 6,310 | 28.0 | −20.2 [lower-alpha 6] | ||
Our Local Community | 5,528 | 24.5 | |||
Greens | 3,146 | 14.0 | |||
Total formal votes | 22,525 | 95.95 | |||
Informal votes | 949 | 4.04 | |||
Turnout | 23,474 | 87.52 |
Elected councillor | Party | |
---|---|---|
Sameer Pandey | Labor | |
Henry Green | OLC | |
Phil Bradley | Greens |
Party | Candidate | Votes | % | ±% | |
---|---|---|---|---|---|
Labor | 8,412 | 41.2 | |||
Our Local Community | 5,749 | 28.1 | |||
Greens | 4,118 | 20.1 | |||
Liberal Democrats | 2,161 | 10.6 | +10.6 | ||
Total formal votes | 20,440 | 94.71 | |||
Informal votes | 1,141 | 5.29 | |||
Turnout | 21,581 | 80.98 |
Elected councillor | Party | |
---|---|---|
Patricia Prociv | Labor | |
Dan Siviero | OLC | |
Paul Noack | Labor |
Party | Candidate | Votes | % | ±% | |
---|---|---|---|---|---|
Labor | 9,635 | 43.2 | |||
Our Local Community | 4,527 | 20.3 | |||
Greens | 3,969 | 17.8 | |||
Small Business | 3,126 | 14.0 | +14.0 | ||
Community Need Not Corporate Greed | 1,026 | 4.6 | +4.6 | ||
Total formal votes | 22,283 | 95.61 | |||
Informal votes | 1,022 | 4.39 | |||
Turnout | 23,305 | 78.53 |
The election was conducted by the Australian Election Company. [47]
Party | Votes | % | Swing | Seats | Change | ||
---|---|---|---|---|---|---|---|
Labor | 36,376 | 34.5 | –6.2 | 5 | |||
Liberal | 35,081 | 33.3 | +2.9 | 6 | |||
Independent | 10,336 | 9.8 | |||||
Sue Day Independent | 6,859 | 6.5 | 1 | ||||
The North Ward Independents | 5,820 | 5.5 | 1 | ||||
MARCUS CORNISH | 3,868 | 3.7 | |||||
WE DESERVE BETTER | 3,073 | 2.9 | 1 | ||||
Australia First | 2,549 | 2.4 | +2.4 | ||||
People Before Politics | 1,534 | 1.5 | |||||
Formal votes | 105,496 |
Elected councillor | Party | |
---|---|---|
Bernard Bratusa | Liberal | |
Tricia Hitchen | Liberal | |
Todd Carney | Labor | |
Robin Cook | Labor | |
Marlene Shipley | WE DESERVE BETTER |
Party | Candidate | Votes | % | ±% | |
---|---|---|---|---|---|
Labor | 13,227 | 39.9 | |||
Liberal | 10,456 | 31.5 | |||
WE DESERVE BETTER | 3,073 | 9.3 | |||
Australia First | 2,549 | 7.7 | |||
Independent | 2,330 | 7.0 | |||
People Before Politics | 1,534 | 4.6 | |||
Total formal votes | 33,169 |
Elected councillor | Party | |
---|---|---|
Ross Fowler | Liberal | |
Glenn Gardiner | Liberal | |
John Thain | Labor | |
Jonathan Pullen | Labor | |
Kevin Crameri | North Ward Inds |
Party | Candidate | Votes | % | ±% | |
---|---|---|---|---|---|
Labor | 12,455 | 33.8 | |||
Liberal | 12,207 | 33.2 | |||
The North Ward Independents | 5,820 | 15.8 | |||
MARCUS CORNISH | 3,868 | 10.5 | |||
Independent | 2,455 | 6.7 | |||
Total formal votes | 36,805 | 72.7 |
Elected councillor | Party | |
---|---|---|
Mark Davies | Liberal | |
Mark Rusev | Liberal | |
Karen McKeown | Labor | |
Sue Day | Sue Day | |
Jim Aitken | Independent |
Party | Candidate | Votes | % | ±% | |
---|---|---|---|---|---|
Liberal | 12,418 | 35.0 | |||
Labor | 10,694 | 30.1 | |||
Sue Day Independent | 6,859 | 19.3 | |||
Independent | 5,441 | 15.3 | |||
Independent | Abigail Nash | 110 | 0.3 | ||
Total formal votes | 35,522 | 74.8 |
Party | Candidate | Votes | % | ±% | |
---|---|---|---|---|---|
Team Clover | 1. Clover Moore 2. Jess Scully (elected 1) 3. Robert Kok (elected 5) 4. Emelda Davis (elected 6) 5. William Chan (elected 7) 6. Adam Worling 7. Mike Galvin 8. Elaine Czulkowski 9. Philip Thalis 10. Jess Miller | 47,877 | 40.8 | −14.13 | |
Liberal | 1. Shauna Jarrett (elected 2) 2. Lyndon Gannon (elected 8) 3. Sam Danieli 4. Phyllisse Stanton 5. Richard Hicklin 6. Ricky Lee | 20,432 | 17.4 | −2.3 | |
Labor | 1. Linda Scott (elected 4) 2. Damien Minton 3. Norma Ingram 4. Tamira Stevensen 5. Tony Pooley 6. Meagan Lawson 7. Ian Roberts 8. Frier Bentley | 18,077 | 14.7 | +3.07 | |
Greens | 1. Sylvie Ellsmore (elected 3) 2. Dejay Toborek 3. Caroline Alcorso 4. Chetan Sahai 5. Mark Smith | 12,972 | 11.1 | +5.12 | |
Unite for Sydney | 1. Yvonne Weldon (elected 9) 2. Karen Freyer 3. Stephen Conlon 4. Meead Saberi Kalaee 5. Kiran De Silva 6. Mark Hodge | 10,577 | 9.0 | +9.0 | |
Small Business | 1. Angela Vithoulkas 2. Paul Crossin 3. Tatiana Coulter 4. Phillip Joel 5. Allan Sudale 5. Lisa Jayne 7. Nicole Santer | 7,219 | 6.2 | −1.15 [lower-alpha 8] | |
Independent | Wen Zhou | 133 | 0.1 | ||
Independent | John McFadden | 75 | 0.1 | ||
Total formal votes | 118,511 | 98.6 | |||
Informal votes | 1,675 | 1.4 | |||
Turnout | 120,186 | 68.7 | |||
Party total seats | Seats | ± | |||
Team Clover | 4 | 1 | |||
Liberal | 2 | ||||
Labor | 1 | ||||
Greens | 1 | 1 | |||
Independent | 1 | 1 | |||
Small Business | 0 | 1 |
The City of Parramatta, also known as Parramatta Council, is a local government area located to the west and north-west of Sydney CBD in the Greater Western Sydney region. Parramatta Council is situated between the City of Ryde and Cumberland, where the Cumberland Plain meets the Hornsby Plateau, approximately 25 kilometres (16 mi) west of the Sydney central business district, in New South Wales, Australia. The city occupies an area of 84 square kilometres (32 sq mi) spanning across suburbs in Greater Western Sydney including the Hills District, and a small section of Northern Sydney to the far north east of its area. According to the 2016 census, City of Parramatta had an estimated population of 226,149. The city houses the Parramatta central business district which is one of the key suburban employment destinations for the region of Greater Western Sydney.
Maxwell Shayne Mallard is an Australian politician. He was a Liberal Party member of the New South Wales Legislative Council from 2015 until 2023. He was formerly a councillor of the City of South Sydney from 2000 to 2004, and of the City of Sydney from 2004 to 2012.
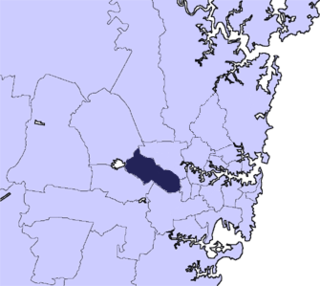
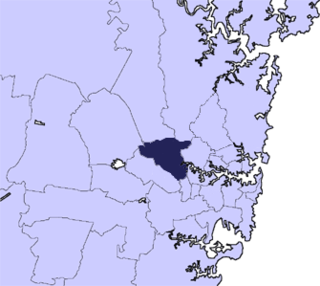
Cumberland Council, trading as Cumberland City Council, is a local government area located in the western suburbs of Sydney in the state of New South Wales, Australia. The Council was formed on 12 May 2016 from the merger of parts of the Cities of Auburn, Parramatta, and Holroyd.
Central Ward is a Brisbane City Council ward covering the CBD, Fortitude Valley, New Farm, Spring Hill, Herston, Bowen Hills, Newstead and Teneriffe. The current councillor is Vicki Howard of the Liberal National Party, who gained the ward from Labor at the 2012 election.
Dai Trang Le is a Vietnamese-born Australian politician currently serving as the federal member for Fowler and councillor for Fairfield/Cabravale Ward.
Francesco Giuseppe Carbone is an Australian politician. He has served as mayor of Fairfield in New South Wales since 2012.
The 2021 New South Wales local elections were held on 4 December 2021 to elect the councils of 121 of the 128 local government areas (LGAs) in New South Wales. Several councils also held mayoral elections and/or referendums.
Western Sydney Community (WSC), officially known as Dai Le & Frank Carbone W.S.C., is an Australian political party founded in 2023 by independent MP Dai Le and Fairfield mayor Frank Carbone. The party plans to contest electorates in the Greater Western Sydney region at the next federal election.
The 2017 New South Wales local elections were held on 9 September 2017 to elect the councils of 46 of the 128 local government areas (LGAs) in New South Wales. Several councils also held mayoral elections and/or referendums.
The 2024 New South Wales local elections were held on 14 September 2024 to elect the councils of 127 of the 128 local government areas (LGAs) in New South Wales, Australia. 37 councils also held mayoral elections, and eight councils conducted referendums.
The 2024 Victorian local elections will be held in October 2024 to elect the councils of 78 of the 79 local government areas (LGAs) in Victoria, Australia.
The 2021 New South Wales mayoral elections were held on 4 December 2021 to elect mayors or lord mayors to 35 of the 128 local government areas (LGAs) in New South Wales. The elections were held as part of the statewide local elections.
The 2021 South Gippsland Shire Council election was held in October 2021 to elect nine councillors for South Gippsland Shire, a local government area (LGA) in Victoria, Australia.
Shire Watch Independents (SWI), also known simply as Shire Watch, was an Australian political party that contested local government elections for Sutherland Shire in New South Wales.
This is a list of results for the 2024 New South Wales local elections in the Greater Sydney region, including the Central Coast.
This is a list of results for the 2024 New South Wales local elections in the Illawarra region.
The Shoalhaven Independents Group (SIG), also known simply as the Shoalhaven Independents, is an Australian political party that contests local government elections for Shoalhaven City Council in New South Wales.
The 2024 Central Coast Council election was held on 14 September 2024 to elect 15 councillors to Central Coast Council as part of the statewide local government elections in New South Wales, Australia.
The 2017 Central Coast Council election was held on 9 September 2017 to elect 15 councillors to Central Coast Council. The election was held as part of the statewide local government elections in New South Wales, Australia.
He was also runner up at the last elections in 2021, where Cumberland Council elected a Labor majority with two Independent Liberals.
Labor again won eight seats in 2021, with the Our Local Community party (including former Labor councillor Steve Christou) as the main opposition, winning four seats. Two independent Liberals were re-elected, as was former Labor councillor Greg Cummings.
He was also runner up at the last elections in 2021, where Cumberland Council elected a Labor majority with two Independent Liberals.
I am a member of [...] the Liberal Party of Australia NSW Division