
SPSS Statistics is a software package used for interactive, or batched, statistical analysis. Long produced by SPSS Inc., it was acquired by IBM in 2009. The current versions (2015) are named IBM SPSS Statistics.
Statistical process control (SPC) is a method of quality control which employs statistical methods to monitor and control a process. This helps to ensure that the process operates efficiently, producing more specification-conforming products with less waste. SPC can be applied to any process where the "conforming product" output can be measured. Key tools used in SPC include run charts, control charts, a focus on continuous improvement, and the design of experiments. An example of a process where SPC is applied is manufacturing lines.
X-12-ARIMA was the U.S. Census Bureau's software package for seasonal adjustment.
Statgraphics is a statistics package that performs and explains basic and advanced statistical functions. The software was created in 1980 by Dr. Neil Polhemus while working as a professor of statistics at Princeton University. The current version of the program, Statgraphics Centurion 18, was released in fall 2017. Version 18, available in both 32-bit and 64-bit editions, is available in five languages: English, French, Spanish, German and Italian.

A Pareto chart is a type of chart that contains both bars and a line graph, where individual values are represented in descending order by bars, and the cumulative total is represented by the line. It is named after the Pareto principle, which is named for the Italian economist Vilfredo Pareto.
Analyse-it is a statistical analysis add-in for Microsoft Excel. Analyse-it is the successor to Astute, developed in 1992 for Excel 4 and the first statistical analysis add-in for Microsoft Excel. Analyse-it provides a range of standard parametric and non-parametric procedures, including Descriptive statistics, ANOVA, ANCOVA, Mann–Whitney, Wilcoxon, chi-square, correlation, linear regression, logistic regression, polynomial regression and advanced model fitting, principal component analysis, and factor analysis.
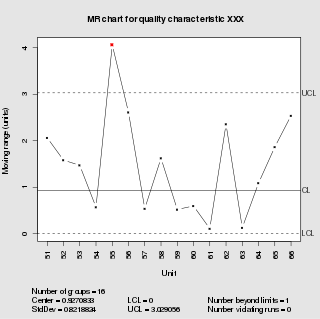
In statistical quality control, the individual/moving-range chart is a type of control chart used to monitor variables data from a business or industrial process for which it is impractical to use rational subgroups.
Data Desk is a software program for visual data analysis, visual data exploration, and statistics. It carries out Exploratory Data Analysis (EDA) and standard statistical analyses by means of dynamically linked graphic data displays that update any change simultaneously.
RExcel is an addin for Microsoft Excel. It allows access to the statistics package R from within Excel.

Numerical Analysis for Excel (NumXL) is an econometrics and time series analysis add-in for Microsoft Excel. Developed by Spider Financial, NumXL provides a wide variety of statistical and time series analysis techniques, including linear and nonlinear time series modeling, statistical tests and others.

SOFA Statistics is an open-source statistical package. The name stands for Statistics Open For All. It has a graphical user interface and can connect directly to MySQL, PostgreSQL, SQLite, MS Access (mdb), and Microsoft SQL Server. Data can also be imported from CSV and Tab-Separated files or spreadsheets. The main statistical tests available are Independent and Paired t-tests, Wilcoxon signed ranks, Mann–Whitney U, Pearson's chi squared, Kruskal Wallis H, one-way ANOVA, Spearman's R, and Pearson's R. Nested tables can be produced with row and column percentages, totals, sd, mean, median, lower and upper quartiles, and sum.
SHAZAM is a comprehensive econometrics and statistics package for estimating, testing, simulating and forecasting many types of econometrics and statistical models. SHAZAM was originally created in 1977 by Kenneth White.
Software Publishing Corporation (SPC) was a Mountain View, California-based manufacturer of business software, originally well known for its "pfs:" series of business software products, it was ultimately best known for its pioneering Harvard Graphics business and presentation graphics program.

SigmaXL is a graphical and statistical add-in tool for Microsoft Excel.
The following is a comparison of various add-in packages available to do Monte Carlo probabilistic modeling and risk analysis. Add-ins covered are for Microsoft Excel on Windows. Mac software and tools for other platforms, such as R or Matlab are not included.

