Related Research Articles
Reverse Polish notation (RPN), also known as reverse Łukasiewicz notation, Polish postfix notation or simply postfix notation, is a mathematical notation in which operators follow their operands, in contrast to Polish notation (PN), in which operators precede their operands. It does not need any parentheses as long as each operator has a fixed number of operands. The description "Polish" refers to the nationality of logician Jan Łukasiewicz, who invented Polish notation in 1924.
Maple is a symbolic and numeric computing environment as well as a multi-paradigm programming language. It covers several areas of technical computing, such as symbolic mathematics, numerical analysis, data processing, visualization, and others. A toolbox, MapleSim, adds functionality for multidomain physical modeling and code generation.

SPSS Statistics is a statistical software suite developed by IBM for data management, advanced analytics, multivariate analysis, business intelligence, criminal investigation. Long produced by SPSS Inc., it was acquired by IBM in 2009. Current versions have the brand name: IBM SPSS Statistics.
This comparison of free software for audio lists notable free and open source software for use by sound engineers, audio producers, and those involved in sound recording and reproduction.
R is a programming language for statistical computing and graphics supported by the R Core Team and the R Foundation for Statistical Computing. Created by statisticians Ross Ihaka and Robert Gentleman, R is used among data miners, bioinformaticians and statisticians for data analysis and developing statistical software. Users have created packages to augment the functions of the R language.
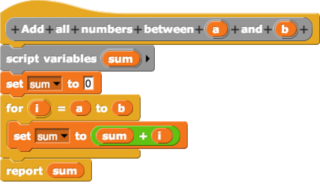
In computing, a visual programming language is any programming language that lets users create programs by manipulating program elements graphically rather than by specifying them textually. A VPL allows programming with visual expressions, spatial arrangements of text and graphic symbols, used either as elements of syntax or secondary notation. For example, many VPLs are based on the idea of "boxes and arrows", where boxes or other screen objects are treated as entities, connected by arrows, lines or arcs which represent relations.
This is an alphabetical list of articles pertaining specifically to software engineering.
Genstat is a statistical software package with data analysis capabilities, particularly in the field of agriculture.

MedCalc is a statistical software package designed for the biomedical sciences. It has an integrated spreadsheet for data input and can import files in several formats.
Multilevel models are statistical models of parameters that vary at more than one level. An example could be a model of student performance that contains measures for individual students as well as measures for classrooms within which the students are grouped. These models can be seen as generalizations of linear models, although they can also extend to non-linear models. These models became much more popular after sufficient computing power and software became available.
A mixed model, mixed-effects model or mixed error-component model is a statistical model containing both fixed effects and random effects. These models are useful in a wide variety of disciplines in the physical, biological and social sciences. They are particularly useful in settings where repeated measurements are made on the same statistical units, or where measurements are made on clusters of related statistical units. Because of their advantage in dealing with missing values, mixed effects models are often preferred over more traditional approaches such as repeated measures analysis of variance.
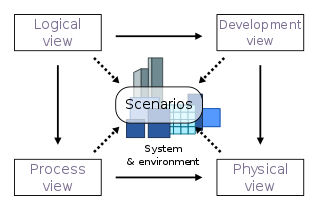
4+1 is a view model used for "describing the architecture of software-intensive systems, based on the use of multiple, concurrent views". The views are used to describe the system from the viewpoint of different stakeholders, such as end-users, developers, system engineers, and project managers. The four views of the model are logical, development, process and physical view. In addition, selected use cases or scenarios are used to illustrate the architecture serving as the 'plus one' view. Hence, the model contains 4+1 views:
Harvey Goldstein was a British statistician known for his contributions to multilevel modelling methodology and software, and for applying this to educational assessment and league tables.
3D Slicer (Slicer) is a free and open source software package for image analysis and scientific visualization. Slicer is used in a variety of medical applications, including autism, multiple sclerosis, systemic lupus erythematosus, prostate cancer, lung cancer, breast cancer, schizophrenia, orthopedic biomechanics, COPD, cardiovascular disease and neurosurgery.
In statistics, multivariate adaptive regression splines (MARS) is a form of regression analysis introduced by Jerome H. Friedman in 1991. It is a non-parametric regression technique and can be seen as an extension of linear models that automatically models nonlinearities and interactions between variables.
Psychometric software is software that is used for psychometric analysis of data from tests, questionnaires, or inventories reflecting latent psychoeducational variables. While some psychometric analyses can be performed with standard statistical software like SPSS, most analyses require specialized tools.
One application of multilevel modeling (MLM) is the analysis of repeated measures data. Multilevel modeling for repeated measures data is most often discussed in the context of modeling change over time ; however, it may also be used for repeated measures data in which time is not a factor.
Pyomo is a collection of Python software packages for formulating optimization models.
References
- ↑ MLwiN homepage. Centre for Multilevel Modelling, University of Bristol.
- ↑ Goldstein, Harvey; Browne, William; Rasbash, Jonathan (2002). "Multilevel modelling of medical data". Statistics in Medicine. 21 (21): 3291–3315. CiteSeerX 10.1.1.128.5952 . doi:10.1002/sim.1264. PMID 12375305.