CumFreq

Last updated

CumFreq
FitWeibullDistr.tif
Example of output graph
Developer(s) Institute for Land Reclamation and Improvement (ILRI)
Written in Delphi
Operating system Microsoft Windows
Available inEnglish
Type Statistical software
License Proprietary Freeware
Website CumFreq

In statistics and data analysis the application software CumFreq is a tool for cumulative frequency analysis of a single variable and for probability distribution fitting. [1]

Contents

Originally the method was developed for the analysis of hydrological measurements of spatially varying magnitudes (e.g. hydraulic conductivity of the soil) and of magnitudes varying in time (e.g. rainfall, river discharge) to find their return periods. However, it can be used for many other types of phenomena, including those that contain negative values.

Software features

Screenprint of input tabsheet CumFreqInput.jpg
Screenprint of input tabsheet

CumFreq uses the plotting position approach to estimate the cumulative frequency of each of the observed magnitudes in a data series of the variable. [2]

The computer program allows determination of the best fitting probability distribution. Alternatively it provides the user with the option to select the probability distribution to be fitted. The following probability distributions are included: normal, lognormal, logistic, loglogistic, exponential, Cauchy, Fréchet, Gumbel, Pareto, Weibull, Generalized extreme value distribution, Laplace distribution, Burr distribution (Dagum mirrored), Dagum distribution (Burr mirrored), Gompertz distribution, Student distribution and other.

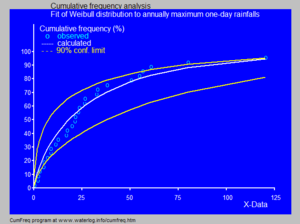
Another characteristic of CumFreq is that it provides the option to use two different probability distributions, one for the lower data range, and one for the higher. The ranges are separated by a break-point. The use of such composite (discontinuous) probability distributions can be useful when the data of the phenomenon studied were obtained under different conditions. [3]

Composite (discontinuous) distribution with confidence belt SanLor.jpg
Composite (discontinuous) distribution with confidence belt

During the input phase, the user can select the number of intervals needed to determine the histogram. He may also define a threshold to obtain a truncated distribution.

The output section provides a calculator to facilitate interpolation and extrapolation.

Further it gives the option to see the Q–Q plot in terms of calculated and observed cumulative frequencies.

ILRI [5] provides examples of application to magnitudes like crop yield, watertable depth, soil salinity, hydraulic conductivity, rainfall, and river discharge.

Generalizing distributions

The program can produce generalizations of the normal, logistic, and other distributions by transforming the data using an exponent that is optimized to obtain the best fit.

This feature is not common in other distribution-fitting software which normally include only a logarithmic transformation of data obtaining distributions like the lognormal and loglogistic.

Generalization of symmetrical distributions (like the normal and the logistic) makes them applicable to data obeying a distribution that is skewed to the right (using an exponent <1) as well as to data obeying a distribution that is skewed to the left (using an exponent >1). This enhances the versatility of symmetrical distributions.

(A) Gumbel probability distribution skew to right and (B) Gumbel mirrored skew to left Gumbel distribution and Gumbel mirrored.png
(A) Gumbel probability distribution skew to right and (B) Gumbel mirrored skew to left

Inverting distributions

Skew distributions can be mirrored by distribution inversion (see survival function, or complementary distribution function) to change the skewness from positive to negative and vice versa. This amplifies the number of applicable distributions and increases the chance of finding a better fit. CumFreq makes use of that opportunity.

Shifting distributions

When negative data are present that are not supported by a probability distribution, the model performs a distribution shift to the positive side while, after fitting, the distribution is shifted back.

Nine return period curves of 50-year samples from a theoretical 1000-year record (base line) SampleFreqCurves.tif
Nine return period curves of 50-year samples from a theoretical 1000-year record (base line)

Confidence belts

The software employs the binomial distribution to determine the confidence belt of the corresponding cumulative distribution function. [2]

The prediction of the return period, which is of interest in time series, is also accompanied by a confidence belt. The construction of confidence belts is not found in most other software.

The figure to the right shows the variation that may occur when obtaining samples of a variate that follows a certain probability distribution. The data were provided by Benson. [6]

List of probability distributions ranked by goodness of fit, example CumList.png
List of probability distributions ranked by goodness of fit, example

The confidence belt around an experimental cumulative frequency or return period curve gives an impression of the region in which the true distribution may be found.

Also, it clarifies that the experimentally found best fitting probability distribution may deviate from the true distribution.

Histogram and probability density of a data set fitting the GEV distribution GEVdistrHistogr+Density.png
Histogram and probability density of a data set fitting the GEV distribution

Goodness of fit

Cumfreq produces a list of distributions ranked by goodness of fit.

Histogram and density function

From the cumulative distribution function (CDF) one can derive a histogram and the probability density function (PDF).

Calculator

Probability distribution calculator as used in the CumFreq software CumCalc.png
Probability distribution calculator as used in the CumFreq software

The software offers the option to use a probability distribution calculator. The cumulative frequency and the return period are give as a function of data value as input. In addition, the confidence intervals are shown. Reversely, the value is presented upon giving the cumulative frequency or the return period.

See also

Related Research Articles

Histogram Graphical representation of the distribution of numerical data

A histogram is an approximate representation of the distribution of numerical data. It was first introduced by Karl Pearson. To construct a histogram, the first step is to "bin" the range of values—that is, divide the entire range of values into a series of intervals—and then count how many values fall into each interval. The bins are usually specified as consecutive, non-overlapping intervals of a variable. The bins (intervals) must be adjacent and are often of equal size.

Power law Functional relationship between two quantities

In statistics, a power law is a functional relationship between two quantities, where a relative change in one quantity results in a proportional relative change in the other quantity, independent of the initial size of those quantities: one quantity varies as a power of another. For instance, considering the area of a square in terms of the length of its side, if the length is doubled, the area is multiplied by a factor of four.

Statistics is a field of inquiry that studies the collection, analysis, interpretation, and presentation of data. It is applicable to a wide variety of academic disciplines, from the physical and social sciences to the humanities; it is also used and misused for making informed decisions in all areas of business and government.

Log-normal distribution Probability distribution

In probability theory, a log-normal distribution is a continuous probability distribution of a random variable whose logarithm is normally distributed. Thus, if the random variable X is log-normally distributed, then Y = ln(X) has a normal distribution. Equivalently, if Y has a normal distribution, then the exponential function of Y, X = exp(Y), has a log-normal distribution. A random variable which is log-normally distributed takes only positive real values. It is a convenient and useful model for measurements in exact and engineering sciences, as well as medicine, economics and other topics.

In statistics, a frequency distribution is a list, table or graph that displays the frequency of various outcomes in a sample. Each entry in the table contains the frequency or count of the occurrences of values within a particular group or interval.

Gumbel distribution Particular case of the generalized extreme value distribution

In probability theory and statistics, the Gumbel distribution is used to model the distribution of the maximum of a number of samples of various distributions.

Logistic distribution Continuous probability distribution

In probability theory and statistics, the logistic distribution is a continuous probability distribution. Its cumulative distribution function is the logistic function, which appears in logistic regression and feedforward neural networks. It resembles the normal distribution in shape but has heavier tails. The logistic distribution is a special case of the Tukey lambda distribution.

Normal probability plot Graphical technique in statistics

The normal probability plot is a graphical technique to identify substantive departures from normality. This includes identifying outliers, skewness, kurtosis, a need for transformations, and mixtures. Normal probability plots are made of raw data, residuals from model fits, and estimated parameters.

Density estimation

In probability and statistics, density estimation is the construction of an estimate, based on observed data, of an unobservable underlying probability density function. The unobservable density function is thought of as the density according to which a large population is distributed; the data are usually thought of as a random sample from that population.

Laplace distribution

In probability theory and statistics, the Laplace distribution is a continuous probability distribution named after Pierre-Simon Laplace. It is also sometimes called the double exponential distribution, because it can be thought of as two exponential distributions spliced together back-to-back, although the term is also sometimes used to refer to the Gumbel distribution. The difference between two independent identically distributed exponential random variables is governed by a Laplace distribution, as is a Brownian motion evaluated at an exponentially distributed random time. Increments of Laplace motion or a variance gamma process evaluated over the time scale also have a Laplace distribution.

In probability theory and statistics, the generalized extreme value (GEV) distribution is a family of continuous probability distributions developed within extreme value theory to combine the Gumbel, Fréchet and Weibull families also known as type I, II and III extreme value distributions. By the extreme value theorem the GEV distribution is the only possible limit distribution of properly normalized maxima of a sequence of independent and identically distributed random variables. Note that a limit distribution needs to exist, which requires regularity conditions on the tail of the distribution. Despite this, the GEV distribution is often used as an approximation to model the maxima of long (finite) sequences of random variables.

Probit Mathematical function, inverse of error function

In probability theory and statistics, the probit function is the quantile function associated with the standard normal distribution. It has applications in data analysis and machine learning, in particular exploratory statistical graphics and specialized regression modeling of binary response variables.

In probability theory and statistics, a shape parameter is a kind of numerical parameter of a parametric family of probability distributions.

Log-logistic distribution

In probability and statistics, the log-logistic distribution is a continuous probability distribution for a non-negative random variable. It is used in survival analysis as a parametric model for events whose rate increases initially and decreases later, as, for example, mortality rate from cancer following diagnosis or treatment. It has also been used in hydrology to model stream flow and precipitation, in economics as a simple model of the distribution of wealth or income, and in networking to model the transmission times of data considering both the network and the software.

The survival function is a function that gives the probability that a patient, device, or other object of interest will survive past a certain time.

Probability distribution fitting or simply distribution fitting is the fitting of a probability distribution to a series of data concerning the repeated measurement of a variable phenomenon.

Cumulative frequency analysis

Cumulative frequency analysis is the analysis of the frequency of occurrence of values of a phenomenon less than a reference value. The phenomenon may be time- or space-dependent. Cumulative frequency is also called frequency of non-exceedance.

Quantile-parameterized distributions (QPDs) are probability distributions that are directly parameterized by data. They were motivated by the need for easy-to-use continuous probability distributions flexible enough to represent a wide range of uncertainties, such as those commonly encountered in business, economics, engineering, and science. Because QPDs are directly parameterized by data, they have the practical advantage of avoiding the intermediate step of parameter estimation, a time-consuming process that typically requires non-linear iterative methods to estimate probability-distribution parameters from data. Some QPDs have virtually unlimited shape flexibility and closed-form moments as well.

Metalog distribution

The metalog distribution is a flexible continuous probability distribution designed for ease of use in practice. Together with its transforms, the metalog family of continuous distributions is unique because it embodies all of following properties: virtually unlimited shape flexibility; a choice among unbounded, semi-bounded, and bounded distributions; ease of fitting to data with linear least squares; simple, closed-form quantile function equations that facilitate simulation; a simple, closed-form PDF; and Bayesian updating in closed form in light of new data. Moreover, like a Taylor series, metalog distributions may have any number of terms, depending on the degree of shape flexibility desired and other application needs.

References

  1. Independent online review of CumFreq: https://www.predictiveanalyticstoday.com/cumfreq/
  2. 1 2 Frequency and Regression Analysis. Chapter 6 in: H.P.Ritzema (ed., 1994), Drainage Principles and Applications, Publ. 16, pp. 175–224, International Institute for Land Reclamation and Improvement (ILRI), Wageningen, The Netherlands. ISBN   90-70754-33-9 . Free download as PDF from : ILRI website or from :
  3. Software for Generalized and Composite Probability Distributions. International Journal of Mathematical and Computational Methods, 4, 1-9. On line:
  4. Intro to composite probability distributions
  5. Drainage research in farmers' fields: analysis of data, 2002. Contribution to the project "Liquid Gold" of the International Institute for Land Reclamation and Improvement (ILRI), Wageningen, The Netherlands.
  6. Benson, M.A. 1960. Characteristics of frequency curves based on a theoretical 1000 year record. In: T.Dalrymple (ed.), Flood frequency analysis. U.S. Geological Survey Water Supply paper 1543−A, pp. 51–71
  7. Software for probability distribution fitting