San Miguel | |
|---|---|
| Municipality of San Miguel | |
 Flag  Seal | |
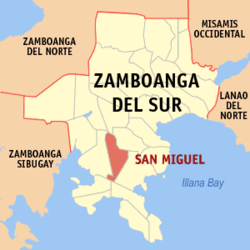 Map of Zamboanga del Sur with San Miguel highlighted | |
OpenStreetMap  | |
 San Miguel Location within the Philippines | |
| Coordinates: 7°39′00″N123°16′04″E / 7.65°N 123.2677778°E | |
| Country | Philippines |
| Region | Zamboanga Peninsula |
| Province | Zamboanga del Sur |
| District | 2nd district |
| Founded | July 14, 1960 |
| Barangays | 18 (see Barangays) |
| Government | |
| • Type | Sangguniang Bayan |
| • Mayor | Ex D. Ocapan |
| • Vice Mayor | Wilma D. Ocapan |
| • Representative | Jeyzel Victoria C. Yu |
| • Municipal Council | Members |
| • Electorate | 15,281 voters (2025) |
| Area | |
• Total | 181.59 km2 (70.11 sq mi) |
| Elevation | 271 m (889 ft) |
| Highest elevation | 727 m (2,385 ft) |
| Lowest elevation | 101 m (331 ft) |
| Population (2024 census) [3] | |
• Total | 20,037 |
| • Density | 110/km2 (290/sq mi) |
| • Households | 4,469 |
| Economy | |
| • Income class | 4th municipal income class |
| • Poverty incidence | 31.92 |
| • Revenue | ₱ 164.8 million (2022) |
| • Assets | ₱ 360.5 million (2022) |
| • Expenditure | ₱ 117.1 million (2022) |
| • Liabilities | ₱ 80.56 million (2022) |
| Service provider | |
| • Electricity | Zamboanga del Sur 1 Electric Cooperative (ZAMSURECO 1) |
| Time zone | UTC+8 (PST) |
| ZIP code | 7029 |
| PSGC | |
| IDD : area code | +63 (0)62 |
| Native languages | Subanon Cebuano Chavacano Tagalog |
| Website | sanmiguelzds |
San Miguel, officially the Municipality of San Miguel (Cebuano : Lungsod sa San Miguel; Subanen: Benwa San Miguel; Chavacano: Municipalidad de San Miguel; Tagalog : Bayan ng San Miguel), is a municipality in the province of Zamboanga del Sur, Philippines. According to the 2020 census, it has a population of 19,838 people. [5]