San Pascual | |
|---|---|
| Municipality of San Pascual | |
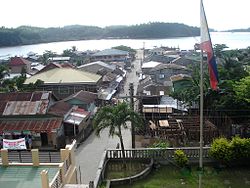 Downtown area | |
 Flag | |
 Map of Masbate with San Pascual highlighted | |
 Interactive map of San Pascual | |
 San Pascual Location within the Philippines | |
| Coordinates: 13°07′43″N122°58′39″E / 13.1286°N 122.9775°E | |
| Country | Philippines |
| Region | Bicol Region |
| Province | Masbate |
| District | 1st district |
| Barangays | 22 (see Barangays) |
| Government | |
| • Type | Sangguniang Bayan |
| • Mayor | Niño Maximino A. Lazaro |
| • Vice Mayor | Haira L. Rivera |
| • Representative | Narciso R. Bravo Jr. |
| • Municipal Council | Members |
| • Electorate | 32,674 voters (2025) |
| Area | |
• Total | 246.65 km2 (95.23 sq mi) |
| Elevation | 47.5 m (156 ft) |
| Highest elevation | 414 m (1,358 ft) |
| Lowest elevation | 0 m (0 ft) |
| Population (2024 census) [4] | |
• Total | 44,641 |
| • Density | 180.99/km2 (468.76/sq mi) |
| • Households | 10,102 |
| Economy | |
| • Income class | 3rd municipal income class |
| • Poverty incidence | 34.39 |
| • Revenue | ₱ 264.9 million (2022) |
| • Assets | ₱ 751.2 million (2022) |
| • Expenditure | ₱ 215.5 million (2022) |
| • Liabilities | ₱ 213.5 million (2022) |
| Service provider | |
| • Electricity | Masbate Electric Cooperative (MASELCO) |
| Time zone | UTC+8 (PST) |
| ZIP code | 5420 |
| PSGC | |
| IDD : area code | +63 (0)56 |
| Native languages | Central Bikol Tagalog |
| Website | www |
San Pascual, officially the Municipality of San Pascual, is a municipality in the province of Masbate, Philippines. According to the 2024 census, it has a population of 44,641 people. [6]
Contents
- Geography
- Barangays
- Climate
- Demographics
- Economy
- Tourism
- Education
- Primary and elementary schools
- Secondary schools
- Gallery
- References
- External links
In addition to the northern part of Burias Island, the islands of Busing, Templo (or Iniwaran,) and another six small unpopulated islands belong to the municipality.