Stock and flow

Last updated
Stock vs. flow Stocks and Flows.svg
Stock vs. flow
Dynamic stock and flow diagram StockFlow.gif
Dynamic stock and flow diagram

Economics, business, accounting, and related fields often distinguish between quantities that are stocks and those that are flows. These differ in their units of measurement. A stock is measured at one specific time, and represents a quantity existing at that point in time (say, December 31, 2004), which may have accumulated in the past. A flow variable is measured over an interval of time. Therefore, a flow would be measured per unit of time (say a year). Flow is roughly analogous to rate or speed in this sense.

Contents

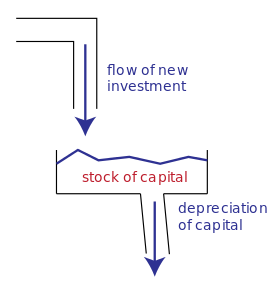
For example, U.S. nominal gross domestic product refers to a total number of dollars spent over a time period, such as a year. Therefore, it is a flow variable, and has units of dollars/year. In contrast, the U.S. nominal capital stock is the total value, in dollars, of equipment, buildings, and other real productive assets in the U.S. economy, and has units of dollars. The diagram provides an intuitive illustration of how the stock of capital currently available is increased by the flow of new investment and depleted by the flow of depreciation.

Stocks and flows in accounting

Thus, a stock refers to the value of an asset at a balance date (or point in time), while a flow refers to the total value of transactions (sales or purchases, incomes or expenditures) during an accounting period. If the flow value of an economic activity is divided by the average stock value during an accounting period, we obtain a measure of the number of turnovers (or rotations) of a stock in that accounting period. Some accounting entries are normally always represented as a flow (e.g. profit or income), while others may be represented both as a stock or as a flow (e.g. capital).

A person or country might have stocks of money, financial assets, liabilities, wealth, real means of production, capital, inventories, and human capital (or labor power). Flow magnitudes include income, spending, saving, debt repayment, fixed investment, inventory investment, and labor utilization. These differ in their units of measurement. Capital is a stock concept which yields a periodic income which is a flow concept.

Comparing stocks and flows

Stocks and flows have different units and are thus not commensurable – they cannot be meaningfully compared, equated, added, or subtracted. However, one may meaningfully take ratios of stocks and flows, or multiply or divide them. This is a point of some confusion for some economics students, as some confuse taking ratios (valid) with comparing (invalid).

The ratio of a stock over a flow has units of (units)/(units/time) = time. For example, the debt to GDP ratio has units of years (as GDP is measured in, for example, dollars per year whereas debt is measured in dollars), which yields the interpretation of the debt to GDP ratio as "number of years to pay off all debt, assuming all GDP devoted to debt repayment".

The ratio of a flow to a stock has units 1/time. For example, the velocity of money is defined as nominal GDP / nominal money supply; it has units of (dollars / year) / dollars = 1/year.

In discrete time, the change in a stock variable from one point in time to another point in time one time unit later (the first difference of the stock) is equal to the corresponding flow variable per unit of time. For example, if a country's stock of physical capital on January 1, 2010 is 20 machines and on January 1, 2011 is 23 machines, then the flow of net investment during 2010 was 3 machines per year. If it then has 27 machines on January 1, 2012, the flow of net investment during 2010 and 2011 averaged machines per year.

In continuous time, the time derivative of a stock variable is a flow variable.

More general uses

Stocks and flows also have natural meanings in many contexts outside of economics, business and related fields. The concepts apply to many conserved quantities such as energy, and to materials such as in stoichiometry, water reservoir management, and greenhouse gases and other durable pollutants that accumulate in the environment or in organisms. Climate change mitigation, for example, is a fairly straightforward stock and flow problem with the primary goal of reducing the stock (the concentration of durable greenhouse gases in the atmosphere) by manipulating the flows (reducing inflows such as greenhouse gas emissions into the atmosphere, and increasing outflows such as carbon dioxide removal). In living systems, such as the human body, energy homeostasis describes the linear relationship between flows (the food we eat and the energy we expend along with the wastes we excrete) and the stock (manifesting as our gain or loss of body weight over time). In Earth system science, many stock and flow problems arise, such as in the carbon cycle, the nitrogen cycle, the water cycle, and Earth's energy budget. Thus stocks and flows are the basic building blocks of system dynamics models. Jay Forrester originally referred to them as "levels" rather than stocks, together with "rates" or "rates of flow". [1]

A stock (or "level variable") in this broader sense is some entity that is accumulated over time by inflows and/or depleted by outflows. Stocks can only be changed via flows. Mathematically a stock can be seen as an accumulation or integration of flows over time – with outflows subtracting from the stock. Stocks typically have a certain value at each moment of time – e.g. the number of population at a certain moment, or the quantity of water in a reservoir.

A flow (or "rate") changes a stock over time. Usually we can clearly distinguish inflows (adding to the stock) and outflows (subtracting from the stock). Flows typically are measured over a certain interval of time – e.g., the number of births over a day or month.

Synonyms

StockFlow
LevelRate
IntegralDerivative
State Variable

Examples

Accounting, finance, etc.

"Stock"Possible units of stock"Inflow(s)""Outflow(s)"Possible units of flow
bank balanceyendeposits
interest
withdrawalsyen per month
inventory of lumberboard feetincoming lumberoutgoing lumberboard feet per week
housing stockdollarshousing investmenthousing depreciationdollars per year
equity shareholdingsshares (of 'stock')purchases of sharessales of sharesshares per month

Other contexts

"Stock"Possible units of stock"Inflow(s)""Outflow(s)"Possible units of flow
CO2 in atmospheretonstons emittedtons sequesteredtons per day
guests in a hotelpersonsguests arrivingguests leavingpersons per day
populationpersonsbirths
immigration
deaths
emigration
persons per year
water in bathtub literswater pouring inwater draining outliters per second
waste in disposal sitetonsdumping wastedecay of wastetons per week
fuel tankgallonsrefuelingfuel consumptiongallons per month

Calculus interpretation

If the quantity of some stock variable at time is , then the derivative is the flow of changes in the stock. Likewise, the stock at some time is the integral of the flow from some moment set as zero until time .

For example, if the capital stock is increased gradually over time by a flow of gross investment and decreased gradually over time by a flow of depreciation , then the instantaneous rate of change in the capital stock is given by

where the notation refers to the flow of net investment, which is the difference between gross investment and depreciation.

Example of dynamic stock and flow diagram

Dynamic stock and flow diagram SFD ANI.gif
Dynamic stock and flow diagram
Ten first stocks and flow values SFD VAL.gif
Ten first stocks and flow values

Equations that change the two stocks via the flow are:

List of all the equations, in their order of execution in each time, from time = 1 to 36:

History

The distinction between a stock and a flow variable is elementary, and dates back centuries in accounting practice (distinction between an asset and income, for instance). In economics, the distinction was formalized and terms were set in ( Fisher 1896 ), in which Irving Fisher formalized capital (as a stock).

Polish economist Michał Kalecki emphasized the centrality of the distinction of stocks and flows, caustically calling economics "the science of confusing stocks with flows" in his critique of the quantity theory of money (circa 1936, frequently quoted by Joan Robinson). [2]

See also

Related Research Articles

In engineering and science, dimensional analysis is the analysis of the relationships between different physical quantities by identifying their base quantities and units of measurement and tracking these dimensions as calculations or comparisons are performed. The term dimensional analysis is also used to refer to conversion of units from one dimensional unit to another, which can be used to evaluate scientific formulae.

In physics, power is the amount of energy transferred or converted per unit time. In the International System of Units, the unit of power is the watt, equal to one joule per second. In older works, power is sometimes called activity. Power is a scalar quantity.

The net present value (NPV) or net present worth (NPW) applies to a series of cash flows occurring at different times. The present value of a cash flow depends on the interval of time between now and the cash flow. It also depends on the annual effective discount rate. NPV accounts for the time value of money. It provides a method for evaluating and comparing capital projects or financial products with cash flows spread over time, as in loans, investments, payouts from insurance contracts plus many other applications.

Investment is traditionally defined as the "commitment of resources to achieve later benefits". If an investment involves money, then it can be defined as a "commitment of money to receive more money later". From a broader viewpoint, an investment can be defined as "to tailor the pattern of expenditure and receipt of resources to optimise the desirable patterns of these flows". When expenditures and receipts are defined in terms of money, then the net monetary receipt in a time period is termed cash flow, while money received in a series of several time periods is termed cash flow stream.

<span class="mw-page-title-main">Price–earnings ratio</span> Financial Metric

The price–earnings ratio, also known as P/E ratio, P/E, or PER, is the ratio of a company's share (stock) price to the company's earnings per share. The ratio is used for valuing companies and to find out whether they are overvalued or undervalued.

<span class="mw-page-title-main">Government budget balance</span> Difference between revenues and spending

The government budget balance, also referred to as the general government balance, public budget balance, or public fiscal balance, is the difference between government revenues and spending. For a government that uses accrual accounting the budget balance is calculated using only spending on current operations, with expenditure on new capital assets excluded. A positive balance is called a government budget surplus, and a negative balance is a government budget deficit. A government budget presents the government's proposed revenues and spending for a financial year.

Stock valuation is the method of calculating theoretical values of companies and their stocks. The main use of these methods is to predict future market prices, or more generally, potential market prices, and thus to profit from price movement – stocks that are judged undervalued are bought, while stocks that are judged overvalued are sold, in the expectation that undervalued stocks will overall rise in value, while overvalued stocks will generally decrease in value. A target price is a price at which an analyst believes a stock to be fairly valued relative to its projected and historical earnings.

Fixed investment in economics is the purchasing of newly produced fixed capital. It is measured as a flow variable – that is, as an amount per unit of time.

In economics, nominalvalue refers to value measured in terms of absolute money amounts, whereas real value is considered and measured against the actual goods or services for which it can be exchanged at a given time. Real value takes into account inflation and the value of an asset in relation to its purchasing power.

Foreign exchange reserves are cash and other reserve assets such as gold and silver held by a central bank or other monetary authority that are primarily available to balance payments of the country, influence the foreign exchange rate of its currency, and to maintain confidence in financial markets. Reserves are held in one or more reserve currencies, nowadays mostly the United States dollar and to a lesser extent the euro.

In business, operating margin—also known as operating income margin, operating profit margin, EBIT margin and return on sales (ROS)—is the ratio of operating income to net sales, usually expressed in percent.

A time derivative is a derivative of a function with respect to time, usually interpreted as the rate of change of the value of the function. The variable denoting time is usually written as .

The Harrod–Domar model is a Keynesian model of economic growth. It is used in development economics to explain an economy's growth rate in terms of the level of saving and of capital. It suggests that there is no natural reason for an economy to have balanced growth. The model was developed independently by Roy F. Harrod in 1939, and Evsey Domar in 1946, although a similar model had been proposed by Gustav Cassel in 1924. The Harrod–Domar model was the precursor to the exogenous growth model.

<span class="mw-page-title-main">Gross fixed capital formation</span> Macroeconomic concept

Gross fixed capital formation (GFCF) is a component of the expenditure on gross domestic product (GDP) that indicates how much of the new value added in an economy is invested rather than consumed. It measures the value of acquisitions of new or existing fixed assets by the business sector, governments, and "pure" households minus disposals of fixed assets.

In finance, return is a profit on an investment. It comprises any change in value of the investment, and/or cash flows which the investor receives from that investment over a specified time period, such as interest payments, coupons, cash dividends and stock dividends. It may be measured either in absolute terms or as a percentage of the amount invested. The latter is also called the holding period return.

Cash-flow return on investment (CFROI) is a valuation model that assumes the stock market sets prices based on cash flow, not on corporate performance and earnings.

The modified Dietz method is a measure of the ex post performance of an investment portfolio in the presence of external flows.

Dividend policy is concerned with financial policies regarding paying cash dividend in the present or paying an increased dividend at a later stage. Whether to issue dividends, and what amount, is determined mainly on the basis of the company's unappropriated profit and influenced by the company's long-term earning power. When cash surplus exists and is not needed by the firm, then management is expected to pay out some or all of those surplus earnings in the form of cash dividends or to repurchase the company's stock through a share buyback program.

In economics, depreciation is the gradual decrease in the economic value of the capital stock of a firm, nation or other entity, either through physical depreciation, obsolescence or changes in the demand for the services of the capital in question. If the capital stock is in one period , gross (total) investment spending on newly produced capital is and depreciation is , the capital stock in the next period, , is . The net increment to the capital stock is the difference between gross investment and depreciation, and is called net investment.

In macroeconomics, investment "consists of the additions to the nation's capital stock of buildings, equipment, software, and inventories during a year" or, alternatively, investment spending — "spending on productive physical capital such as machinery and construction of buildings, and on changes to inventories — as part of total spending" on goods and services per year.

References

  1. Forrester, Jay (1973). World Dynamics (2 ed.). Cambridge, Massachusetts: Wright-Allen Press, Inc. pp. 18–19.
  2. Joan Robinson, "Shedding Darkness [ dead link ]", Cambridge Journal of Economics , 6 (1982), 295–6: "it is the science of confusing stocks with flows. It is this confusion that has kept the Quantity Theory of Money alive until today."