Talalora

Last updated
Talalora
Municipality of Talalora
Talalora view.jpg
Mountain-top view of Talalora
Flag of Talalora, Samar.png
Ph locator samar talalora.png
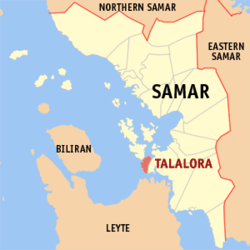
Map of Samar with Talalora highlighted
OpenStreetMap
Talalora
Philippines location map (square).svg
Red pog.svg
Talalora
Location within the Philippines
Coordinates: 11°31′52″N124°50′08″E / 11.5311°N 124.8356°E / 11.5311; 124.8356
Country Philippines
Region Eastern Visayas
Province Samar
District 2nd district
Barangays 11 (see Barangays)
Government
[1]
  Type Sangguniang Bayan
   Mayor Rosabel O. Costelo
   Vice Mayor Leonilo T. Costelo
   Representative Reynolds Michael Tan
   Electorate 6,987 voters (2025)
Area
[2]
  Total
27.96 km2 (10.80 sq mi)
Elevation
38 m (125 ft)
Population
 (2024 census) [3]
  Total
8,530
  Density310/km2 (790/sq mi)
   Households
1,861
Economy
   Income class 6th municipal income class
   Poverty incidence
35.98
% (2021) [4]
   Revenue 83.41 million (2022)
   Assets 273.7 million (2022)
   Expenditure 44.65 million (2022)
   Liabilities 95.63 million (2022)
Service provider
  ElectricitySamar 2 Electric Cooperative (SAMELCO 2)
Time zone UTC+8 (PST)
ZIP code
6704
PSGC
IDD : area code +63(0)55
Native languages Waray
Tagalog

Talalora, officially the Municipality of Talalora (Waray : Bungto han Talalora; Tagalog : Bayan ng Talalora), is a municipality in the province of Samar, Philippines. According to the 2020 census, it has a population of 8,856 people. [5]

Contents

Talalora was created from the barrios of Mallorga, Tulac, Talalora, Tatabonan, Navatas, and Navatas Guti of the town of Villareal, by virtue of Republic Act No. 192, on June 22, 1947. [6]

Geography

Barangays

Talalora is politically subdivided into 11 barangays. Each barangay consists of puroks and some have sitios.

Climate

Climate data for Talalora, Samar
MonthJanFebMarAprMayJunJulAugSepOctNovDecYear
Mean daily maximum °C (°F)28
(82)
29
(84)
29
(84)
31
(88)
31
(88)
30
(86)
30
(86)
30
(86)
30
(86)
29
(84)
29
(84)
29
(84)
30
(85)
Mean daily minimum °C (°F)22
(72)
22
(72)
22
(72)
23
(73)
24
(75)
25
(77)
25
(77)
25
(77)
25
(77)
24
(75)
24
(75)
23
(73)
24
(75)
Average precipitation mm (inches)73
(2.9)
56
(2.2)
75
(3.0)
71
(2.8)
114
(4.5)
174
(6.9)
172
(6.8)
163
(6.4)
167
(6.6)
161
(6.3)
158
(6.2)
125
(4.9)
1,509
(59.5)
Average rainy days15.212.516.217.323.927.328.426.926.927.123.819.3264.8
Source: Meteoblue [7]

Demographics

Population census of Talalora
YearPop.±% p.a.
1948 6,031    
1960 5,830−0.28%
1970 6,639+1.31%
1975 6,873+0.70%
1980 6,332−1.63%
1990 6,112−0.35%
1995 6,565+1.35%
2000 6,580+0.05%
2007 7,535+1.89%
2010 7,983+2.12%
2015 8,057+0.18%
2020 7,856−0.53%
2024 8,530+2.00%
Source: Philippine Statistics Authority [8] [9] [10] [11]

Economy

Poverty incidence of Talalora

10
20
30
40
50
60
70
80
2000
57.91
2003
71.42
2006
37.70
2009
46.98
2012
45.43
2015
47.12
2018
37.16
2021
35.98

Source: Philippine Statistics Authority [12] [13] [14] [15] [16] [17] [18] [19]

References

  1. Municipality of Talalora | (DILG)
  2. "2015 Census of Population, Report No. 3 – Population, Land Area, and Population Density" (PDF). Philippine Statistics Authority. Quezon City, Philippines. August 2016. ISSN   0117-1453. Archived (PDF) from the original on May 25, 2021. Retrieved July 16, 2021.
  3. "2024 Census of Population (POPCEN) Population Counts Declared Official by the President". Philippine Statistics Authority. 17 July 2025. Retrieved 18 July 2025.
  4. "PSA Releases the 2021 City and Municipal Level Poverty Estimates". Philippine Statistics Authority. 2 April 2024. Retrieved 28 April 2024.
  5. "2024 Census of Population (POPCEN) Population Counts Declared Official by the President". Philippine Statistics Authority. 17 July 2025. Retrieved 18 July 2025.
  6. http://lawph.com/statutes/ra192.html [ dead link ]
  7. "Talalora: Average Temperatures and Rainfall". Meteoblue. Retrieved 29 February 2020.
  8. Census of Population (2015). "Region VIII (Eastern Visayas)". Total Population by Province, City, Municipality and Barangay. Philippine Statistics Authority . Retrieved 20 June 2016.
  9. Census of Population and Housing (2010). "Region VIII (Eastern Visayas)" (PDF). Total Population by Province, City, Municipality and Barangay. National Statistics Office . Retrieved 29 June 2016.
  10. Censuses of Population (1903–2007). "Region VIII (Eastern Visayas)". Table 1. Population Enumerated in Various Censuses by Province/Highly Urbanized City: 1903 to 2007. National Statistics Office.
  11. "Province of". Municipality Population Data. Local Water Utilities Administration Research Division. Retrieved 17 December 2016.
  12. "Poverty incidence (PI):". Philippine Statistics Authority. Retrieved December 28, 2020.
  13. "Estimation of Local Poverty in the Philippines" (PDF). Philippine Statistics Authority. 29 November 2005.
  14. "2003 City and Municipal Level Poverty Estimates" (PDF). Philippine Statistics Authority. 23 March 2009.
  15. "City and Municipal Level Poverty Estimates; 2006 and 2009" (PDF). Philippine Statistics Authority. 3 August 2012.
  16. "2012 Municipal and City Level Poverty Estimates" (PDF). Philippine Statistics Authority. 31 May 2016.
  17. "Municipal and City Level Small Area Poverty Estimates; 2009, 2012 and 2015". Philippine Statistics Authority. 10 July 2019.
  18. "PSA Releases the 2018 Municipal and City Level Poverty Estimates". Philippine Statistics Authority. 15 December 2021. Retrieved 22 January 2022.
  19. "PSA Releases the 2021 City and Municipal Level Poverty Estimates". Philippine Statistics Authority. 2 April 2024. Retrieved 28 April 2024.