British Columbia is the westernmost province of Canada, bordered by the Pacific Ocean. With an area of 944,735 km2 (364,764 sq mi) it is Canada's third-largest province. The province is almost four times the size of the United Kingdom and larger than every United States state except Alaska. It is bounded on the northwest by the U.S. state of Alaska, directly north by Yukon and the Northwest Territories, on the east by Alberta, and on the south by the U.S. states of Washington, Idaho, and Montana. Formerly part of the British Empire, the southern border of British Columbia was established by the 1846 Oregon Treaty. The province is dominated by mountain ranges, among them the Canadian Rockies but dominantly the Coast Mountains, Cassiar Mountains, and the Columbia Mountains. Most of the population is concentrated on the Pacific coast, notably in the area of Vancouver, located on the southwestern tip of the mainland, which is known as the Lower Mainland. It is the most mountainous province of Canada.

The climate of Scotland is mostly temperate and oceanic, and tends to be very changeable, but rarely extreme.

The geography of Toronto, Ontario, covers an area of 630 km2 (240 sq mi) and is bounded by Lake Ontario to the south; Etobicoke Creek, Eglinton Avenue, and Highway 427 to the west; Steeles Avenue to the north; and the Rouge River and the Scarborough–Pickering Townline to the east. In addition to Etobicoke Creek and the Rouge River, the city is trisected by two minor rivers and their tributaries, the Humber River in the west end and the Don River east of downtown. Both flow southward to Lake Ontario at Humber Bay and Toronto Harbour respectively, which are part of the longer Waterfront, as well as Etobicoke Creek and the Rouge River.
The city of Vancouver, located in British Columbia, Canada, has a temperate oceanic climate. Its summer months are typically dry and modestly warm, while the rest of the year is rainy, especially between October and March. The region has frequent cloudy and overcast skies during the late fall, winter, and spring.

Yarmouth, officially named the Municipality of the District of Yarmouth, is a district municipality in Yarmouth County, Nova Scotia, Canada. Statistics Canada classifies the district municipality as a municipal district.

Winnipeg lies at the bottom of the Red River Valley, a low-lying flood plain with an extremely flat topography. This valley was formed by the ancient glacial Lake Agassiz which has rich deposits of black soil. Winnipeg is on the eastern edge of the Canadian Prairies in Western Canada; it is known as the 'Gateway to the West'. It is relatively close to many large Canadian Shield lakes and parks, as well as Lake Winnipeg. Winnipeg is bordered by tallgrass prairie to the west and south and the aspen parkland to the northeast.
A cold wave is a weather phenomenon that is distinguished by a cooling of the air. Specifically, as used by the U.S. National Weather Service, a cold wave is a rapid fall in temperature within a 24-hour period requiring substantially increased protection to agriculture, industry, commerce, and social activities. The precise criteria for a cold wave are the rate at which the temperature falls, and the minimum to which it falls. This minimum temperature is dependent on the geographical region and time of year.

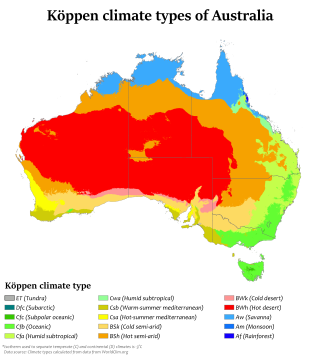
Australia's climate is governed mostly by its size and by the hot, sinking air of the subtropical high pressure belt. This moves north-west and north-east with the seasons. The climate is variable, with frequent droughts lasting several seasons, thought to be caused in part by the El Niño-Southern Oscillation. Australia has a wide variety of climates due to its large geographical size. The largest part of Australia is desert or semi-arid. Only the south-east and south-west corners have a temperate climate and moderately fertile soil. The northern part of the country has a tropical climate, varying between grasslands and desert. Australia holds many heat-related records: the continent has the hottest extended region year-round, the areas with the hottest summer climate, and the highest sunshine duration.

Stony Rapids is a northern hamlet in Northern Saskatchewan, Canada. It is located 82 kilometres (51 mi) south of the border to the Northwest Territories, the community is astride the Fond du Lac River. This river connects the community to Fond-du-Lac, Uranium City and Camsell Portage.

Tasmania has a cool temperate climate with four distinct seasons. The highest recorded maximum temperature in Tasmania is 42.2 °C (108.0 °F) at Scamander on 30 January 2009, during the 2009 southeastern Australia heat wave. Tasmania's lowest recorded minimum temperature is −14.2 °C (6.4 °F) on 7 August 2020, at Central Plateau.

In March 2012, one of the greatest heat waves was observed in many regions of North America. Very warm air pushed northward west of the Great Lakes region, and subsequently spread eastward. The intense poleward air mass movement was propelled by an unusually intense low level southerly jet that stretched from Louisiana to western Wisconsin. Once this warm surge inundated the area, a remarkably prolonged period of record setting temperatures ensued.

The 2013 extreme weather events included several all-time temperature records in Northern and Southern Hemisphere. The February extent of snow cover in Eurasia and North America was above average, while the extent of Arctic ice in the same month was 4.5% below the 1981–2010 average. The Northern Hemisphere weather extremes have been linked to the melting of Arctic sea ice, which alters atmospheric circulation in a way that leads to more snow and ice.

The 1994 North American cold wave occurred over the midwestern and eastern regions of the United States and southern Canada in January 1994. The cold wave caused over 100 deaths in the United States. Two notable cold air events took place from January 18–19 and January 21–22. There were 67 minimum temperature records set on January 19. During this time, much of the United States experienced its coldest temperatures since a major storm on February 20, 1934.

The January–March 2014 North American cold wave was an extreme weather event that extended through the late winter months of the 2013–2014 winter season, and was also part of an unusually cold winter affecting parts of Canada and parts of the north-central and northeastern United States. The event occurred in early 2014 and was caused by a southward shift of the North Polar Vortex. Record-low temperatures also extended well into March.

The 2014–15 North American winter was frigid and prolifically wintry, especially across the eastern half of North America in the months of January–March. The season began early, with many places in North America experiencing their first wintry weather during mid-November. A period of below-average temperatures affected much of the contiguous United States, and several records were broken. An early trace of snowfall was recorded in Arkansas. There were greater accumulations of snow across parts of Oklahoma as well. A quasi-permanent phenomenon referred to as the polar vortex may have been partly responsible for the cold weather. Temperatures in much of the United States dropped 15 to 35 °F below average by November 19, following a southward "dip" of the polar vortex into the eastern two-thirds of the country. The effects of this dip were widespread, bringing about temperatures as low as 28 °F (−2 °C) in Pensacola, Florida. Following a significant snowstorm there, Buffalo, New York received several feet of snow from November 17–21. In addition, significant winter weather occurred throughout the season, including a major blizzard that struck the Northeastern United States at the end of January, another blizzard that affected much of the Northern United States days later in early February, and several significant snow events paired with very frigid temperatures for much of February.

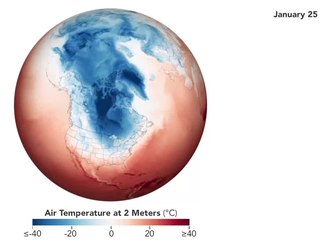
In late January 2019, a severe cold wave caused by a weakened jet stream around the Arctic polar vortex hit the Midwestern United States and Eastern Canada, killing at least 22 people. It came after a winter storm brought up to 13 inches (33 cm) of snow in some regions from January 27–29, and brought the coldest temperatures in over 20 years to most locations in the affected region, including some all-time record lows. In early February, a concentration of Arctic air colloquially referred to as the "polar vortex" moved west, and became locked over Western Canada and the Western United States. As a result, February 2019 was among the coldest and snowiest on record in these regions. In early March, the cold once again shifted east, breaking records in many areas. In mid-March, the cold wave finally retreated, but combined with above-average temperatures, precipitation, and a deep snowpack, widespread flooding ensued in the Central US.

Edmonton has a humid continental climate. It falls into the NRC 4a Plant Hardiness Zone.

The February 2021 North American cold wave was an extreme weather event that brought record low temperatures to a significant portion of Canada, the United States and parts of northern Mexico during the first two-thirds of February 2021. The cold was caused by a southern migration of the polar vortex, likely caused by a sudden stratospheric warming event that occurred the prior month. Temperatures fell as much as 25–50 °F below average as far south as the Gulf Coast. Severe winter storms also were associated with the bitter cold, which allowed for heavy snowfall and ice accumulations to places as far south as Houston, Texas, and contributing to one of the snowiest winters ever in some areas in the Deep South.


