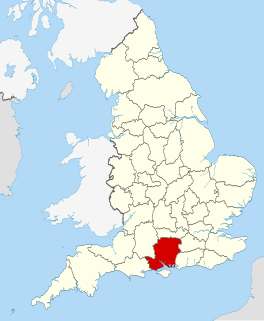
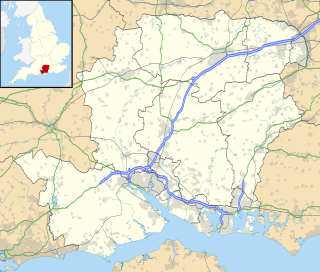
The 2000 Winchester Council election took place on 4 May 2000 to elect members of Winchester District Council in Hampshire, England. One third of the council was up for election and the Liberal Democrats stayed in overall control of the council. [1]
The City of Winchester is a local government district in Hampshire, England, with city status.
Non-metropolitan districts, or colloquially "shire districts", are a type of local government district in England. As created, they are sub-divisions of non-metropolitan counties in a two-tier arrangement.
Hampshire is a county on the southern coast of England. The county town is the city of Winchester. Its two largest cities, Southampton and Portsmouth, are administered separately as unitary authorities; the rest of the county is governed by Hampshire County Council.
After the election, the composition of the council was
The Liberal Democrats are a centrist, liberal political party in the United Kingdom. It is currently led by Vince Cable. It has 11 Members of Parliament in the House of Commons, 96 members of the House of Lords, one member of the European Parliament, five Members of the Scottish Parliament and one member in the Welsh Assembly and London Assembly. At the height of its influence, the party served as junior partners in a coalition government with the Conservative Party from 2010 to 2015.
The Conservative Party, officially the Conservative and Unionist Party, is a centre-right political party in the United Kingdom. The governing party since 2010, it is the largest in the House of Commons, with 313 Members of Parliament, and also has 249 members of the House of Lords, 18 members of the European Parliament, 31 Members of the Scottish Parliament, 12 members of the Welsh Assembly, eight members of the London Assembly and 8,916 local councillors.
The Labour Party is a centre-left political party in the United Kingdom that has been described as an alliance of social democrats, democratic socialists and trade unionists. The party's platform emphasises greater state intervention, social justice and strengthening workers' rights.
One third of the seats were being contested, with an extra seat being up for election in St Bartholomew ward after the sitting Conservative councillor, Flick Drummond, emigrated to the USA and thus failed to attend any council meetings in the required 6-month period. [3] The Liberal Democrats had a majority of 13 seats before the election and despite defending 9 seats were expected to remain in control of the council. [3] 3 sitting councillors, all Liberal Democrats, stood down at the election, Miranda Bulloch, Phrynette Dickens and Alan Laidlaw. [3]
A Councillor is a member of a local government council.
Emigration is the act of leaving a resident country or place of residence with the intent to settle elsewhere. Conversely, immigration describes the movement of persons into one country from another. Both are acts of migration across national or other geographical boundaries.
The Conservatives campaigned on a promise to reduce council tax by 5% over the next 4 years and attacked the Liberal Democrats over the closure of car parks in the city centre. [3] However the Liberal Democrats alleged lies had been said about the car parks, and said the Conservatives would have to cut services if they were to reduce council tax. [3]
The Conservatives also complained about the Liberal Democrat controlled council publishing a newsletter during the campaign. [4] They claimed that it was propaganda for the Liberal Democrats and favoured sitting councillors, however the Liberal Democrats said that the Conservative leader on the council had approved the newsletter and that the Conservatives were avoiding the real issues. [4]
Propaganda is information that is not objective and is used primarily to influence an audience and further an agenda, often by presenting facts selectively to encourage a particular synthesis or perception, or using loaded language to produce an emotional rather than a rational response to the information that is presented. Propaganda is often associated with material prepared by governments, but activist groups, companies, religious organizations and the media can also produce propaganda.
The results saw the Liberal Democrats increase their control of the council, making 2 nets gains to have an overall majority of 17. [5] They gained seats in Compton and Shawford, St Bartholomew and Wonston wards, but lost one back to the Conservatives in New Alresford. [5] Despite this the Conservatives said that they were pleased to have won more votes across the whole council than the Liberal Democrats, with many seats seeing very close results. [6] Meanwhile, one Labour candidate, Oliver de Peyer, only won 7 votes in Shedfield ward, the lowest by any major party candidate in elections for Winchester council and a repeat of his performance in Sparsholt in 1998. [6] Overall turnout in the election was 39.97%, with the highest turnout being recorded in Droxford, Soberton & Hambledon ward at 57.68%. [5]
Compton and Shawford is a civil parish in the City of Winchester, Hampshire, England. The word compton means village in a combe and aptly describes the settlement as it primarily consists of a long street on the side of a chalk valley.
Wonston is a village and civil parish in the City of Winchester district of Hampshire, England. The village had an estimated population of 1,283 in the census of 2001. The civil parish includes the settlements of Sutton Scotney, Stoke Charity, Norton and Hunton. Located in the Hundred of Buddlesgate, the Manor of Wonston is listed in the Domesday Book as belonging to the Bishop of Winchester. The northern boundary of the Civil Parish is marked by the southern boundary of Freefolk Wood.
New Alresford or simply Alresford is a small town and civil parish in the City of Winchester district of Hampshire, England. It is 7.5 miles (12 km) northeast of Winchester and 12 miles (20 km) southwest of the town of Alton.
Party | Seats | Gains | Losses | Net gain/loss | Seats % | Votes % | Votes | +/− | |
---|---|---|---|---|---|---|---|---|---|
Liberal Democrat | 11 | 3 | 1 | +2 | 57.9 | 39.3 | 9,756 | -5.1% | |
Conservative | 3 | 0 | 2 | -2 | 15.8 | 42.5 | 10,554 | +3.0% | |
Independent | 3 | 0 | 0 | 0 | 15.8 | 6.8 | 1,678 | +2.9% | |
Labour | 2 | 0 | 0 | 0 | 10.5 | 11.4 | 2,818 | -0.7% |
Party | Candidate | Votes | % | ± | |
---|---|---|---|---|---|
Liberal Democrat | Geraldine McKay | 410 | 58.2 | ||
Conservative | Peter Welburn | 237 | 33.7 | ||
Labour | Shelagh Bird | 57 | 8.1 | ||
Majority | 173 | 24.5 | |||
Turnout | 704 | 36.0 | |||
Liberal Democrat hold | Swing |
Party | Candidate | Votes | % | ± | |
---|---|---|---|---|---|
Independent | Georgina Busher | 1,013 | 63.5 | +14.9 | |
Conservative | Alan Foster | 469 | 29.4 | +7.6 | |
Labour | Michael Chaplin | 114 | 7.1 | +2.7 | |
Majority | 544 | 34.1 | +10.7 | ||
Turnout | 1,596 | 31.9 | -6.8 | ||
Independent hold | Swing |
Party | Candidate | Votes | % | ± | |
---|---|---|---|---|---|
Liberal Democrat | Kenneth Carter | 263 | 61.2 | ||
Conservative | Mike Roberts | 133 | 30.9 | ||
Labour | James Ross | 34 | 7.9 | ||
Majority | 130 | 30.3 | |||
Turnout | 430 | 45.7 | |||
Liberal Democrat hold | Swing |
Party | Candidate | Votes | % | ± | |
---|---|---|---|---|---|
Liberal Democrat | Charlotte Bailey | 338 | 50.9 | ||
Conservative | Margaret Campbell-White | 311 | 46.8 | ||
Labour | Kevin Barrett | 15 | 2.3 | ||
Majority | 27 | 4.1 | |||
Turnout | 664 | 55.8 | |||
Liberal Democrat gain from Conservative | Swing | ||||
Party | Candidate | Votes | % | ± | |
---|---|---|---|---|---|
Conservative | Donald Stewart | 1,167 | 69.5 | +2.8 | |
Liberal Democrat | Alan Slade | 450 | 26.8 | +0.1 | |
Labour | Timothy Curran | 61 | 3.6 | -3.0 | |
Majority | 717 | 42.7 | +2.7 | ||
Turnout | 1,678 | 36.0 | -2.3 | ||
Conservative hold | Swing |
Party | Candidate | Votes | % | ± | |
---|---|---|---|---|---|
Conservative | Diana Empson | 918 | 64.2 | ||
Liberal Democrat | Margaret Scriven | 465 | 32.5 | ||
Labour | Denis May | 48 | 3.4 | ||
Majority | 453 | 31.7 | |||
Turnout | 1,431 | 57.7 | |||
Conservative hold | Swing |
Party | Candidate | Votes | % | ± | |
---|---|---|---|---|---|
Liberal Democrat | George Fothergill | 806 | 59.1 | +4.1 | |
Conservative | Barry Lipscomb | 516 | 37.8 | -2.9 | |
Labour | Tessa Valentine | 42 | 3.1 | -1.2 | |
Majority | 290 | 21.3 | +7.0 | ||
Turnout | 1,364 | 50.9 | +0.9 | ||
Liberal Democrat hold | Swing |
Party | Candidate | Votes | % | ± | |
---|---|---|---|---|---|
Conservative | Ernest Jeffs | 876 | 44.4 | -2.5 | |
Liberal Democrat | Simon Cook | 772 | 39.1 | +4.9 | |
Labour | Robin Atkins | 324 | 16.4 | -2.4 | |
Majority | 104 | 5.3 | -7.4 | ||
Turnout | 1,972 | 47.2 | -6.3 | ||
Conservative gain from Liberal Democrat | Swing | ||||
Party | Candidate | Votes | % | ± | |
---|---|---|---|---|---|
Liberal Democrat | Cecily Sutton | 652 | 49.2 | ||
Conservative | Peter Facey | 589 | 44.4 | ||
Labour | Pamela Smith | 85 | 6.4 | ||
Majority | 63 | 4.8 | |||
Turnout | 1,326 | 37.5 | |||
Liberal Democrat hold | Swing |
Party | Candidate | Votes | % | ± | |
---|---|---|---|---|---|
Independent | Paul Hoare | 325 | 56.5 | ||
Conservative | Roger Huxstep | 181 | 31.5 | ||
Liberal Democrat | Pauline Longcroft | 62 | 10.8 | ||
Labour | Oliver De Peyer | 7 | 1.2 | ||
Majority | 144 | 25.0 | |||
Turnout | 575 | 47.8 | |||
Independent hold | Swing |
Party | Candidate | Votes | % | ± | |
---|---|---|---|---|---|
Liberal Democrat | John Higgins | 770 | 51.1 | -8.0 | |
Conservative | Michael Whatley | 576 | 38.2 | +8.8 | |
Labour | Simon Woolfenden | 161 | 10.7 | -0.8 | |
Majority | 194 | 12.9 | -16.8 | ||
Turnout | 1,507 | 38.0 | -0.1 | ||
Liberal Democrat hold | Swing |
Party | Candidate | Votes | % | ± | |
---|---|---|---|---|---|
Liberal Democrat | James Maynard | 840 | 46.7 | -5.8 | |
Conservative | Ian Jones | 769 | 42.8 | +5.4 | |
Labour | Stephen Wyeth | 188 | 10.5 | +0.4 | |
Majority | 71 | 3.9 | -11.2 | ||
Turnout | 1,797 | 42.1 | -0.4 | ||
Liberal Democrat gain from Conservative | Swing | ||||
Party | Candidate | Votes | % | ± | |
---|---|---|---|---|---|
Labour | Chris Pines | 616 | 42.7 | -0.6 | |
Liberal Democrat | Signe-Maria Higgins | 458 | 31.7 | -4.2 | |
Conservative | Sally Goodman | 370 | 25.6 | +4.8 | |
Majority | 158 | 11.0 | +3.6 | ||
Turnout | 1,444 | 30.9 | -1.3 | ||
Labour hold | Swing |
Party | Candidate | Votes | % | ± | |
---|---|---|---|---|---|
Labour | Patrick Davies | 595 | 38.7 | +1.8 | |
Conservative | Stanley Trussler | 504 | 32.7 | -2.4 | |
Liberal Democrat | Colin Norris | 440 | 28.6 | +0.5 | |
Majority | 91 | 6.0 | +4.2 | ||
Turnout | 1,539 | 34.1 | +4.7 | ||
Labour hold | Swing |
Party | Candidate | Votes | % | ± | |
---|---|---|---|---|---|
Liberal Democrat | John Beveridge | 865 | 48.4 | +5.2 | |
Conservative | Elizabeth Osborne | 806 | 45.1 | -2.3 | |
Labour | Antony De Peyer | 115 | 6.4 | -3.0 | |
Majority | 59 | 3.3 | -0.9 | ||
Turnout | 1,786 | 45.6 | +2.1 | ||
Liberal Democrat hold | Swing |
Party | Candidate | Votes | % | ± | |
---|---|---|---|---|---|
Liberal Democrat | Raymond Love | 864 | 47.6 | -0.7 | |
Conservative | Jacqueline Pitman | 823 | 45.3 | +3.0 | |
Labour | Adrian Field | 129 | 7.1 | -2.3 | |
Majority | 41 | 2.3 | -3.7 | ||
Turnout | 1,816 | 41.4 | +0.5 | ||
Liberal Democrat hold | Swing |
Party | Candidate | Votes | % | ± | |
---|---|---|---|---|---|
Liberal Democrat | Graham Hutton | 657 | 49.5 | ||
Conservative | Barbara Jeffs | 571 | 43.0 | ||
Labour | Elaine Fullaway | 99 | 7.5 | ||
Majority | 86 | 6.5 | |||
Turnout | 1,327 | 37.9 | |||
Liberal Democrat hold | Swing |
Party | Candidate | Votes | % | ± | |
---|---|---|---|---|---|
Independent | Andrew Archard | 340 | 50.9 | ||
Conservative | Richard Bates | 185 | 27.7 | ||
Liberal Democrat | Philippa Currie | 84 | 12.6 | ||
Labour | David Jones | 59 | 8.8 | ||
Majority | 155 | 23.2 | |||
Turnout | 668 | 36.6 | |||
Independent hold | Swing |
Party | Candidate | Votes | % | ± | |
---|---|---|---|---|---|
Liberal Democrat | Richard Bayley | 560 | 47.4 | -5.8 | |
Conservative | Michael Pocock | 553 | 46.8 | +8.5 | |
Labour | Alan Drury | 69 | 5.8 | -2.8 | |
Majority | 7 | 0.6 | -14.3 | ||
Turnout | 1,182 | 39.0 | +1.6 | ||
Liberal Democrat gain from Conservative | Swing | ||||
The 2008 Tandridge District Council election took place on 1 May 2008 to elect members of Tandridge District Council in Surrey, England. One third of the council was up for election and the Conservative party stayed in overall control of the council.
Elections to Hartlepool Borough Council in the ceremonial county of County Durham in England were held on 4 May 2000. One third of the council was up for election and the Labour party lost overall control of the council to no overall control.
The 2002 St Albans City and District Council election took place on 2 May 2002 to elect members of St Albans District Council in Hertfordshire, England. One third of the council was up for election and the council stayed under no overall control.
The 2010 Winchester Council election took place on 6 May 2010 to elect members of Winchester District Council in Hampshire, England. One third of the council was up for election and the Liberal Democrats gained overall control of the council from the Conservative party.
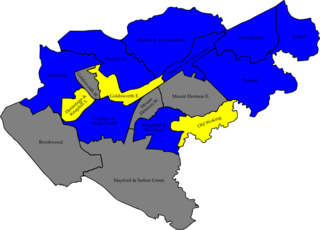
The 2007 Woking Council election took place on 3 May 2007 to elect members of Woking Borough Council in Surrey, England. One third of the council was up for election and the Conservative party gained overall control of the council from no overall control.
The 2008 Woking Council election took place on 1 May 2008 to elect members of Woking Borough Council in Surrey, England. One third of the council was up for election and the Conservative party stayed in overall control of the council.
The 2002 Winchester Council election took place on 2 May 2002 to elect members of Winchester District Council in Hampshire, England.
The 2003 Winchester Council election took place on 1 May 2003 to elect members of Winchester District Council in Hampshire, England. One third of the council was up for election and the Liberal Democrats stayed in overall control of the council.
The 2004 Winchester Council election took place on 10 June 2004 to elect members of Winchester District Council in Hampshire, England. One third of the council was up for election and the Liberal Democrats lost overall control of the council to no overall control.
The 2007 Winchester Council election took place on 3 May 2007 to elect members of Winchester District Council in Hampshire, England. One third of the council was up for election and the Conservative party stayed in overall control of the council.
The 2002 South Tyneside Metropolitan Borough Council election took place on 2 May 2002 to elect members of South Tyneside Metropolitan Borough Council in Tyne and Wear, England. One third of the council was up for election and the Labour party kept overall control of the council.
The 1999 Southend-on-Sea Council election took place on 6 May 1999 to elect members of Southend-on-Sea Unitary Council in Essex, England. One third of the council was up for election and the council stayed under no overall control.
The 2007 Southend-on-Sea Council election took place on 3 May 2007 to elect members of Southend-on-Sea Unitary Council in Essex, England. One third of the council was up for election and the Conservative party stayed in overall control of the council.
The 2000 Southampton Council election took place on 4 May 2000 to elect members of Southampton Unitary Council in Hampshire, England. One third of the council was up for election and the Labour party lost overall control of the council to no overall control.
The 2010 Craven District Council election took place on 6 May 2010 to elect members of Craven District Council in North Yorkshire, England. One third of the council was up for election and the Conservative party gained overall control of the council from no overall control.
The 2002 Fareham Council election took place on 2 May 2002 to elect members of Fareham Borough Council in Hampshire, England. The whole council was up for election with boundary changes since the last election in 2000 reducing the number of seats by 11. The Conservative party stayed in overall control of the council.
The 2008 Fareham Council election took place on 1 May 2008 to elect members of Fareham Borough Council in Hampshire, England. Half of the council was up for election and the Conservative party stayed in overall control of the council.
The 2002 Basingstoke and Deane Council election took place on 2 May 2002 to elect members of Basingstoke and Deane Borough Council in Hampshire, England. The whole council was up for election with boundary changes since the last election in 2000 increasing the number of seats by 3. The council stayed under no overall control.
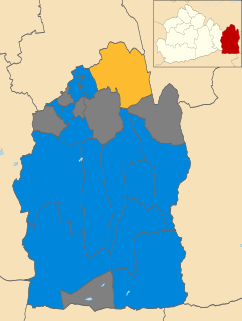
The 2010 Tandridge District Council election took place on 6 May 2010 to elect members of Tandridge District Council in Surrey, England. One third of the council was up for election and the Conservative party stayed in overall control of the council.
Elections to Winchester City Council took place on Thursday 2 May 2019, alongside other local elections across the country. The Conservatives party held a narrow majority of one at the last election, with the seats contested in this election were last contested in 2016 the Conservatives defended 10 seats, whilst the Liberal Democrats defended 4. Town and parish councils in the city boundary were also up for election.
Preceded by Winchester Council election, 1999 | Winchester local elections | Succeeded by Winchester Council election, 2002 |