The 2004 Winchester Council election took place on 10 June 2004 to elect members of Winchester District Council in Hampshire, England. One third of the council was up for election and the Liberal Democrats lost overall control of the council to no overall control. [1]
The City of Winchester is a local government district in Hampshire, England, with city status.
Non-metropolitan districts, or colloquially "shire districts", are a type of local government district in England. As created, they are sub-divisions of non-metropolitan counties in a two-tier arrangement.
Hampshire is a county on the southern coast of England. The county town is the city of Winchester. Its two largest cities, Southampton and Portsmouth, are administered separately as unitary authorities; the rest of the county is governed by Hampshire County Council.
After the election, the composition of the council was
The Liberal Democrats are a centrist, liberal political party in the United Kingdom. It is currently led by Vince Cable. It has 11 Members of Parliament in the House of Commons, 96 members of the House of Lords, one member of the European Parliament, five Members of the Scottish Parliament and one member in the Welsh Assembly and London Assembly. At the height of its influence, the party served as junior partners in a coalition government with the Conservative Party from 2010 to 2015.
The Conservative Party, officially the Conservative and Unionist Party, is a centre-right political party in the United Kingdom. The governing party since 2010, it is the largest in the House of Commons, with 313 Members of Parliament, and also has 249 members of the House of Lords, 18 members of the European Parliament, 31 Members of the Scottish Parliament, 12 members of the Welsh Assembly, eight members of the London Assembly and 8,916 local councillors.
The Labour Party is a centre-left political party in the United Kingdom that has been described as an alliance of social democrats, democratic socialists and trade unionists. The party's platform emphasises greater state intervention, social justice and strengthening workers' rights.
19 seats were contested in the election with the Liberal Democrats defending 14, the Conservatives and Independents 2 each and Labour 1 seat. [3] The Liberal Democrats were expected to be deprived of their majority on the council as they only needed to lose 1 seat for this to happen. [3] The Conservatives were the main challengers, with Labour only in contention in the wards of St John and All Saints and St Luke. [3] With the election being held at the same time as the European elections, the presence of 6 candidates from the United Kingdom Independence Party for the first time was seen as possibly affecting the results. [3]
Issues in the election included planning, the status of local neighbourhoods and the council tax. [3]
The Liberal Democrats lost their majority on the council for the first time since 1995, with the Conservatives gaining 4 seats from them. [4] However the Liberal Democrats did gain one seat from Labour in St John and All Saints ward. [5] Voter turnout in the election was significantly up at 48.8%, compared to 39.76% in the 2003 election. [4]
Voter turnout is the percentage of eligible voters who cast a ballot in an election. Eligibility varies by country, and the voting-eligible population should not be confused with the total adult population. Age and citizenship status are often among the criteria used to determine eligibility, but some countries further restrict eligibility based on sex, race, or religion.
Following the election the Liberal Democrats continued to run the council as a minority administration. [6]
Party | Seats | Gains | Losses | Net gain/loss | Seats % | Votes % | Votes | +/− | |
---|---|---|---|---|---|---|---|---|---|
Liberal Democrat | 11 | 1 | 4 | -3 | 57.9 | 42.1 | 14,425 | +1.1% | |
Conservative | 6 | 4 | 0 | +4 | 31.6 | 41.7 | 14,271 | -4.1% | |
Independent | 2 | 0 | 0 | 0 | 10.5 | 5.9 | 2,035 | +1.9% | |
Labour | 0 | 0 | 1 | -1 | 0 | 7.4 | 2,537 | -1.9% | |
UKIP | 0 | 0 | 0 | 0 | 0 | 2.8 | 971 | +2.8% |
Party | Candidate | Votes | % | ± | |
---|---|---|---|---|---|
Independent | Jean Hammerton | 1,083 | 45.2 | -5.9 | |
Conservative | Sally Lees | 630 | 26.3 | -1.0 | |
Liberal Democrat | Heregoo Kaushik | 581 | 24.2 | +7.1 | |
Labour | Stephen Haines | 102 | 4.3 | -0.2 | |
Majority | 453 | 18.9 | -4.9 | ||
Turnout | 2,396 | 46.6 | +13.7 | ||
Independent hold | Swing |
Party | Candidate | Votes | % | ± | |
---|---|---|---|---|---|
Conservative | John Cooper | 283 | 50.1 | +2.2 | |
Liberal Democrat | Stephen Nicholls | 223 | 39.5 | -12.6 | |
Independent | Mike Roberts | 37 | 6.5 | +6.5 | |
Labour | James Ross | 22 | 3.9 | +3.9 | |
Majority | 60 | 10.6 | |||
Turnout | 565 | 58.7 | +8.4 | ||
Conservative gain from Liberal Democrat | Swing | ||||
Party | Candidate | Votes | % | ± | |
---|---|---|---|---|---|
Liberal Democrat | Cecily Sutton | 1,274 | 61.4 | -1.8 | |
Conservative | Oliver Davis | 676 | 32.6 | +0.6 | |
Labour | Clare McKenna | 126 | 6.1 | +1.3 | |
Majority | 598 | 28.8 | -2.4 | ||
Turnout | 2,074 | 51.0 | +12.6 | ||
Liberal Democrat hold | Swing |
Party | Candidate | Votes | % | ± | |
---|---|---|---|---|---|
Conservative | George Beckett | 909 | 49.4 | -5.0 | |
Liberal Democrat | Charlotte Bailey | 786 | 42.7 | +0.6 | |
UKIP | Lawrence Hole | 109 | 5.9 | +5.9 | |
Labour | John Craig | 35 | 1.9 | -1.7 | |
Majority | 123 | 6.7 | -5.6 | ||
Turnout | 1,839 | 59.6 | +14.4 | ||
Conservative gain from Liberal Democrat | Swing | ||||
Party | Candidate | Votes | % | ± | |
---|---|---|---|---|---|
Conservative | Michael Read | 1,529 | 71.8 | +0.0 | |
Liberal Democrat | Benjamin Stoneham | 517 | 24.3 | -0.7 | |
Labour | David Picton-Jones | 85 | 4.0 | +0.8 | |
Majority | 1,012 | 47.5 | +0.7 | ||
Turnout | 2,131 | 42.9 | +8.1 | ||
Conservative hold | Swing |
Party | Candidate | Votes | % | ± | |
---|---|---|---|---|---|
Liberal Democrat | Robert Johnston | 693 | 45.1 | ||
Conservative | Stanley Howell | 636 | 41.4 | ||
UKIP | Gwendoline Girdwood | 130 | 8.5 | ||
Labour | Elaine Fullaway | 79 | 5.1 | ||
Majority | 57 | 3.7 | |||
Turnout | 1,538 | 48.8 | +6.9 | ||
Liberal Democrat hold | Swing |
Party | Candidate | Votes | % | ± | |
---|---|---|---|---|---|
Liberal Democrat | Jacey Jackson | 844 | 51.6 | -15.8 | |
Conservative | Susan Evershed | 735 | 44.9 | +17.6 | |
Labour | Tessa Valentine | 58 | 3.5 | -1.9 | |
Majority | 109 | 6.7 | -33.4 | ||
Turnout | 1,637 | 59.6 | +13.5 | ||
Liberal Democrat hold | Swing |
Party | Candidate | Votes | % | ± | |
---|---|---|---|---|---|
Liberal Democrat | Robin Darbyshire | 1,038 | 57.9 | ||
Conservative | Carole Marits | 666 | 37.1 | ||
Labour | Pamela Smith | 90 | 5.0 | ||
Majority | 372 | 20.8 | |||
Turnout | 1,794 | 55.2 | +5.5 | ||
Liberal Democrat hold | Swing |
Party | Candidate | Votes | % | ± | |
---|---|---|---|---|---|
Independent | Ashley Goodall | 730 | 49.9 | ||
Conservative | Roger Huxstep | 641 | 43.8 | ||
Labour | Oliver De Peyer | 92 | 6.3 | ||
Majority | 89 | 6.1 | |||
Turnout | 1,463 | 49.0 | +5.5 | ||
Independent hold | Swing |
Party | Candidate | Votes | % | ± | |
---|---|---|---|---|---|
Conservative | Anne Saunders | 1,210 | 49.0 | -6.2 | |
Liberal Democrat | Jacqueline Porter | 1,093 | 44.3 | +5.4 | |
Labour | Adrian Field | 165 | 6.7 | +0.9 | |
Majority | 117 | 4.7 | -11.6 | ||
Turnout | 2,468 | 55.4 | +9.2 | ||
Conservative gain from Liberal Democrat | Swing | ||||
Party | Candidate | Votes | % | ± | |
---|---|---|---|---|---|
Liberal Democrat | James Maynard | 967 | 46.6 | -3.2 | |
Conservative | Ian Jones | 726 | 35.0 | -4.1 | |
Labour | Denis Archdeacon | 209 | 10.1 | -1.0 | |
UKIP | Roy Green | 172 | 8.3 | +8.3 | |
Majority | 241 | 11.6 | +0.9 | ||
Turnout | 2,074 | 45.4 | +10.8 | ||
Liberal Democrat hold | Swing |
Party | Candidate | Votes | % | ± | |
---|---|---|---|---|---|
Liberal Democrat | John Higgins | 584 | 32.6 | -0.3 | |
Labour | Ann Craig | 525 | 29.3 | -9.7 | |
Conservative | Michael Lovegrove | 453 | 25.3 | -2.8 | |
UKIP | Geoffrey Barrett | 227 | 12.7 | +12.7 | |
Majority | 59 | 3.3 | |||
Turnout | 1,789 | 39.3 | +9.8 | ||
Liberal Democrat gain from Labour | Swing | ||||
Party | Candidate | Votes | % | ± | |
---|---|---|---|---|---|
Liberal Democrat | Ernest Nunn | 671 | 42.5 | +17.5 | |
Conservative | Richard Worrall | 586 | 37.2 | +14.3 | |
Labour | Debra Grech | 320 | 20.3 | -12.6 | |
Majority | 85 | 5.3 | |||
Turnout | 1,577 | 38.9 | +7.7 | ||
Liberal Democrat hold | Swing |
Party | Candidate | Votes | % | ± | |
---|---|---|---|---|---|
Liberal Democrat | John Beveridge | 973 | 43.9 | +1.6 | |
Conservative | Felicia Drummond | 902 | 40.7 | -10.1 | |
UKIP | Judith Napier-Clark | 156 | 7.0 | +7.0 | |
Independent | Frank Williams | 99 | 4.5 | +4.5 | |
Labour | Albert Edwards | 86 | 3.9 | -3.1 | |
Majority | 71 | 3.2 | |||
Turnout | 2,216 | 50.9 | +11.6 | ||
Liberal Democrat hold | Swing |
Party | Candidate | Votes | % | ± | |
---|---|---|---|---|---|
Liberal Democrat | Raymond Love | 1,011 | 56.4 | -5.9 | |
Conservative | Gillian Allen | 604 | 33.7 | +6.2 | |
Labour | Carol Orchard | 177 | 9.9 | -0.3 | |
Majority | 407 | 22.7 | -12.1 | ||
Turnout | 1,792 | 42.1 | +14.8 | ||
Liberal Democrat hold | Swing |
Party | Candidate | Votes | % | ± | |
---|---|---|---|---|---|
Liberal Democrat | Simon Cook | 1,199 | 42.8 | +8.5 | |
Conservative | Sarah Verney | 1,148 | 41.0 | -5.1 | |
Labour | Robin Atkins | 190 | 6.8 | -12.8 | |
UKIP | John Clark | 177 | 6.3 | +6.3 | |
Independent | Mark Luckham | 86 | 3.1 | +3.1 | |
Majority | 51 | 1.8 | |||
Turnout | 2,800 | 57.4 | +11.3 | ||
Liberal Democrat hold | Swing |
Party | Candidate | Votes | % | ± | |
---|---|---|---|---|---|
Conservative | Kate Chapman | 385 | 51.0 | -4.7 | |
Liberal Democrat | Brenda Hatch | 344 | 45.6 | +5.6 | |
Labour | David Smith | 26 | 3.4 | -0.9 | |
Majority | 41 | 5.4 | -10.3 | ||
Turnout | 755 | 39.0 | +9.7 | ||
Conservative gain from Liberal Democrat | Swing | ||||
Party | Candidate | Votes | % | ± | |
---|---|---|---|---|---|
Liberal Democrat | Therese Evans | 864 | 65.8 | +7.4 | |
Conservative | Graeme Quar | 388 | 29.6 | -9.3 | |
Labour | Patricia Hayward | 61 | 4.6 | +1.9 | |
Majority | 476 | 36.2 | +16.7 | ||
Turnout | 1,313 | 49.4 | +6.4 | ||
Liberal Democrat hold | Swing |
Party | Candidate | Votes | % | ± | |
---|---|---|---|---|---|
Conservative | Barry Lipscomb | 1,164 | 57.7 | +3.3 | |
Liberal Democrat | Simon Girling | 763 | 37.8 | -3.7 | |
Labour | Nigel Lickley | 89 | 4.4 | +0.2 | |
Majority | 401 | 19.9 | +7.0 | ||
Turnout | 2,016 | 49.4 | -16.3 | ||
Conservative hold | Swing |
The 2008 St Albans City and District Council election took place on 1 May 2008 to elect members of St Albans District Council in Hertfordshire, England. One third of the council was up for election and the Liberal Democrats gained overall control of the council from no overall control.
The 2004 St Albans City and District Council election took place on 10 June 2004 to elect members of St Albans District Council in Hertfordshire, England. One third of the council was up for election and the council stayed under no overall control.
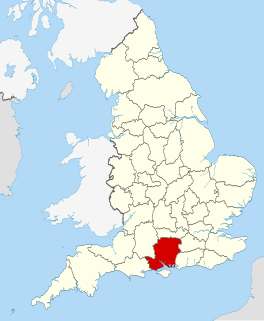
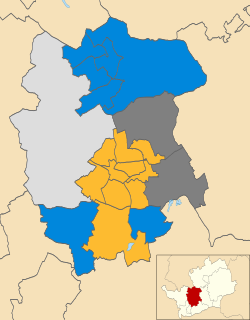
The 2010 Winchester Council election took place on 6 May 2010 to elect members of Winchester District Council in Hampshire, England. One third of the council was up for election and the Liberal Democrats gained overall control of the council from the Conservative party.
The 1999 Winchester Council election took place on 6 May 1999 to elect members of Winchester District Council in Hampshire, England. One third of the council was up for election and the Liberal Democrats stayed in overall control of the council.
The 2000 Winchester Council election took place on 4 May 2000 to elect members of Winchester District Council in Hampshire, England. One third of the council was up for election and the Liberal Democrats stayed in overall control of the council.
The 2003 Winchester Council election took place on 1 May 2003 to elect members of Winchester District Council in Hampshire, England. One third of the council was up for election and the Liberal Democrats stayed in overall control of the council.
The 2006 Winchester Council election took place on 4 May 2006 to elect members of Winchester District Council in Hampshire, England. One third of the council was up for election and the Conservative party gained overall control of the council from no overall control.
The 2007 Winchester Council election took place on 3 May 2007 to elect members of Winchester District Council in Hampshire, England. One third of the council was up for election and the Conservative party stayed in overall control of the council.
The 2008 Winchester Council election took place on 1 May 2008 to elect members of Winchester District Council in Hampshire, England. One third of the council was up for election and the Conservative party stayed in overall control of the council.
The 2004 Halton Borough Council election took place on 10 June 2004 to elect members of Halton Unitary Council in Cheshire, England. The whole council was up for election with boundary changes since the last election in 2002. The Labour party stayed in overall control of the council.
The 2000 Southampton Council election took place on 4 May 2000 to elect members of Southampton Unitary Council in Hampshire, England. One third of the council was up for election and the Labour party lost overall control of the council to no overall control.
The 2002 Fareham Council election took place on 2 May 2002 to elect members of Fareham Borough Council in Hampshire, England. The whole council was up for election with boundary changes since the last election in 2000 reducing the number of seats by 11. The Conservative party stayed in overall control of the council.
The 2004 Fareham Council election took place on 10 June 2004 to elect members of Fareham Borough Council in Hampshire, England. Half of the council was up for election and the Conservative party stayed in overall control of the council.
The 2010 Sunderland Council election took place on 6 May 2010 to elect members of Sunderland Metropolitan Borough Council in Tyne and Wear, England. One third of the council was up for election and the Labour party stayed in overall control of the council. The election took place on the same day as the 2010 General Election.
The 2003 Southampton Council election took place on 1 May 2003 to elect members of Southampton Unitary Council in Hampshire, England. One third of the council was up for election and the council stayed under no overall control.
The 2004 Southampton Council election took place on 10 June 2004 to elect members of Southampton Unitary Council in Hampshire, England. One third of the council was up for election and the council stayed under no overall control.
The 2008 Southampton Council election took place on 1 May 2008 to elect members of Southampton Unitary Council in Hampshire, England. One third of the council was up for election and the Conservative party gained overall control of the council from no overall control.
The 2004 Basingstoke and Deane Council election took place on 10 June 2004 to elect members of Basingstoke and Deane Borough Council in Hampshire, England. One third of the council was up for election and the council stayed under no overall control.
The 2006 Basingstoke and Deane Council election took place on 4 May 2006 to elect members of Basingstoke and Deane Borough Council in Hampshire, England. One third of the council was up for election and the council stayed under no overall control.
The 2010 Basingstoke and Deane Council election took place on 6 May 2010 to elect members of Basingstoke and Deane Borough Council in Hampshire, England. One third of the council was up for election and the Conservative party stayed in overall control of the council.
Preceded by Winchester Council election, 2003 | Winchester local elections | Succeeded by Winchester Council election, 2006 |