Affordability of housing in the United Kingdom

Last updated
The average price of a residential property in the UK as of 2019 UK Average House Price.png
The average price of a residential property in the UK as of 2019

The affordability of housing in the UK reflects the ability to rent or buy property. There are various ways to determine or estimate housing affordability. One commonly used metric is the median housing affordability ratio; this compares the median price paid for residential property to the median gross annual earnings for full-time workers. According to official government statistics, housing affordability worsened between 2020 and 2021, and since 1997 housing affordability has worsened overall, especially in London. The most affordable local authorities in 2021 were in the North West, Wales, Yorkshire and The Humber, West Midlands and North East. [1]

Contents

Housing tenure in the UK has the following main types: Owner-occupied, private rented sector (PRS), and social rented sector (SRS). [2] The affordability of housing in the UK varies widely on a regional basis – house prices and rents will differ as a result of market factors such as the state of the local economy, transport links, and the supply of housing.

Key determinants of affordability

For owner-occupied properties, key determinants of affordability are house prices, income, interest rates, and purchase costs. For rented property, PRS rents will largely be a reflection of house prices, while SRS rents are set by Local Authorities, Housing Associations or similar. [3] [4] [5]

House prices

Land Registry figures for England and Wales show that housing prices rose from £70,000 to £224,000 in the 20 years between 1998 and 2018. [6] Growth was almost continuous during the period, save for two years of decline around 2008 as a result of the banking crisis. [7]

House price averages compared to average salary

United Kingdom housing affordability as described by mortgage payments as a percentage of take-home pay from 1983 to 2015 UK housing affordability take home pay.png
United Kingdom housing affordability as described by mortgage payments as a percentage of take-home pay from 1983 to 2015
United Kingdom housing affordability as described by house price to earnings ratio from 1984 to 2015 UK housing affordability price earnings ratio.png
United Kingdom housing affordability as described by house price to earnings ratio from 1984 to 2015

The gap between average income and average housing prices changed between 1985 and 2015 from twice an average salary to up to six times average income. Median house prices in London the median house now cost up to 12 times the median London salary. In 1995, the median house price was £83,000, 4.4 times the median income. By 2012–13, the median income in London had increased to £24,600 and the median London house price had increased to £300,000, 12.2 times median income [8]

In 1995, the Bank base rate was 6%, in March 2009 it stood at 0.5% until August 2016 when it was further reduced to 0.25%. [9]

Effect of planning restrictions on house prices

A semi-detached house for sale in London zone 5 (Croydon) in 2007 Semi detached Croydon.JPG
A semi-detached house for sale in London zone 5 (Croydon) in 2007

An analysis by the LSE and the Dutch Bureau for Economic Policy Analysis found that house prices in England would have been 35% cheaper without regulatory constraints. [10] A report by the Adam Smith Institute found that by using 4% of London's green belt, one million homes could be built within a 10-minute walk of a railway station. [11]

The Economist has criticised green belt policy, saying that unless more houses are built through reforming planning laws and releasing green belt land, then housing space will need to be rationed out. It noted that if general inflation had risen as fast as housing prices had since 1971, a chicken would cost £51; and that Britain is "building less homes today than at any point since the 1920s". [12] According to the independent Institute of Economic Affairs, there is "overwhelming empirical evidence that planning restrictions have a substantial impact on housing costs" and are the main reason why housing was two and a half times more expensive in 2011 than it was in 1975. [13]

The Campaign to Protect Rural England argued that "Green Belt land is important for our wider environment, providing us with the trees and the undeveloped land which reduce the effect of the heat generated by big cities. Instead of reducing this green space, we should be using it to its best effect. We know from our research that three-quarters (79%) of the population would like to see more trees planted and more food grown in the areas around towns and cities." [14]

Valuation of land and effect on house prices

Value of land and buildings in the UK from 1995 to 2016 (trillions) Value of land and buildings in the UK.png
Value of land and buildings in the UK from 1995 to 2016 (trillions)

Property companies state that land values follow house prices and that a developer assesses what new build house price is achievable in any particular location with reference to prices and sales rates in the second-hand market and on nearby comparable new build sites. At a basic level (assuming no affordable housing, S106 or CIL), they then multiply that new build house price by the number of homes to be built on the land and to arrive at the gross development value (GDV) of the site. The underlying value of the land is then the GDV less the cost of development and less an allowance for profit. [16]

According to a study by Knoll, Schularick and Steger, up to 80% of the rise in houses prices between 1950 and 2012 can be attributed to the increasing price of land. [17] [18] This is for two reasons. Firstly, before 1950 improving transport meant that more and more land was economically usable, but this effect subsided after 1950. Secondly, zoning restrictions did not allow the "utilisation of additional land". [17]

In 2015, the Department for Communities and Local Government shared the land value estimates for residential land, agricultural land and industrial land. It found that the average price of a typical agricultural plot was £21,000. [19]

Property costs

The principal taxes imposed by the central government are Stamp Duty and Value Added Tax (VAT). Other costs which are associated with the buying and selling of property are estate agent fees, conveyancing and survey fees, mortgage arrangement fees (where applicable), and removal costs. [20]

Stamp duty land tax

Stamp duty land tax (SDLT) is payable on property transactions in England and Northern Ireland. Tax is paid at different rates on different portions of the purchase price. For example, on a £600,000 house, no tax is paid on the first £250,000, and the portion (£350,000) in the £250,000-£925,000 tax band is charged at 5%, i.e. £17,500. This gives a total tax of £17,500.

Purchase price of propertyRate of SDLT on portion of purchase price
£40,000 - £250,0000%
£250,001 to £925,0005%
£925,001 to £1,500,00010%
Over £1,500,00012%

Scotland and Wales apply their own tax to property transactions, replacing SDLT. Scotland introduced the Land and Buildings Transaction Tax in 2015, and Wales introduced the Land Transaction Tax in 2018.

Estate agent fees

In 2011, Which? magazine found the national average estate agents' fees to be 1.8%. [21] But fees can range between 0.75% to 3% depending on where you are in the UK. [22]

Survey

There are four main types of survey: a valuation survey, a condition report, a homebuyer report and a full structural survey. [23]

Conveyancing fees vary according to the value of the property and the service provided. [24]

Mortgage arrangement fees

In April 2013, The Daily Telegraph reported that research by Moneyfacts showed the average mortgage arrangement fee to be £1522. [25]

Housing shortage

In 2020, the BBC reported the UK's housing gap was in excess of one million homes, [26] and previously (in 2019) that "An estimated 8.4 million people in England are living in an unaffordable, insecure or unsuitable home, according to the National Housing Federation". [27] Unaffordable housing is defined by the Affordable Housing Commission as to where housing costs are above 30% of household income. [28] In a government briefing paper, 'Tackling the under-supply of housing in England', [29] Barton and Wilson describe England's housing need as being illustrated by issues "such as increased levels of overcrowding, acute affordability issues, more young people living with their parents for longer periods, impaired labour mobility resulting in businesses finding it difficult to recruit and retain staff, and increased levels of homelessness". [29]

Despite an added 244,000 homes to England's housing stock in 2019/20, the notion that an increased supply of housing will improve affordability has been challenged: the UK Housing Review (September 2017) states, "Indeed as the evidence to the Redfern Review from Oxford Economics reminds us, it is unlikely to bring house prices down except in the very long term and with sustained high output of new homes relative to household growth. Even boosting (UK) housing supply to 310,000 homes per annum in their model only brings a five per cent fall in the baseline forecast of house prices". [30] Therefore, the National Housing Federation (NHF) and Crisis from Heriot-Watt University argue that alongside the needed 340,000 new homes each year (until 2031), 145,000 of those “must be affordable homes”. [29] [31]

Other factors affecting affordability

Council tax

The Joseph Rowntree Foundation has suggested replacing the current Council tax system based on bands of house prices with a system that would mean the tax was more closely related to property prices. This would increase taxes on the highest-priced properties and decrease them for the lowest. They claim it would also have the effect of reducing house price volatility. [32]

Land value tax is suggested by some as a replacement for council tax; it would be based entirely on land (i.e. location) value and not on the value of buildings built on a piece of land or improvements made. [33] [34] [35]

International investment demand

In 2015, the Bow Group, a conservative think-tank, produced a report suggesting a reduction in international investment demand of property. The report proposed limiting foreign residents to the purchase of single new-build properties, with penalties if sold within five years. [36] In 2016, London mayor Sadiq Khan launched an inquiry into housing costs in the city, also highlighting the effect of foreign investment. [37]

Second home ownership

The government set up a £60 million fund to help councils deal with high levels of second home ownership. [38] In 2016, a referendum in St Ives, Cornwall found 83.2% of voters in favour of new housing projects being reserved for full-time residents, as many tourists frequent the area and Cornwall is popular for second home and holiday property ownership. [39]

Buy-to-let tax changes

From April 2016, a stamp duty surcharge of three per cent of the purchase price was required for those buying to let. From April 2017, buy-to-let mortgage interest payments will have higher rates of income tax relief phased out by the government. [40] Although, companies would not be affected by the new rules. [41]

Rented homes

The English Housing Survey Bulletin 13 [42] states that in 2013/14 there were 4.4 million households in the private rented sector and 3.9 million households in the social rented sector, of whom 2.3 million households (10%) were renting from a housing association and 1.6 million (7%) were renting from a local authority. Private renters had the highest weekly housing costs, paying on average £176 per week in rent. Mortgagors paid an average of £153 per week in mortgage payments while mean weekly rents in the social housing sector were £98 for housing association tenants and £89 for local authority tenants. When considering the gross weekly income, including benefits, of all household members, the proportion of income spent on housing costs was 18% for mortgagors, 29% for social renters, and 34% for private renters.[ citation needed ]

London

The demand for more affordable housing has often been higher in London than in the rest of the UK. [43] Research from Trust for London found that 24% of new housing completions in the three years to 2015/16 were affordable, which represented 21,500 homes. 6,700 affordable homes were completed in 2015/16, which is just 39% of the target set in the 2015 London Plan. [44] They also found that the amount of affordable homes being built varies significantly between the London Boroughs. Tower Hamlets delivered 1830 affordable homes in the three years to 2015/16, the most in London, while Bexley only delivered 7, the fewest in London. [45] Affordable housing is defined as housing that costs no more than 80% of the average local market rent. [46]

See also

Related Research Articles

This aims to be a complete list of the articles on real estate.

Owner-occupancy or home-ownership is a form of housing tenure in which a person, called the owner-occupier, owner-occupant, or home owner, owns the home in which they live. The home can be a house, such as a single-family house, an apartment, condominium, or a housing cooperative. In addition to providing housing, owner-occupancy also functions as a real estate investment.

<span class="mw-page-title-main">Real estate economics</span> Application of economic techniques to real estate markets

Real estate economics is the application of economic techniques to real estate markets. It tries to describe, explain, and predict patterns of prices, supply, and demand. The closely related field of housing economics is narrower in scope, concentrating on residential real estate markets, while the research on real estate trends focuses on the business and structural changes affecting the industry. Both draw on partial equilibrium analysis, urban economics, spatial economics, basic and extensive research, surveys, and finance.

In the United Kingdom, the Retail Prices Index or Retail Price Index (RPI) is a measure of inflation published monthly by the Office for National Statistics. It measures the change in the cost of a representative sample of retail goods and services.

Subsidized housing is government sponsored economic assistance aimed towards alleviating housing costs and expenses for impoverished people with low to moderate incomes. In the United States, subsidized housing is often called "affordable housing". Forms of subsidies include direct housing subsidies, non-profit housing, public housing, rent supplements/vouchers, and some forms of co-operative and private sector housing. According to some sources, increasing access to housing may contribute to lower poverty rates.

A real-estate bubble or property bubble is a type of economic bubble that occurs periodically in local or global real estate markets, and it typically follows a land boom. A land boom is a rapid increase in the market price of real property such as housing until they reach unsustainable levels and then declines. This period, during the run-up to the crash, is also known as froth. The questions of whether real estate bubbles can be identified and prevented, and whether they have broader macroeconomic significance, are answered differently by schools of economic thought, as detailed below.

Buy-to-let is a British phrase referring to the purchase of a property specifically to let out, that is to rent it out. A buy-to-let mortgage is a mortgage loan specifically designed for this purpose. Buy-to-let properties are usually residential but the term also encompasses student property investments and hotel room investments.

<span class="mw-page-title-main">Affordable housing</span> Housing affordable to those with a median household income

Affordable housing is housing which is deemed affordable to those with a household income at or below the median as rated by the national government or a local government by a recognized housing affordability index. Most of the literature on affordable housing refers to mortgages and a number of forms that exist along a continuum – from emergency homeless shelters, to transitional housing, to non-market rental, to formal and informal rental, indigenous housing, and ending with affordable home ownership.

<span class="mw-page-title-main">Workforce housing</span> Housing for low-income households near workplace

Workforce housing is a term that is increasingly used by planners, government, and organizations concerned with housing policy or advocacy. It is gaining cachet with realtors, developers and lenders. Workforce housing can refer to any form of housing, including ownership of single or multi-family homes, as well as occupation of rental units. Workforce housing is generally understood to mean affordable housing for households with earned income that is insufficient to secure quality housing in reasonable proximity to the workplace.

A starter home or starter house is a house that is usually the first which a person or family can afford to purchase, often using a combination of savings and mortgage financing. In the real estate industry the term commonly denotes small one- or two-bedroom houses, often older homes but sometimes low-cost new developments. The concept originated in the United States during the post-World War II era when entry-level home ownership was a preferred option for young families and regarded as part of the American Dream.

<span class="mw-page-title-main">Home ownership in Australia</span> Overview of home ownership in Australia

Home ownership in Australia is considered a key cultural icon, and part of the Australian tradition known as the Great Australian Dream of "owning a detached house on a fenced block of land." Home ownership has been seen as creating a responsible citizenry; according to a former Premier of Victoria: "The home owner feels that he has a stake in the country, and that he has something worth working for, living for, fighting for."

<span class="mw-page-title-main">Australian property bubble</span>

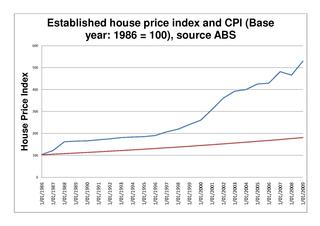
The Australian property bubble is the economic theory that the Australian property market has become or is becoming significantly overpriced and due for a significant downturn. Since the early 2010s, various commentators, including one Treasury official, have claimed the Australian property market is in a significant bubble.

A housing affordability index (HAI) is an index that measures housing affordability, usually the degree to which the median person or family in a particular country or region can afford housing/housing-related costs.

<span class="mw-page-title-main">Affordable housing in Canada</span>

Affordable housing in Canada is living spaces that are deemed financially accessible to those with a median household income in Canada. The property ladder continuum of affordable housing in Canada includes market, non-market, and government-subsidized housing.

<span class="mw-page-title-main">Housing in the United Kingdom</span> Overview of housing in the United Kingdom

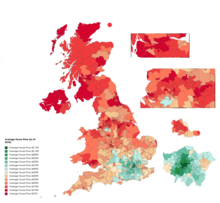
Housing in the United Kingdom represents the largest non-financial asset class in the UK; its overall net value passed the £5 trillion mark in 2014. Housing includes modern and traditional styles. About 30% of homes are owned outright by their occupants, and a further 40% are owner-occupied on a mortgage. About 18% are social housing of some kind, and the remaining 12% are privately rented.

<span class="mw-page-title-main">Median multiple</span> Housing indicator measure of affordability

The Median multiple or Median house price to income ratio is a housing indicator used to indicate the affordability of housing in any given community. The Median house price to income ratio WAS the primary indicator H1 of the 1991 World Bank/UNCHS Housing Indicator system. It was subsequently used as a measure of affordability by the UN Commission for Sustainable Development, the National Association of Realtors, State of the Environment 2003 Tasmania; and the Mortgage Guide UK along with many other organisations.

The property bubble in New Zealand is a major national economic and social issue. Since the early 1990s, house prices in New Zealand have risen considerably faster than incomes, putting increasing pressure on public housing providers as fewer households have access to housing on the private market. The property bubble has produced significant impacts on inequality in New Zealand, which now has one of the highest homelessness rate in the OECD and a record-high waiting list for public housing. Government policies have attempted to address the crisis since 2013, but have produced limited impacts to reduce prices or increase the supply of affordable housing. However, prices started falling in 2022 in response to tightening of mortgage availability and supply increasing. Some areas saw drops as high as around 9% - albeit from very high prices.

<span class="mw-page-title-main">California housing shortage</span> Extended and increasing shortage since 1970

Since about 1970, California has been experiencing an extended and increasing housing shortage, such that by 2018, California ranked 49th among the states of the U.S. in terms of housing units per resident. This shortage has been estimated to be 3-4 million housing units as of 2017. Experts say that California needs to double its current rate of housing production to keep up with expected population growth and prevent prices from further increasing, and needs to quadruple the current rate of housing production over the next seven years in order for prices and rents to decline.

<span class="mw-page-title-main">Affordable housing by country</span>

Affordable housing is housing that is deemed affordable to those with a median household income as rated by the national government or a local government by a recognized housing affordability index. A general rule is no more than 30% of gross monthly income should be spent on housing, to be considered affordable as the challenges of promoting affordable housing varies by location.

The Canadian property bubble refers to a significant rise in Canadian real estate prices from 2002 to present which some observers have called a real estate bubble. The Dallas Federal reserve rated Canadian real estate as "exuberant" beginning in 2003. From 2003 to 2018, Canada saw an increase in home and property prices of up to 337% in some cities. In 2016, the OECD warned that Canada's financial stability was at risk due to elevated housing prices, investment and household debt. By 2018, home-owning costs were above 1990 levels when Canada saw its last housing bubble burst. Bloomberg Economics ranked Canada as the second largest housing bubble across the OECD in 2019 and 2021. Toronto scored the highest in the world in Swiss bank UBS' real estate bubble index in 2022, with Vancouver also scoring among the 10 riskiest cities in the world. By 2023 Canada’s nonfinancial debt exceeded 300% of GDP and household debt surpassed 100% of GDP, both higher than the levels seen in the United States before the 2008 global financial crisis.

References

  1. "Housing affordability in England and Wales: 2021 - Office for National Statistics". www.ons.gov.uk. Retrieved 15 June 2022.
  2. "EHS 2013–14 Annual Reports published" (PDF). English Housing Survey Bulletin. No. 13. Retrieved 10 October 2017.
  3. "Analysis of the determinants of house price changes" (PDF). Ministry of Housing, Communities and Local Government. 13 April 2018. Archived (PDF) from the original on 4 July 2021. Retrieved 18 July 2021.
  4. "Rent setting: social housing (England)". House of Commons Library. Archived from the original on 2 June 2020. Retrieved 18 July 2021.
  5. "Housing affordability in England and Wales: 2016". Office for National Statistics. 17 March 2017. Archived from the original on 19 May 2021. Retrieved 18 July 2021.
  6. "House Price Statistics (from May 1998 to May 2018)".
  7. "Land Registry - search the house price index". Landregistry.data.gov.uk. Retrieved 6 January 2016.
  8. "The widening gulf between salaries and house prices". Theguardian.com. Retrieved 6 January 2016.
  9. "Bank of England Statistical Interactive Database | Interest & Exchange Rates | Official Bank Rate History". Bankofengland.co.uk. Retrieved 7 March 2016.
  10. "Why UK house prices have grown faster than anywhere else". Telegraph.co.uk. Retrieved 6 January 2016.
  11. "Green belt a "green noose", claims Adam Smith Institute". Environmentsite.com. Retrieved 6 January 2016.
  12. "Build on the green belt or introduce space rationing: your choice", Economist.com, retrieved 6 January 2016
  13. Kristian Niemietz (April 2012). "Abundance of land, shortage of housing : IEA Discussion Paper No. 38" (PDF). Iea.org.uk. Retrieved 6 January 2016.
  14. "Green Belts: breathing spaces for people and nature - Campaign to Protect Rural England". Cpre.org.uk. Retrieved 6 January 2016.
  15. "The UK national balance sheet: 2017 estimates". Ons.gov.uk. Retrieved 8 January 2018.
  16. "Savills UK | The value of land". Savills.co.uk. Retrieved 6 January 2016.
  17. 1 2 Katharina Knoll; Moritz Schularick; Thomas Steger (1 November 2014). "Home prices since 1870: No price like home". Archived from the original on 11 June 2021. Retrieved 18 July 2021.
  18. Josh Ryan-Collins. "How Land Disappeared from Economic Theory". Evonomics. Archived from the original on 9 June 2021. Retrieved 18 July 2021.
  19. "February 2015 Department for Communities and Local Government Land value estimates for policy appraisal" (PDF). Government of the United Kingdom. 2 February 2015. Retrieved 14 October 2021.
  20. "House Moving Costs". GetAgent.
  21. "Estate agents' fees exposed - March - 2011 - Which? News". Which.co.uk. 31 March 2011. Retrieved 23 September 2012.
  22. "Estate Agent Fees". GetAgent. Retrieved 15 June 2021.
  23. "What sort of property survey should you go for?". MoneySupermarket.com. 18 July 2011. Retrieved 29 December 2015.
  24. Choosing a conveyancer in 2013 by Graham Norwood in The Guardian , 15 February 2013. Retrieved 18 September 2013.
  25. Mortgage fees climb to new high Jessica Winch, The Telegraph , 9 April 2013. Retrieved 12 October 2013. Archived here.
  26. "Housing shortage: Scale of UK's housing gap revealed". BBC News. 23 February 2020. Retrieved 6 May 2021.
  27. "Housing crisis affects estimated 8.4 million in England - research". BBC News. 22 September 2019. Retrieved 7 May 2021.
  28. "Defining and measuring housing affordability – an alternative approach" (PDF). Nationwide Foundation.
  29. 1 2 3 Barton, Cassie; Wilson, Wendy (5 July 2021). "Tackling the under-supply of housing in England". House of Commons Library research Briefings.
  30. Stephens, Mark; Wilcox, Steve; Williams, Peter; Perry, John (2017). "2017 UK Housing Review Briefing" (PDF). Chartered Institute of Housing : 22.
  31. Bramley, Glen (April 2019). Housing supply requirements across Great Britain for low-income households and homeless people: Research for Crisis and the National Housing Federation; Main Technical Report. Heriot-Watt University. doi:10.17861/bramley.2019.04. ISBN   978-1-9161385-0-6.
  32. "After the Council Tax: impacts of property tax reform on people, places and house prices".
  33. Webb, Merryn (27 September 2013). "How a levy based on location values could be the perfect tax". Financial Times. Retrieved 14 May 2015.
  34. "Why Henry George had a point". The Economist. Retrieved 29 June 2017.
  35. Smith, Adam (1776). The Wealth of Nations, Book V, Chapter 2, Article I: Taxes upon the Rent of Houses. Ground-rents are a still more proper subject of taxation than the rent of houses. A tax upon ground-rents would not raise the rents of houses. It would fall altogether upon the owner of the ground-rent, who acts always as a monopolist and exacts the greatest rent which can be got for the use of his ground.
  36. Collinson, Patrick (21 November 2015). "Is it time to close the door to foreign buyers of British property?". The Guardian. Retrieved 22 February 2017.
  37. Taylor, Matthew; Phillips, Tom (30 September 2016). "London mayor launches unprecedented inquiry into foreign property ownership". The Guardian. Retrieved 22 February 2017.
  38. "Fund launched to tackle second home ownership problem". Archived from the original on 12 June 2018. Retrieved 18 July 2021.
  39. "St Ives referendum: Second homes ban backed by voters". BBC News. 6 May 2016. Retrieved 22 February 2017.
  40. Giles, Chris (6 April 2016). "New rules will do little to quell buy-to-let boom". FT. Retrieved 22 February 2017.
  41. Whiscombe, David (2 September 2015). "Squeeze on buy to let". Taxation. Retrieved 22 February 2017.
  42. "English housing survey bulletin: issue 13". Gov.uk. Retrieved 8 January 2018.
  43. "Changes to affordable housing in London and implications for delivery". Joseph Rowntree Foundation. Retrieved 7 June 2018.
  44. "London's Poverty Profile". Trust for London. Retrieved 7 June 2018.
  45. "London's Poverty Profile 2017". Trust for London. Retrieved 8 February 2018.
  46. "Reality Check: What is affordable housing?". BBC News. Retrieved 23 May 2019.