"}},"i":0}}]}"> [lower-alpha 1]
Mats Löfström (FÅ) was elected. [19]
Results of the 2015 parliamentary election held on 19 April 2015: [10] [20] [21] [22] [23]
Candidate | Party | List | Candidate | List | |||||||
---|---|---|---|---|---|---|---|---|---|---|---|
Votes | % | Votes | % | Seats | |||||||
Mats Löfström | Åland Centre | C | Åland Coalition (Centre, Moderates and Social Democrats) | ÅS | 5,217 | 42.81% | 10,910 | 89.52% | 1 | ||
Elisabeth Nauclér | Independent | 4,587 | 37.64% | ||||||||
Sara Kemetter | Åland Social Democrats | S | 864 | 7.09% | |||||||
Cecilia Jansson | Moderates of Åland | M | 242 | 1.99% | |||||||
Mats Perämaa | Liberals for Åland | L | Liberals for Åland | L | 874 | 7.17% | 1,277 | 10.48% | 0 | ||
Julia Birney | Liberals for Åland | L | 296 | 2.43% | |||||||
Kent Eriksson | Liberals for Åland | L | 107 | 0.88% | |||||||
Valid Votes | 12,187 | 100.00% | 12,187 | 100.00% | 1 | ||||||
Rejected Votes | 292 | 2.34% | |||||||||
Total Polled | 12,479 | 46.19% | |||||||||
Registered Electors | 27,017 |
Mats Löfström (ÅS) was elected. [24]
Results of the 2011 parliamentary election held on 17 April 2011: [10] [25] [26] [27] [28]
Candidate | Party | List | Candidate | List | |||||||
---|---|---|---|---|---|---|---|---|---|---|---|
Votes | % | Votes | % | Seats | |||||||
Elisabeth Nauclér | Non-aligned Coalition | ObS | Åland Coalition (Centre, Future of Åland, Non-aligned Coalition and Social Democrats) | ÅS | 6,925 | 65.93% | 8,546 | 81.37% | 1 | ||
Christian Beijar | Åland Social Democrats | S | 802 | 7.64% | |||||||
Henry Lindström | Åland Centre | C | 425 | 4.05% | |||||||
Axel Jonsson | Future of Åland | AF | 394 | 3.75% | |||||||
Johan Ehn | Moderates of Åland | M | Alliance for Åland (Liberals and Moderates) | AfÅ | 845 | 8.05% | 1,957 | 18.63% | 0 | ||
Tony Asumaa | Liberals for Åland | L | 736 | 7.01% | |||||||
Lennart Isaksson | Moderates of Åland | M | 240 | 2.29% | |||||||
Eva Ekström-Andersen | Liberals for Åland | L | 136 | 1.29% | |||||||
Valid Votes | 10,503 | 100.00% | 10,503 | 100.00% | 1 | ||||||
Rejected Votes | 251 | 2.33% | |||||||||
Total Polled | 10,754 | 41.18% | |||||||||
Registered Electors | 26,114 |
Elisabeth Nauclér (ÅS) was elected. [29]
Results of the 2007 parliamentary election held on 18 March 2007: [10] [30] [31] [32] [33]
Candidate | Party | List | Candidate | List | |||||||
---|---|---|---|---|---|---|---|---|---|---|---|
Votes | % | Votes | % | Seats | |||||||
Elisabeth Nauclér | Non-aligned Coalition | ObS | Civic Alliance (Centre, Freeminded Co-operation, Liberals and Non-aligned Coalition) | BA | 4,388 | 39.29% | 9,561 | 85.61% | 1 | ||
Roger Eriksson | Liberals for Åland | L | 4,024 | 36.03% | |||||||
Magnus Lundberg | Åland Centre | C | 1,149 | 10.29% | |||||||
Barbro Sundback | Åland Social Democrats | S | Åland Social Democrats | S | 756 | 6.77% | 1,607 | 14.39% | 0 | ||
Camilla Gunell | Åland Social Democrats | S | 395 | 3.54% | |||||||
Kaj Grundström | Åland Social Democrats | S | 340 | 3.04% | |||||||
Martin Nilsson | Åland Social Democrats | S | 116 | 1.04% | |||||||
Valid Votes | 11,168 | 100.00% | 11,168 | 100.00% | 1 | ||||||
Rejected Votes | 348 | 3.02% | |||||||||
Total Polled | 11,516 | 45.86% | |||||||||
Registered Electors | 25,111 |
Elisabeth Nauclér (BA) was elected. [34]
Results of the 2003 parliamentary election held on 16 March 2003: [10] [35] [36] [37] [38]
Candidate | Party | List | Candidate | List | |||||||
---|---|---|---|---|---|---|---|---|---|---|---|
Votes | % | Votes | % | Seats | |||||||
Roger Jansson | Freeminded Co-operation | FS | For Åland (Freeminded Co-operation and Non-aligned Coalition) | FÅ | 3,125 | 26.82% | 4,306 | 36.96% | 1 | ||
Bert Häggblom | Non-aligned Coalition | ObS | 735 | 6.31% | |||||||
Gun-Mari Lindholm | Non-aligned Coalition | ObS | 358 | 3.07% | |||||||
Nina Danielsson | Freeminded Co-operation | FS | 88 | 0.76% | |||||||
Roger Eriksson | Liberals for Åland | L | Security and Development (Liberals) | 1,874 | 16.08% | 3,323 | 28.52% | 0 | |||
Folke Sjölund | Liberals for Åland | L | 834 | 7.16% | |||||||
Raija-Liisa Eklöw | Liberals for Åland | L | 520 | 4.46% | |||||||
Inger Rosenberg-Mattsson | Liberals for Åland | L | 95 | 0.82% | |||||||
Barbro Sundback | Åland Social Democrats | S | Åland Social Democrats | S | 2,471 | 21.21% | 2,904 | 24.92% | 0 | ||
Carina Aaltonen | Åland Social Democrats | S | 166 | 1.42% | |||||||
Cecilia Mattsson | Åland Social Democrats | S | 158 | 1.36% | |||||||
Leena Raitanen | Åland Social Democrats | S | 109 | 0.94% | |||||||
Britt Lundberg | Åland Centre | C | Commitment and Self-Government (Centre) | 745 | 6.39% | 1,118 | 9.60% | 0 | |||
Runar Karlsson | Åland Centre | C | 265 | 2.27% | |||||||
Tom Blomberg | Åland Centre | C | 63 | 0.54% | |||||||
Erica Sjöström | Åland Centre | C | 45 | 0.39% | |||||||
Valid Votes | 11,651 | 100.00% | 11,651 | 100.00% | 1 | ||||||
Rejected Votes | 299 | 2.50% | |||||||||
Total Polled | 11,950 | 47.98% | |||||||||
Registered Electors | 24,908 |
Roger Jansson (FÅ) was elected. [39]
Results of the 1999 parliamentary election held on 21 March 1999: [10] [40] [41] [42] [43]
Candidate | Party | List | Candidate | List | |||||||
---|---|---|---|---|---|---|---|---|---|---|---|
Votes | % | Votes | % | Seats | |||||||
Gunnar Jansson | Liberals for Åland | L | Middle List (Liberals) | ML | 5,150 | 49.18% | 5,870 | 56.05% | 1 | ||
Viveca Eriksson | Liberals for Åland | L | 297 | 2.84% | |||||||
Raija-Liisa Eklöw | Liberals for Åland | L | 267 | 2.55% | |||||||
Olof Öström | Liberals for Åland | L | 156 | 1.49% | |||||||
Ragnar Erlandsson | Åland Centre | C | For Åland (Centre, Freeminded Co-operation and Non-aligned Coalition) | FÅ | 2,672 | 25.52% | 3,678 | 35.12% | 0 | ||
Gun Carlsson | Åland Centre | C | 365 | 3.49% | |||||||
Gun-Mari Lindholm | Non-aligned Coalition | ObS | 329 | 3.14% | |||||||
Johan Rothberg | Freeminded Co-operation | FS | 312 | 2.98% | |||||||
Lasse Wiklöf | Åland Social Democrats | S | Åland Social Democrats | S | 447 | 4.27% | 924 | 8.82% | 0 | ||
Barbro Sundback | Åland Social Democrats | S | 300 | 2.86% | |||||||
Anna-Helena Sjöblom | Åland Social Democrats | S | 91 | 0.87% | |||||||
Henrik Lagerberg | Åland Social Democrats | S | 86 | 0.82% | |||||||
Valid Votes | 10,472 | 100.00% | 10,472 | 100.00% | 1 | ||||||
Rejected Votes | 149 | 1.40% | |||||||||
Total Polled | 10,621 | 43.13% | |||||||||
Registered Electors | 24,623 |
Gunnar Jansson (ML) was elected. [44]
Results of the 1995 parliamentary election held on 19 March 1995: [10] [45] [46] [47] [48]
Candidate | Party | List | Candidate | List | |||||||
---|---|---|---|---|---|---|---|---|---|---|---|
Votes | % | Votes | % | Seats | |||||||
Gunnar Jansson | Liberals for Åland | L | Liberals for Åland | L | 5,199 | 52.49% | 6,038 | 60.96% | 1 | ||
Gunnevi Nordman | Liberals for Åland | L | 353 | 3.56% | |||||||
Lotta Wickström-Johansson | Liberals for Åland | L | 271 | 2.74% | |||||||
Sune Eriksson | Liberals for Åland | L | 215 | 2.17% | |||||||
Per Ekström | Civic Coalition (Centre, Freeminded Co-operation and Non-aligned Coalition) | BS | 1,533 | 15.48% | 2,958 | 29.86% | 0 | ||||
Kerstin Alm | Åland Centre | C | 1,168 | 11.79% | |||||||
Airi Pettersson | 161 | 1.63% | |||||||||
Rolf Nordlund | 96 | 0.97% | |||||||||
Lasse Wiklöf | Åland Social Democrats | S | Åland Social Democrats | S | 668 | 6.74% | 909 | 9.18% | 0 | ||
Anna-Helena Sjöblom | Åland Social Democrats | S | 241 | 2.43% | |||||||
Valid Votes | 9,905 | 100.00% | 9,905 | 100.00% | 1 | ||||||
Rejected Votes | 80 | 0.80% | |||||||||
Total Polled | 9,985 | 40.66% | |||||||||
Registered Electors | 24,557 |
Gunnar Jansson (L) was elected. [45]
Results of the 1991 parliamentary election held on 17 March 1991: [10] [49] [50] [51] [52] [53]
Candidate | Party | List | Candidate | List | |||||||
---|---|---|---|---|---|---|---|---|---|---|---|
Votes | % | Votes | % | Seats | |||||||
Gunnar Jansson | Liberals for Åland | L | List C (Freeminded Co-operation, Greens, Liberals and Non-aligned Coalition) | LC | 5,753 | 61.57% | 6,546 | 70.06% | 1 | ||
Karl-Göran Eriksson | Freeminded Co-operation | FS | 409 | 4.38% | |||||||
Mirjam Öberg | Liberals for Åland | L | 289 | 3.09% | |||||||
Ulf Eklund | 95 | 1.02% | |||||||||
Olof Salmén | Åland Centre | C | Åland Centre | C | 790 | 8.45% | 1,858 | 19.88% | 0 | ||
Ragnar Erlandsson | Åland Centre | C | 606 | 6.49% | |||||||
Göran Bengtz | Åland Centre | C | 316 | 3.38% | |||||||
Runa Lisa Jansson | Åland Centre | C | 146 | 1.56% | |||||||
Lasse Wiklöf | Åland Social Democrats | S | Åland Social Democrats | S | 536 | 5.74% | 940 | 10.06% | 0 | ||
Barbro Sundback | Åland Social Democrats | S | 231 | 2.47% | |||||||
Jutta Lemberg-Lindqvist | Åland Social Democrats | S | 111 | 1.19% | |||||||
Kurt Gustafsson | Åland Social Democrats | S | 62 | 0.66% | |||||||
Valid Votes | 9,344 | 100.00% | 9,344 | 100.00% | 1 | ||||||
Blank Votes | 94 | 0.99% | |||||||||
Rejected Votess – Other | 28 | 0.30% | |||||||||
Total Polled | 9,466 | 38.47% | |||||||||
Registered Electors | 24,605 |
Gunnar Jansson (LC) was elected. [49]
Results of the 1987 parliamentary election held on 15 and 16 March 1987: [10] [54] [55] [56] [57] [58]
Candidate | Party | List | Candidate | List | |||||||
---|---|---|---|---|---|---|---|---|---|---|---|
Votes | % | Votes | % | Seats | |||||||
Gunnar Jansson | Liberals for Åland | L | List A (Liberals and Social Democrats) | LA | 5,927 | 63.05% | 7,019 | 74.66% | 1 | ||
Susanne Eriksson | Åland Social Democrats | S | 1,092 | 11.62% | |||||||
Anders Eriksson | Åland Centre | C | Lits B / Civic Alternative (Centre and Freeminded Co-operation) | BA | 967 | 10.29% | 1,843 | 19.60% | 0 | ||
Mikael Lönnqvist | 408 | 4.34% | |||||||||
Johan Rothberg | Freeminded Co-operation | FS | 268 | 2.85% | |||||||
Ingvar Björling | Åland Centre | C | 200 | 2.13% | |||||||
Sten Sundman | Free Åland | FÅ | Independent | 539 | 5.73% | 539 | 5.73% | 0 | |||
Valid Votes | 9,401 | 100.00% | 9,401 | 100.00% | 1 | ||||||
Rejected Votes | 106 | 1.11% | |||||||||
Total Polled | 9,507 | 39.04% | |||||||||
Registered Electors | 24,349 |
Gunnar Jansson (LA) was elected. [54]
Results of the 1983 parliamentary election held on 20 and 21 March 1983: [10] [59] [60] [61] [62] [63] [64]
Candidate | Party | List | Candidate | List | |||||||
---|---|---|---|---|---|---|---|---|---|---|---|
Votes | % | Votes | % | Seats | |||||||
Gunnar Jansson | Liberals for Åland | L | List 3 | L3 | 5,754 | 60.84% | 5,754 | 60.84% | 1 | ||
Gunnar Häggblom | Åland Centre | C | List 2 | L2 | 3,704 | 39.16% | 3,704 | 39.16% | 0 | ||
Valid Votes | 9,458 | 100.00% | 9,458 | 100.00% | 1 | ||||||
Rejected Votes | 112 | 1.17% | |||||||||
Total Polled | 9,570 | 39.72% | |||||||||
Registered Electors | 24,095 |
Gunnar Jansson (L3) was elected. [59]
Results of the 1979 parliamentary election held on 18 and 19 March 1979: [10] [65] [66] [67] [68]
Candidate | Party | List | Candidate | List | |||||||
---|---|---|---|---|---|---|---|---|---|---|---|
Votes | % | Votes | % | Seats | |||||||
Gunnar Häggblom | Åland Centre | C | Åland Coalition | AS | 3,451 | 36.59% | 9,286 | 98.45% | 1 | ||
Alarik Häggblom | Liberals for Åland | L | 2,802 | 29.71% | |||||||
Lasse Wiklöf | Åland Social Democrats | S | 1,992 | 21.12% | |||||||
Jan-Erik Lindfors | Freeminded Co-operation | FS | 1,041 | 11.04% | |||||||
Gunnar Johansson | Finnish People's Democratic League | SKDL | Finnish People's Democratic League | SKDL | 146 | 1.55% | 146 | 1.55% | 0 | ||
Valid Votes | 9,432 | 100.00% | 9,432 | 100.00% | 1 | ||||||
Rejected Votes | 36 | 0.38% | |||||||||
Total Polled | 9,468 | 39.01% | |||||||||
Registered Electors | 24,269 |
Gunnar Häggblom (AS) was elected. [65]
Results of the 1975 parliamentary election held on 21 and 22 September 1975: [10] [69] [70] [71] [72] [73]
Candidate | List | Candidate | List | |||||
---|---|---|---|---|---|---|---|---|
Votes | % | Votes | % | Seats | ||||
Evald Häggblom | Åland Coalition | AS | 5,836 | 61.55% | 9,482 | 100.00% | 1 | |
Folke Woivalin | 3,646 | 38.45% | ||||||
Valid Votes | 9,482 | 100.00% | 9,482 | 100.00% | 1 | |||
Rejected Votes | 116 | 1.21% | ||||||
Total Polled | 9,598 | 39.82% | ||||||
Registered Electors | 24,103 |
Evald Häggblom (AS) was elected. [69]
Results of the 1972 parliamentary election held on 2 and 3 January 1972: [10] [74] [75] [76] [77]
Candidate | List | Candidate | List | |||||
---|---|---|---|---|---|---|---|---|
Votes | % | Votes | % | Seats | ||||
Evald Häggblom | Swedish People's Party of Finland | SFP | 5,189 | 67.64% | 5,189 | 67.64% | 1 | |
Tage Boman | Åland Coalition | AS | 2,072 | 27.01% | 2,483 | 32.36% | 0 | |
Sven Lemberg | 411 | 5.36% | ||||||
Valid Votes | 7,672 | 67.64% | 7,672 | 67.64% | 1 | |||
Rejected Votes | 34 | 0.44% | ||||||
Total Polled | 7,706 | 51.50% | ||||||
Registered Electors | 14,962 |
Evald Häggblom (SFP) was elected. [74]
Results of the 1970 parliamentary election held on 15 and 16 March 1970: [10] [78] [79] [80] [81]
Candidate | List | Candidate | List | |||||
---|---|---|---|---|---|---|---|---|
Votes | % | Votes | % | Seats | ||||
Evald Häggblom | Swedish People's Party of Finland | SFP | 6,857 | 76.44% | 6,857 | 76.44% | 1 | |
Sven Lemberg | Åland Coalition | AS | 936 | 10.43% | 1,079 | 12.03% | 0 | |
Olof Lindström | 143 | 1.59% | ||||||
Elis Andersson | Independent | 890 | 9.92% | 890 | 9.92% | 0 | ||
Rickard Lindroth | Finnish People's Democratic League | SKDL | 145 | 1.62% | 145 | 1.62% | 0 | |
Valid Votes | 8,971 | 100.00% | 8,971 | 100.00% | 1 | |||
Rejected Votes | 28 | 0.31% | ||||||
Total Polled | 8,999 | 60.94% | ||||||
Registered Electors | 14,767 |
Evald Häggblom (SFP) was elected. [78]
Results of the 1966 parliamentary election held on 20 and 21 March 1966: [10] [82] [83] [84] [85] [86] [87]
Candidate | List | Candidate | List | |||||
---|---|---|---|---|---|---|---|---|
Votes | % | Votes | % | Seats | ||||
Evald Häggblom | Åland Coalition | AS | 3,858 | 54.20% | 6,856 | 96.32% | 1 | |
Elis Andersson | 2,998 | 42.12% | ||||||
Rickard Lindroth | Finnish People's Democratic League | SKDL | 261 | 3.67% | 261 | 3.67% | 0 | |
Write-in lists | 1 | 0.01% | 1 | 0.01% | 0 | |||
Valid Votes | 7,118 | 100.00% | 7,118 | 100.00% | 1 | |||
Blank Votes | 2 | 0.03% | ||||||
Rejected Votess – Other | 39 | 0.54% | ||||||
Total Polled | 7,159 | 50.67% | ||||||
Registered Electors | 14,129 |
Evald Häggblom (AS) was elected. [82]
Results of the 1962 parliamentary election held on 4 and 5 February 1962: [10] [88] [89] [90] [91] [92] [93]
Candidate | List | Candidate | List | |||||
---|---|---|---|---|---|---|---|---|
Votes | % | Votes | % | Seats | ||||
Elis Andersson | Swedish People's Party of Finland | SFP | 5,486 | 75.55% | 6,966 | 95.94% | 1 | |
Harry Lindfors | 1,480 | 20.38% | ||||||
Rickard Lindroth | Finnish People's Democratic League | SKDL | 295 | 4.06% | 295 | 4.06% | 0 | |
Valid Votes | 7,261 | 100.00% | 7,261 | 100.00% | 1 | |||
Rejected Votes | 28 | 0.38% | ||||||
Total Polled | 7,289 | 51.58% | ||||||
Registered Electors | 14,131 |
Elis Andersson (SFP) was elected. [88]
Results of the 1958 parliamentary election held on 6 and 7 July 1958: [10] [94] [95] [96] [97] [98] [99]
Candidate | List | Candidate | List | |||||
---|---|---|---|---|---|---|---|---|
Votes | % | Votes | % | Seats | ||||
Arthur Larson | Swedish People's Party of Finland | SFP | 3,345 | 60.96% | 4,523 | 82.43% | 1 | |
Valter Nordas | 1,178 | 21.47% | ||||||
Tore Hansen | Social Democratic Party of Finland | SDP | 676 | 12.32% | 676 | 12.32% | 0 | |
Rickard Lindroth | Finnish People's Democratic League | SKDL | 286 | 5.21% | 286 | 5.21% | 0 | |
Write-in lists | 2 | 0.04% | 2 | 0.04% | 0 | |||
Valid Votes | 5,487 | 100.00% | 5,487 | 100.00% | 1 | |||
Rejected Votes | 29 | 0.53% | ||||||
Total Polled | 5,516 | 38.60% | ||||||
Registered Electors | 14,292 |
Arthur Larson (SFP) was elected. [94]
Results of the 1954 parliamentary election held on 7 and 8 March 1954: [10] [100] [101] [102] [103] [104]
Candidate | List | Candidate | List | |||||
---|---|---|---|---|---|---|---|---|
Votes | % | Votes | % | Seats | ||||
Arthur Larson | Swedish People's Party of Finland | SFP | 4,367 | 93.79% | 4,367 | 93.79% | 1 | |
Rauha Åkerblom | Finnish People's Democratic League | SKDL | 277 | 5.95% | 277 | 5.95% | 0 | |
Write-in lists | 12 | 0.26% | 12 | 0.26% | 0 | |||
Valid Votes | 4,656 | 100.00% | 4,656 | 100.00% | 1 | |||
Rejected Votes | 44 | 0.94% | ||||||
Total Polled | 4,700 | 33.12% | ||||||
Registered Electors | 14,190 |
Arthur Larson (SFP) was elected. [105]
Results of the 1951 parliamentary election held on 1 and 2 July 1951: [10] [106] [107] [108] [109]
Candidate | List | Candidate | List | |||||
---|---|---|---|---|---|---|---|---|
Votes | % | Votes | % | Seats | ||||
Arthur Larson | Swedish People's Party of Finland | SFP | 5,452 | 95.88% | 5,452 | 95.88% | 1 | |
Rauha Åkerblom | Finnish People's Democratic League | SKDL | 228 | 4.01% | 228 | 4.01% | 0 | |
Write-in lists | 6 | 0.11% | 6 | 0.11% | 0 | |||
Valid Votes | 5,686 | 100.00% | 5,686 | 100.00% | 1 | |||
Rejected Votes | 81 | 1.40% | ||||||
Total Polled | 5,767 | 38.80% | ||||||
Registered Electors | 14,865 |
Arthur Larson (SFP) was elected. [110]
Results of the 1948 parliamentary election held on 1 and 2 July 1948: [10] [111] [112] [113]
Candidate | List | Candidate | List | |||||
---|---|---|---|---|---|---|---|---|
Votes | % | Votes | % | Seats | ||||
Arthur Larson | Swedish People's Party of Finland | SFP | 6,279 | 95.61% | 1 | |||
Paul E. Paulson | ||||||||
Atos Wirtanen | Finnish People's Democratic League | SKDL | 282 | 97.92% | 282 | 4.29% | 0 | |
Write-in lists | 6 | 2.08% | 6 | 0.09% | 0 | |||
Valid Votes | 6,567 | 100.00% | 6,567 | 100.00% | 1 | |||
Rejected Votes | 60 | 17.24% | ||||||
Total Polled | 348 | 2.41% | ||||||
Registered Electors | 14,451 |
Arthur Larson (SFP) was elected. [114]
Varsinais-Suomi is one of the 13 electoral districts of the Parliament of Finland, the national legislature of Finland. The district was established as Turku and Pori Province South in 1907 when the Diet of Finland was replaced by the Parliament of Finland. It was renamed Varsinais-Suomi in 1997. It is conterminous with the region of Southwest Finland. The district currently elects 17 of the 200 members of the Parliament of Finland using the open party-list proportional representation electoral system. At the 2023 parliamentary election it had 398,903 registered electors.
Helsinki is one of the 13 electoral districts of the Parliament of Finland, the national legislature of Finland. The district was established as Helsinki City in 1954 from parts of Uusimaa Province. It was renamed Helsinki in 1997. It is conterminous with the municipality of Helsinki. The district currently elects 23 of the 200 members of the Parliament of Finland using the open party-list proportional representation electoral system. At the 2023 parliamentary election it had 546,375 registered electors.
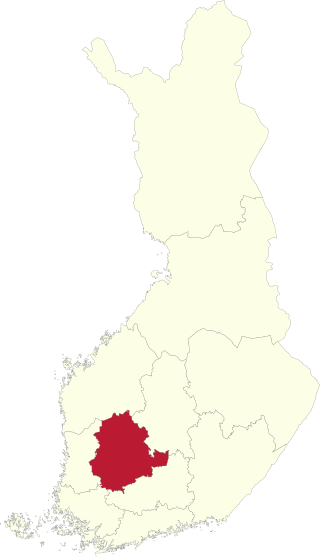
Central Finland is one of the 13 electoral districts of the Parliament of Finland, the national legislature of Finland. The district was established as Vaasa Province East in 1907 when the Diet of Finland was replaced by the Parliament of Finland. It was renamed Central Finland Province in 1960 and Central Finland in 1997. It is conterminous with the region of Central Finland. The district currently elects 10 of the 200 members of the Parliament of Finland using the open party-list proportional representation electoral system. At the 2023 parliamentary election it had 226,335 registered electors.
Oulu is one of the 13 electoral districts of the Parliament of Finland, the national legislature of Finland. The district was established as Oulu Province South in 1907 when the Diet of Finland was replaced by the Parliament of Finland. It was renamed Oulu Province in 1939 and Oulu in 1997. It is conterminous with the regions of Kainuu and North Ostrobothnia. The district currently elects 18 of the 200 members of the Parliament of Finland using the open party-list proportional representation electoral system. At the 2023 parliamentary election it had 393,643 registered electors.
Pirkanmaa is one of the 13 electoral districts of the Parliament of Finland, the national legislature of Finland. The district was established as Häme Province North in 1907 when the Diet of Finland was replaced by the Parliament of Finland. It was renamed Pirkanmaa in 1997. It is conterminous with the region of Pirkanmaa. The district currently elects 20 of the 200 members of the Parliament of Finland using the open party-list proportional representation electoral system. At the 2023 parliamentary election it had 437,155 registered electors.
Satakunta is one of the 13 electoral districts of the Parliament of Finland, the national legislature of Finland. The district was established as Turku and Pori Province North in 1907 when the Diet of Finland was replaced by the Parliament of Finland. It was renamed Satakunta in 1997. It is conterminous with the region of Satakunta. The district currently elects eight of the 200 members of the Parliament of Finland using the open party-list proportional representation electoral system. At the 2023 parliamentary election it had 176,653 registered electors.
Häme is one of the 13 electoral districts of the Parliament of Finland, the national legislature of Finland. The district was established as Häme Province South in 1907 when the Diet of Finland was replaced by the Parliament of Finland. It was renamed Häme in 1997. It is conterminous with the regions of Kanta-Häme and Päijät-Häme. The district currently elects 14 of the 200 members of the Parliament of Finland using the open party-list proportional representation electoral system. At the 2023 parliamentary election it had 310,047 registered electors.
Uusimaa is one of the 13 electoral districts of the Parliament of Finland, the national legislature of Finland. The district was established as Uusimaa Province in 1907 when the Diet of Finland was replaced by the Parliament of Finland. It was renamed Uusimaa in 1997. It is conterminous with the region of Uusimaa but excludes the municipality of Helsinki which has its own electoral district. The district currently elects 37 of the 200 members of the Parliament of Finland using the open party-list proportional representation electoral system. At the 2023 parliamentary election it had 801,205 registered electors.
Vaasa is one of the 13 electoral districts of the Parliament of Finland, the national legislature of Finland. The district was established in 1960 by the merger of Vaasa Province North and Vaasa Province South districts. It is conterminous with the regions of Central Ostrobothnia, Ostrobothnia and South Ostrobothnia. The district currently elects 16 of the 200 members of the Parliament of Finland using the open party-list proportional representation electoral system. At the 2023 parliamentary election it had 365,027 registered electors.
Parliamentary elections were held in Finland on 17 and 18 March 1945. The broad-based centre-left government of Prime Minister Juho Kusti Paasikivi remained in office after the elections.
Parliamentary elections were held in Finland on 6 and 7 July 1958. The communist Finnish People's Democratic League emerged as the largest party, but was unable to form a government.
Parliamentary elections were held in Finland on 1 and 2 July 1951.
Parliamentary elections were held in Finland on 4 and 5 February 1962.
Parliamentary elections were held in Finland on 20 and 21 March 1966. The Social Democratic Party (SDP) overtook the Centre Party as the largest faction in Parliament. Rafael Paasio of the SDP subsequently became Prime Minister and formed a popular front government consisting of the SDP, the Centre Party, the People's Democratic League (SKDL), and the Social Democratic Union of Workers and Smallholders (TPSL) in May 1966.
Parliamentary elections were held in Finland on 15 and 16 March 1970.
Parliamentary elections were held in Finland on 2 and 3 January 1972.
Parliamentary elections were held in Finland on 21 and 22 September 1975.
Parliamentary elections were held in Finland on 18 and 19 March 1979.
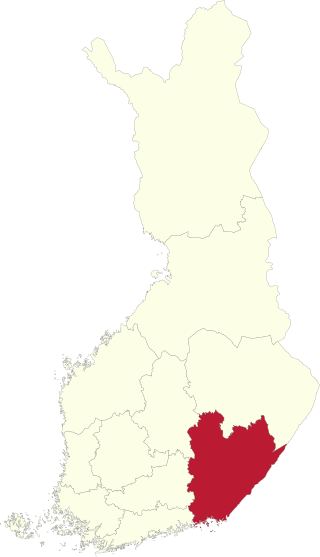
Southeast Finland is one of the 13 electoral districts of the Parliament of Finland, the national legislature of Finland. The district was established in 2013 by the merger of Kymi and South Savo districts. It is conterminous with the regions of Kymenlaakso, South Karelia and South Savo. The district currently elects 15 of the 200 members of the Parliament of Finland using the open party-list proportional representation electoral system. At the 2023 parliamentary election it had 353,468 registered electors.
Savo-Karelia is one of the 13 electoral districts of the Parliament of Finland, the national legislature of Finland. The district was established in 2013 by the merger of North Karelia and North Savo districts. It is conterminous with the regions of North Karelia and North Savo. The district currently elects 15 of the 200 members of the Parliament of Finland using the open party-list proportional representation electoral system. At the 2023 parliamentary election it had 343,887 registered electors.