The 1911–16 Australian drought consisted of a series of droughts that affected various regions of Australia between the years of 1911 and 1916. Most of the dry spells during this period can be related to three El Niño events in 1911, 1913 and 1914, though rainfall deficiencies actually began in northern Australia before the first of these El Niños set in and did not ease in coastal districts of New South Wales until well after the last El Niño had firmly dissipated and trends toward very heavy rainfall developed in other areas of the continent.
The years before the drought had generally had satisfactory rainfall with impressive crop yields throughout most of the continent with the exception of the Gippsland region, the coastal districts of New South Wales and southeastern Queensland. In these areas, the rainfall deficiencies of the Federation Drought had never disappeared at any point during the decade of the 1900s.
At the beginning of the year, a strong La Niña event was producing heavy rain over eastern Australia. January was the wettest on record in Sydney, and February was a phenomenally wet month in Victoria and southwestern New South Wales, with places like Pooncarie on the lower Darling River recording 190 millimetres (7.5 in) for the month. Averaged over Victoria, February 1911 stands as the third-wettest month since 1885 after October 1975 and February 1973. Heavy monsoonal rain drenched Queensland throughout the summer. These months, however, were virtually rainless in the southwestern quarter of the continent and quite dry in the Kimberley and Top End.
Early March saw exceptionally heavy rains in southern Victoria and eastern Tasmania: Melbourne's rainfall of 191 millimetres (7.5 in) remains a March record. However, in the Top End and Kimberley, drought was already established as Darwin had its driest March in 138 years of record with only 21 millimetres (0.83 in) as against an average of 290 millimetres (11 in). April saw some good late wet season rains in the north due to a severe tropical cyclone drenching Port Douglas with a daily fall of 801 millimetres (31.5 in) and promising rains in southwestern Australia. [1]
However, despite the "big wet" continuing in southern Victoria through May and June, southwestern Australia and to lesser extent the settled parts of South Australia and southeast Queensland began to have major rainfall deficiencies in those months. By August dry conditions were, as is usual for El Niño years, general except in coastal districts of New South Wales and the southeast of Western Australia. Southwestern Australia was particularly hard-hit: wheat crops failed completely in many places and led to a revolution in water supply and farming techniques to cope with rainfalls lower than previously known. [2] In the humid forest belt, 1911 was the driest year of the twentieth century at Margaret River and Cape Leeuwin and even the Warren River, the most nearly perennial river in all of WA, ceased to flow during the ensuing summer.
Apart from one big September fall in Victoria, dry and often hot conditions did not ease until one of the heaviest downpours ever known in Western Queensland fell in late November. This was followed by heavy general falls in December except in Queensland and northeastern New South Wales. November was the driest on record in many parts of western Victoria and eastern Queensland.
The hopes the good December rains gave soon disappeared as January was exceptionally dry almost throughout the continent except for a few normally-dry areas between Perth and Geraldton. Major tropical cyclones provided respite to the Kimberley in February and the Eucla in March, whilst a small coastal belt of the Wet Tropics had exceptionally heavy rainfall in April and May, with Innisfail recording 2,600 millimetres (100 in) for those two months. [3]
However, elsewhere exceptionally dry conditions continued until a series of low pressure systems in June and July provided record-breaking rainfalls for that time of year in inland Queensland and New South Wales. Indeed, the winter averaged over those two states was nearly as wet as those of 1950 and 1998. [4] [5] The wheat areas of Western Australia, South Australia and Victoria missed the heavy June falls completely but were very wet in July and the Western District of Victoria was relieved of anxiety by exceptionally heavy rainfall in the first eighteen days of September. Despite a dry October outside of southeastern Queensland rainfall for the rest of the year was generally satisfactory throughout southern Australia, though the wet season did not start well in the north.
This year opened with some heavy monsoonal rains over the more coastal areas of Queensland and the Northern Territory in January; however, the month was very dry in the southeast apart from southern Tasmania. February was dry west of a line from Derby to Eucla and east from one between Melbourne and Bundaberg, but elsewhere some exceptionally heavy thunderstorm rains meant the month was a wet one. Adelaide received a particularly intense fall of 56.9 millimetres (2.24 in) on the 17th, with the worst flash flooding in the city's history. Apart from the North Coast of New South Wales, March was particularly wet, so much so that major flooding occurred in most rivers between Melbourne and Sydney. In Melbourne, the total of 23 rainy days is a record for any month between November and April [6] and the low sunshine hours of only four per day also unparalleled.
The period around 12 April saw an extremely heavy if localised rainfall in the Albany district with totals of up to 175 millimetres (6.9 in) in a day near the Stirling Range and 114 millimetres (4.5 in) near Katanning. April was also very wet in the southern coastal districts of New South Wales, but May and June saw an unseasonal continuation of easterly winds. Thus, Tasmania, southwestern WA and the settled areas of South Australia were very dry, whilst most of New South Wales, Queensland and East Gippsland were wet. Apart from scattered coastal areas and the extreme southwest, July was exceptionally dry: Ouyen did not receive any rain in June or July [7] and Adelaide's rainfall for the period of only 32 millimetres (1.3 in) was less than in the disastrous year of 1982. Frosts were exceptionally severe and led to fears of crop losses.
The following three months saw an abrupt reversal, with dry conditions in Queensland and most of New South Wales contrasting with good rains in the Mallee, South Australia and southwestern WA. August was particularly noteworthy as the most completely rainless month known in Queensland and New South Wales. The rain turned an unpromising wheat season into one of the best on record despite a violent cold outbreak in the east early in November when Melbourne recorded its lowest-ever maximum for that month on Melbourne Cup Day of just 11.4 °C (52.5 °F). December saw very wet conditions in Queensland, with record flows in some Cape York Peninsula streams; but, apart from one rain event mid-month with another record daily total in Adelaide, dry weather prevailed elsewhere.
January was very wet in the Top End, Kimberley and central Australia, but distinctly dry in the south of the continent, leading onto a major heatwave with exceptionally dry conditions in the far southeast during February, when Orbost received no rain and Hobart only 3 millimetres (0.12 in). Torrential rains around Eden and Bega in March and wet conditions in southeastern Australia (especially Tasmania) in April were followed by a second heavy fall in a belt from Broome to the Darling Downs in May. The area around Uluru saw some of the heaviest rainfalls known until the 1970s that month.
However, in the southern wheat belt May 1914 began a trend of powerful anticyclones and dry, easterly winds that was at the time quite unprecedented and not rivalled until 1982. In southwestern Australia the rainy season was extraordinarily poor from beginning to end, with only one significant fall all through from May to October and severe frosts prevalent throughout. June, August, September and October were all record dry months in Victoria [8] [9] [10] [11] and Tasmania, and even unusually heavy July rainfall in Gippsland could do nothing to alleviate the drought. The result was, that with the northerly areas around the Darling Downs not well developed yet, Australia's wheat crop was almost completely lost after an exceptionally hot October in which temperatures reached over 36 °C (97 °F) even in Hobart. Wheat yields in Victoria were only around 0.10 tonne per hectare and in WA even lower.
In coastal districts of New South Wales, however, the extraordinarily powerful anticyclones that desiccated the interior produced powerful onshore winds and extremely heavy rain: in Port Macquarie, the spring was the wettest on record. November and December were notably hot and humid, with rainfall near or above normal except in Tasmania and coastal Queensland during November. The southeast of Western Australia was particularly wet during these months, but in the desiccated agricultural regions the rain was much too late to save crops or pastures.
The heavy rainfall of November and December in Western Australia continued throughout the first two months of 1915, culminating in quite unseasonable downpours over the southwest at the end of February and beginning of March. During this period Perth had a spell of ten successive rainy days – more than it normally has in February and March combined. El Niño, however, remained powerful and eastern Australia was almost uniformly dry throughout the first three months of 1915 except for East Gippsland in January and Tasmania in March. Brisbane's March 1915 rainfall of 2.8 millimetres (0.11 in) is its lowest ever and only 2 percent of its long-term March mean, whilst even normally-soaked Cairns received only 120 millimetres (4.7 in). April was equally dry in Queensland and the Northern Territory and only Tasmania and an area near Onslow was even remotely above average across the whole continent.
In May, however, a trend of wet weather established itself across western Victoria, South Australia and southern Western Australia and continued right through to September. This wetness was backed up by the mildest winter across the southeast until global warming began in 1980. Crops that barely grew in 1914 grew with extraordinary vigour, and flooding even occurred in the Wimmera, [12] around Adelaide and more severely in the Blackwood River of Western Australia. Although September saw unseasonable rain as far north as Mount Isa, the drought did not ease in Queensland, coastal New South Wales or Gippsland. Strong westerly winds and tinder-dry forests in August led to major bushfires breaking out in the North Coast of New South Wales and southeastern Queensland. Although occasional rain put many fires out in August and September, the dryness in these regions intensified greatly still in October and November due to extremely powerful westerly weather that saw New South Wales record its driest month of the twentieth century (statewide average rainfall 3.2 millimetres (0.13 in)). Despite patchy rain in December 1915 was still the driest calendar year on record in most of the North Coast of New South Wales and the Atherton Tableland of Queensland. Notable low falls include:
The year was, however, very wet in almost all of Western Australia, and also in western Tasmania and an area around Darwin, where December saw an extremely active monsoon with flooding.
This year opened with heavy rain in Tasmania, southern Victoria and western Queensland, but the drought areas on the east coast did not gain relief until April. May, however was very dry except in a few coastal parts of New South Wales. This time, however, a powerful La Niña developed and produced starting in June exceptionally heavy rain across almost all inland areas of the continent. Adelaide set a record monthly rainfall of 218 millimetres (8.6 in) in June and there was major flooding of the whole city, whilst in July record rainfalls occurred throughout southwestern Queensland.
Still, it was not until nearly continent-wide heavy rains and flooding from late September to mid-December that the drought disappeared fully from the eastern coastal areas, especially Gippsland.
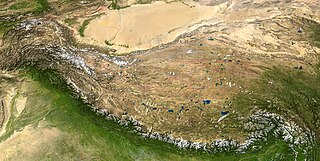
A rain shadow is an area of significantly reduced rainfall behind a mountainous region, on the side facing away from prevailing winds, known as its leeward side.

The unofficial geographic term Northern Australia includes those parts of Queensland and Western Australia north of latitude 26° and all of the Northern Territory. Those local government areas of Western Australia and Queensland that lie partially in the north are included.
The following lists events that happened during 1923 in Australia.
The following lists events that happened during 1902 in Australia.

The Georgina River is the north-westernmost of the three major rivers of the Channel Country in Central West Queensland, that also flows through a portion of the Northern Territory, in central Australia. Part of the Lake Eyre basin, the Georgina flows in extremely wet years into Lake Eyre.

Drought in Australia is defined by the Australian Bureau of Meteorology as rainfall over period greater than three-months being in the lowest decile of what has been recorded for that region in the past. This definition takes into account that drought is a relative term and rainfall deficiencies need to be compared to typical rainfall patterns including seasonal variations. Specifically, drought in Australia is defined in relation to a rainfall deficiency of pastoral leases and is determined by decile analysis applied to a certain area. Note that this definition uses rainfall only because long-term records are widely available across most of Australia. However, it does not take into account other variables that might be important for establishing surface water balance, such as evaporation and condensation.
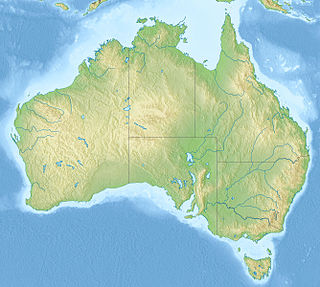
The Australian environment ranges from virtually pristine Antarctic territory and rainforests to degraded industrial areas of major cities. Forty distinct ecoregions have been identified across the Australian mainland and islands. Central Australia has a very dry climate. The interior has a number of deserts while most of the coastal areas are populated. Northern Australia experiences tropical cyclones while much of the country is prone to periodic drought. This dry and warm environment and exposure to cyclones, makes Australia particularly vulnerable to climate change -- with some areas already experiencing increases in wildfires and fragile ecosystems.
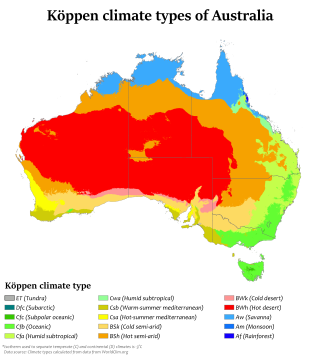
Australia's climate is governed mostly by its size and by the hot, sinking air of the subtropical high pressure belt. This moves north-west and north-east with the seasons. The climate is variable, with frequent droughts lasting several seasons, thought to be caused in part by the El Niño-Southern Oscillation. Australia has a wide variety of climates due to its large geographical size. The largest part of Australia is desert or semi-arid. Only the south-east and south-west corners have a temperate climate and moderately fertile soil. The northern part of the country has a tropical climate, varying between grasslands and desert. Australia holds many heat-related records: the continent has the hottest extended region year-round, the areas with the hottest summer climate, and the highest sunshine duration.
In Australia, the Federation Drought is the name given to a prolonged period of drought that occurred around the time of Federation in 1901.
The 1909 Western Victorian floods consisted of widespread flooding on rivers of the western half of the State of Victoria during the middle of August that year.
The 1950 rainfall records for the Australian states of New South Wales and Queensland reported probably the most remarkable record high rainfall totals ever recorded anywhere in the continent. Averaged over both of these states, 1950 is clearly the wettest year since adequate records became available circa 1885. Queensland recorded a statewide average rainfall of around 1,125 millimetres (44.3 in) as against a mean since 1885 of around 640 millimetres (25.2 in), whilst New South Wales recorded around 930 millimetres (36.6 in) as against an instrumental mean around 520 millimetres (20.5 in). Australia's wettest town, Tully also recorded its highest annual rainfall total in 1950 with 7,925 millimetres (312.0 in).
Between 1979 and 1983 almost all of eastern Australia was affected by a major drought.
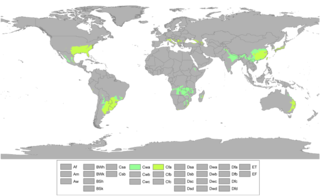
A humid subtropical climate is a temperate climate type characterized by hot and humid summers, and cool to mild winters. These climates normally lie on the southeast side of all continents, generally between latitudes 25° and 40° and are located poleward from adjacent tropical climates, and equatorward from either humid continental or oceanic climates. It is also known as warm temperate climate in some climate classifications.
The 2000s drought in Australia, also known as the millennium drought, is said by some to be the worst drought recorded since European settlement.
The 2010 Victorian floods were a widespread series of flood events across the state of Victoria, Australia. The floods, which followed heavy rain across southeastern Australia in early September 2010, caused the inundation of about 250 homes, hundreds of evacuations and millions of dollars of damage. Weather warnings were initially issued for Victoria on Thursday 2 September and rain began to fall on the Friday, continuing through the weekend to Tuesday. Heavy rain fell in most regions of the state, particularly at higher altitudes in the state's west and northeast, flooding the upper reaches of many of Victoria's major rivers. A state of emergency was declared with State Emergency Service crews arriving from Queensland, South Australia and Tasmania. The floods proceeded an extensive drought period that had effected the entirety of Australia.
Australian rivers have been subject to devastating floods in New South Wales, recorded since colonisation. Flooding in New South Wales has predominately been caused by excessive flows into rivers located in New South Wales and, to a lesser extent, excessive flows into rivers located in Queensland and Victoria. Floods can devastate local communities and impact the entire local economy.

Australian east coast lows are extratropical cyclones or low-pressure systems on the coast of southeastern Australia that may be caused by both mid-latitude and tropical influences over a variety of levels in the atmosphere. These storms should not be confused with Australian region tropical cyclones which typically affect the northern half of the continent.

The southeast Australian foehn is a westerly foehn wind and a rain shadow effect that usually occurs on the coastal plain of southern New South Wales, and as well as in southeastern Victoria and eastern Tasmania, on the leeward side of the Great Dividing Range.

Effects of the El Niño–Southern Oscillation in Australia are present across most of Australia, particularly the north and the east, and are one of the main climate drivers of the country. Associated with seasonal abnormality in many areas in the world, Australia is one of the continents most affected and experiences extensive droughts alongside considerable wet periods that cause major floods. There exist three phases — El Niño, La Niña, and Neutral, which help to account for the different states of ENSO. Since 1900, there have been 28 El Niño and 19 La Niña events in Australia including the current 2023 El Niño event, which was declared on 17th of September in 2023. The events usually last for 9 to 12 months, but some can persist for two years, though the ENSO cycle generally operates over a time period from one to eight years.
2022 was an extremely wet year for Australia, coming out of a back-to-back La Niña in the summer of 2021-22, a Negative Indian Ocean Dipole developing over the winter and a third back-to-back La Niña in the spring of 2022.