1950 Australian rainfall records

Last updated

The 1950 rainfall records for the Australian states of New South Wales and Queensland reported probably the most remarkable record high rainfall totals ever recorded anywhere in the continent. Averaged over both of these states, 1950 is clearly the wettest year since adequate records became available circa 1885. Queensland recorded a statewide average rainfall of around 1,125 millimetres (44.3 in) as against a mean since 1885 of around 640 millimetres (25.2 in), [1] whilst New South Wales recorded around 930 millimetres (36.6 in) as against an instrumental mean around 520 millimetres (20.5 in). [2] Australia's wettest town, Tully also recorded its highest annual rainfall total in 1950 with 7,925 millimetres (312.0 in). [3]

Contents

Evolution and causes of the abnormal rainfall

First four months

The year 1950 opened quite quietly over Australia, with a relatively inactive monsoon and generally very cool conditions further south. A major cyclone [4] in the third week of January gave substantial rain to most of New South Wales and caused high winds that killed seven people, but it was not until February that the pattern of abnormal rainfall over NSW and Queensland became firmly established.

Especially heavy rainfall occurred over the southwest of New South Wales (extending into most of Victoria) during February, but it was in March, normally at the end of the wet season, that the heaviest rainfall occurred. The monsoon trough, which is normally situated around Cape York Peninsula, moved to a latitude near Boulia. At the beginning of that month some of the worst flooding on record occurred over the Barron and Herbert Rivers, and with a major tropical cyclone following the contour of the Queensland coast for over a week from 4 to 11 March and then moving inland, the heavy rain extended deep into the interior of Queensland and even to that part of South Australia northeast of the Flinders Ranges. The flood on the Diamantina River was measured as the highest ever recorded, and Windorah on the lower Cooper recorded for the entire month 442 millimetres (17.4 in), which is about 145 percent of its mean annual rainfall. Most pastoral areas were described as having a "superabundance of feed" [5] and losses of sheep in the Lake Eyre Basin due to blowfly strike were as serious as experienced in the frequent droughts characteristic of the basin's extraordinarily variable climate. [6]

With the interaction with a cold front mid-month, the heavy rainfall shifted southward to the Murrumbidgee River basin. In three days, Canberra received 150 millimetres (6 in) and the heavy rain continued over southeastern New South Wales and adjacent Victoria until the end of the month. Major flooding – unusual for this time of year – occurred on all rivers draining from the Australian Alps and over the South Coast. By the time the rain eased after further heavy falls early in April, Canberra had had its second wettest month on record. Over the North Coast up to Brisbane and inland to the Darling Downs, however, March rainfall had been below normal.

In these regions, however, the moist easterly flow of March continued to bring heavy rainfall later in April; however, in much of western and far southern New South Wales April was very dry. The continuing rain, aided by falls near Lake Eyre that prevented the rivers drying up, allowed the lake to begin filling during that month to the astonishment of many people who had seen the lake during the dry era from 1922 to 1938 and concluded that the lake could never fill with water. [7]

Second four months

May and the first week of June saw a relatively typical winter circulation over most parts of Australia. However, the tendency of strong frontal depressions to move inland combined with generally weak anticyclones meant that temperatures were generally mild, whilst a major low pressure system off the south coast gave that region further flooding rains.

From the second week of June to the end of winter, the weather patterns became quite unusual. Strong high-pressure systems over Tasmania and Victoria were virtually constant and allowed moist easterly air to flow consistently over New South Wales and Queensland. Combined with a series of upper-level lows lifting the moisture, this caused remarkably heavy rain except over the extreme south of New South Wales, where it was dry and the ski season extremely poor. June 1950 was Sydney's wettest month on record with 643 millimetres (25.3 in), whilst at Dorrigo on the edge of the coastal escarpment, over 1,400 millimetres (55 in) fell in the last three weeks of the month and 624 millimetres (24.6 in) on the 24th alone. Even at normally dry Longreach, 160 millimetres (6.3 in) fell for June and 140 millimetres (5.5 in) for July. Most extraordinary, however, was on the Central Coast of Queensland, where Bowen received over 400 millimetres (16 in), or twenty times its normal July rainfall.

Owing to the moist easterly flow, temperatures for the winter were remarkably mild. At Inverell, the mean minimum for July was 6 °C (43 °F), which is as much as 6 °C above normal and an incredible 10 °C (18 °F) higher than had been recorded just four years previously. [8]

The consequences of this heavy rain falling on saturated catchments with absolutely no drying westerly winds was disastrous. Most rivers on the coast of New South Wales, and many further inland, reached record levels. Food shortages were particularly prevalent in Sydney and surrounding cities, and railways and roads were repeatedly cut as each successive storm flooded all major rivers. Vegetable crops on the Hawkesbury River were hardest hit, with most being completely destroyed and prices skyrocketing.

Except for a central portion of New South Wales, August was fairly dry. However, the continued absence of frost or westerly winds meant that at the end of winter catchments were still extremely wet. With the Southern Oscillation Index firmly established as strongly positive after a couple of years near zero, it was clear that further heavy rain was always imminent.

Last four months

September continued mild with rainfall ranging from nil in western NSW to again very heavy around Dubbo and Nyngan, but October and November, with cold air continually interacting with moist easterly winds, saw a return to the extreme wet conditions of June and July. In these two months Dubbo received a total of 420 millimetres (17 in) of rain and the flooding of March returned to the reprieved southeastern areas of New South Wales. By the end of October a large number of stations had already exceeded annual records set in the 1890s.

Wheat crops in all of Queensland and all but the Riverina in NSW, which had needed some fine weather to finish, were almost completely destroyed by the excessive rainfall. Many farmers had no crop at all because of rust and many other crops were fed to cattle as their quality as grain was extremely poor.

The continued rain and mild conditions (warm in the south, cool in the tropics) led to an outbreak of Murray Valley encephalitis which killed 19 people during the subsequent summer. [9] It had the remarkable positive, however, of allowing the first curbs to the rabbit plague in Australia via myxomatosis, which had not spread in the dry era since 1922 because of the absence of standing water for mosquitoes to breed. [9]

December was very wet in the north, with many rainfall records in the Georgina River basin, but was hot and dry in New South Wales except around Tibooburra in the far northwest. Between Sydney and Dubbo it was the first drier-than-normal month since 1949.

Evaluation

The extremely widespread flooding that resulted from record rains and unusually low evaporation caused at least 26 deaths on the North Coast during the winter. [10]

Although record rainfall occurred over about two-thirds of New South Wales and half of Queensland, the most remarkable rainfalls occurred over the central inland of New South Wales. At many stations in the basins of the Macquarie and Bogan Rivers, the 1950 annual rainfall are as much as 250 millimetres (10 in) higher than that of the second-wettest year in a record of around 130 years:

Station1950 rainfallRainfall of
second-wettest year
Records
begin in
Dubbo1,329 millimetres (52 in)1,081 millimetres (43 in)1873
Nyngan [11] 1,123 millimetres (44 in)817 millimetres (32 in)1879

Some stations show similar differences in 1974 (central Australia) and 2000 (Northern Territory, Kimberley and Pilbara). However, it is probable that by then global warming and possibly Asian aerosols were influencing Australia's climate and thus these are not natural variability, which the record 1950 rainfalls above undoubtedly are.

Using a normal distribution one can estimate the return period of 1950-level annual rainfall for the Dubbo region as around 375 years, or about three times the length of instrumental rainfall data. For areas even a little further west, however, the skewness is too high to use this method, but there can be little doubt that the return periods are similar. Excluding records post-1968, when enhanced greenhouse gases has undoubtedly impacted Australian rainfall beyond (admittedly generally high) natural variability, there are no other totals over a substantial area that compare for improbability of being repeated.

The extreme absence of westerly winds meant that unlike 1956, 1973 and 1974, the year 1950 was not uniformly wet over Australia: [12] indeed, in much of Tasmania and Western Australia the anticyclonic control associated with the moist airflow over New South Wales and Queensland produced unusually dry conditions. (A remarkable statistic associated with this is that, although the sixth wettest year averaged over Australia since 1900, 1950 had a higher proportion of Australia in the lowest 10 percent than 81 out of 117 other years. [13]

See also

Related Research Articles

<span class="mw-page-title-main">Lake Eyre</span> Endorheic lake in South Australia

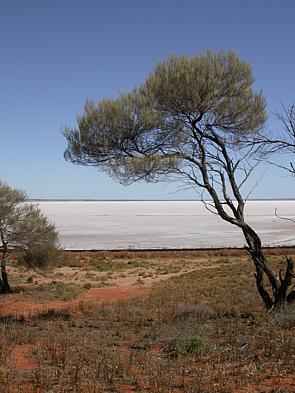
Lake Eyre, officially known as Kati Thanda–Lake Eyre, is an endorheic lake in the east-central part of the Far North region of South Australia, some 700 km (435 mi) north of Adelaide. The shallow lake is the depocentre of the vast endorheic Lake Eyre basin, and contains the lowest natural point in Australia, at approximately 15 m (49 ft) below sea level. On the rare occasions that it fills completely, it is the largest lake in Australia, covering an area of up to 9,500 km2 (3,668 sq mi). When the lake is full, it has the same salinity as seawater, but becomes hypersaline as the lake dries up and the water evaporates.

<span class="mw-page-title-main">Rain shadow</span> Leeward side of a mountain range

A rain shadow is an area of significantly reduced rainfall behind a mountainous region, on the side facing away from prevailing winds, known as its leeward side.

<span class="mw-page-title-main">Diamantina River</span> River in South Australia, Australia

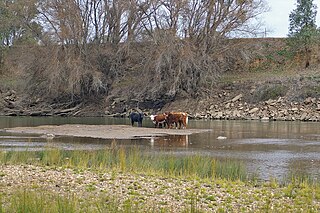
The Diamantina River is a major river in Central West Queensland and the far north of South Australia.

<span class="mw-page-title-main">Lake Eyre basin</span> Drainage basin in Australia

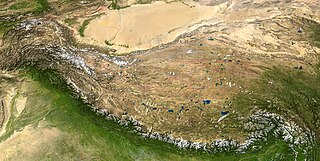
The Lake Eyre basin is a drainage basin that covers just under one-sixth of all Australia. It is the largest endorheic basin in Australia and amongst the largest in the world, covering about 1,200,000 square kilometres (463,323 sq mi), including much of inland Queensland, large portions of South Australia and the Northern Territory, and a part of western New South Wales. The basin is also one of the largest, least-developed arid zone basins with a high degree of variability anywhere. It supports only about 60,000 people and has no major irrigation, diversions or flood-plain developments. Low density grazing that sustains a large amount of wildlife is the major land use, occupying 82% of the total land within the basin. The Lake Eyre basin of precipitation to a great extent geographically overlaps the Great Artesian Basin underneath.

<span class="mw-page-title-main">Cooper Creek</span> River in Queensland, South Australia

The Cooper Creek is a river in the Australian states of Queensland and South Australia. It was the site of the death of the explorers Burke and Wills in 1861. It is sometimes known as the Barcoo River from one of its tributaries and is one of three major Queensland river systems that flow into the Lake Eyre basin. The flow of the creek depends on monsoonal rains falling months earlier and many hundreds of kilometres away in eastern Queensland. It is 1,300 kilometres (810 mi) in length.

<span class="mw-page-title-main">Warrego River</span> River in Australia

The Warrego River is an intermittent river that is part of the Darling catchment within the Murray–Darling basin, which is located in South West Queensland and in the Orana region of New South Wales, Australia. The Warrego River is the northernmost tributary of the Darling River.

<span class="mw-page-title-main">Northern Australia</span> Northern regions of Western Australia, Northern Territory and Queensland in Australia

The unofficial geographic term Northern Australia includes those parts of Queensland and Western Australia north of latitude 26° and all of the Northern Territory. Those local government areas of Western Australia and Queensland that lie partially in the north are included.

<span class="mw-page-title-main">Georgina River</span> River in Queensland, Australia

The Georgina River is the north-westernmost of the three major rivers of the Channel Country in Central West Queensland, that also flows through a portion of the Northern Territory, in central Australia. Part of the Lake Eyre basin, the Georgina flows in extremely wet years into Lake Eyre.

<span class="mw-page-title-main">Drought in Australia</span> Rainfall deficiency in Australia

Drought in Australia is defined by the Australian Bureau of Meteorology as rainfall over period greater than three-months being in the lowest decile of what has been recorded for that region in the past. This definition takes into account that drought is a relative term and rainfall deficiencies need to be compared to typical rainfall patterns including seasonal variations. Specifically, drought in Australia is defined in relation to a rainfall deficiency of pastoral leases and is determined by decile analysis applied to a certain area. Note that this definition uses rainfall only because long-term records are widely available across most of Australia. However, it does not take into account other variables that might be important for establishing surface water balance, such as evaporation and condensation.

<span class="mw-page-title-main">Climate of Australia</span> Overview of the climate of Australia

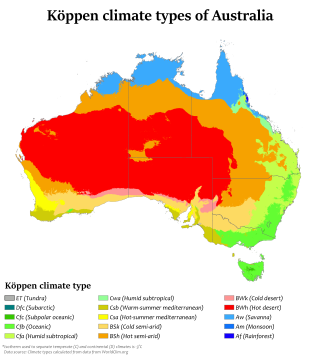
Australia's climate is governed mostly by its size and by the hot, sinking air of the subtropical high pressure belt. This moves north-west and north-east with the seasons. The climate is variable, with frequent droughts lasting several seasons, thought to be caused in part by the El Niño-Southern Oscillation. Australia has a wide variety of climates due to its large geographical size. The largest part of Australia is desert or semi-arid. Only the south-east and south-west corners have a temperate climate and moderately fertile soil. The northern part of the country has a tropical climate, varying between grasslands and desert. Australia holds many heat-related records: the continent has the hottest extended region year-round, the areas with the hottest summer climate, and the highest sunshine duration.

In Australia, the Federation Drought is the name given to a prolonged period of drought that occurred around the time of Federation in 1901.

Between 1979 and 1983 almost all of eastern Australia was affected by a major drought.

The 1911–16 Australian drought consisted of a series of droughts that affected various regions of Australia between the years of 1911 and 1916. Most of the dry spells during this period can be related to three El Niño events in 1911, 1913 and 1914, though rainfall deficiencies actually began in northern Australia before the first of these El Niños set in and did not ease in coastal districts of New South Wales until well after the last El Niño had firmly dissipated and trends toward very heavy rainfall developed in other areas of the continent.

<span class="mw-page-title-main">2000s Australian drought</span> Period of low rainfall on the continent

The 2000s drought in Australia, also known as the millennium drought is said by some to be the worst drought recorded since European settlement.

<span class="mw-page-title-main">1973–74 Australian region cyclone season</span>

The 1973–74 Australian region cyclone season was the third most active tropical cyclone season in the Australian Region.

<span class="mw-page-title-main">Geography of Queensland</span> Geography of Queensland in north-east of Australia

The geography of Queensland in the north-east of Australia, is varied. It includes tropical islands, sandy beaches, flat river plains that flood after monsoon rains, tracts of rough, elevated terrain, dry deserts, rich agricultural belts and densely populated urban areas.

Australian rivers have been subject to devastating floods in New South Wales, recorded since colonisation. Flooding in New South Wales has predominately been caused by excessive flows into rivers located in New South Wales and, to a lesser extent, excessive flows into rivers located in Queensland and Victoria. Floods can devastate local communities and impact the entire local economy.

<span class="mw-page-title-main">Black nor'easter</span>

A Black nor'easter is a persistent and potentially violent north-easterly storm that occurs on the east coast of Australia usually between late spring and early autumn, about two days a year, although not a convection wind, but a storm system that develops offshore which can last several days. This is heralded by the rapid build-up of dense black cloud that can convert to a gale in well under one hour, and also bringing with it a heavy rainfall event usually accompanied by a thunderstorm. This type of storm was first recorded during the 1800s.

<span class="mw-page-title-main">Effects of the El Niño–Southern Oscillation in Australia</span>

Effects of the El Niño–Southern Oscillation in Australia is present across most of Australia, particularly the north and the east, and is one of the main climate drivers of the country. Associated with seasonal abnormality in many areas in the world, Australia is one of the continents most affected and experiences extensive droughts alongside considerable wet periods that cause major floods. There exist three phases — El Niño, La Niña, and Neutral, which help to account for the different states of ENSO. Since 1900, there have been 28 El Niño and 19 La Niña events in Australia including the current 2023 El Niño event, which was declared on 17th of September in 2023. The events usually last for 9 to 12 months, but some can persist for two years, though the ENSO cycle generally operates over a time period from one to eight years.

2022 was an extremely wet year for Australia, coming out of a back-to-back La Niña in the summer of 2021-22, a Negative Indian Ocean Dipole developing over the winter and a third back-to-back La Niña in the spring of 2022.

References

  1. "Queensland sorted annual rainfall". Archived from the original on 5 June 2011. Retrieved 29 March 2008.
  2. "New South Wales sorted annual rainfall". Archived from the original on 5 June 2011. Retrieved 29 March 2008.
  3. Rigby, Mark (16 March 2017). "Australia's wettest town set to revamp iconic rain monument". ABC News . Archived from the original on 10 April 2020. Retrieved 10 April 2020.
  4. January 1950 storm surge Archived 28 October 2007 at the Wayback Machine
  5. Queensland Year Book, 1950
  6. Bureau of Meteorology, Commonwealth of Australia, Melbourne; Meteorological summary for selected climatological stations, Australia; 1950, March and April
  7. Royal Geographical Society of Australasia. South Australian Branch. Lake Eyre Committee; Lake Eyre, South Australia : the great flooding of 1949–50 / the report of the Lake Eyre Committee
  8. Bureau of Meteorology; Meteorological summary for selected climatological stations, Australia; 1950, July and 1946, July
  9. 1 2 "Rain and disease". Bureau of Meteorology. Archived from the original on 17 March 2009. Retrieved 30 March 2008.
  10. Eastern NSW Floods Archived 27 May 2012 at the Wayback Machine
  11. Wilfred Gibson (1983). Nyngan on the Bogan: 1883–1983. ISBN   978-0-9591866-0-4.
  12. An assessment of recent trends in Australian rainfall
  13. Sorted data set of proportion of Australia in first decile