Belgian general election, 1949

Last updated
Belgian general election, 1949
Flag of Belgium (civil).svg
  1946 26 June 1949 (1949-06-26) 1950  

All 212 seats in the Chamber of Representatives
106 seats in the Senate
107 (Chamber) seats needed for a majority

 First partySecond party
  Gaston Eyskens (1969).jpg Bundesarchiv Bild 183-39998-0427, Paul-Henri Spaak.jpg
Leader Gaston Eyskens Paul-Henri Spaak
Party Christian Social Socialist
Leader sinceCandidate for PMCandidate for PM
Last election92 seats, 42.54%69 seats, 31.57%
Seats won10566
Seat changeIncrease2.svg13Decrease2.svg3
Popular vote2,190,8951,496,539
Percentage43.55%29.76%
SwingIncrease2.svg1.01%Decrease2.svg1.81%

 Third partyFourth party
  No image.png 20161101 seraing040.jpg
Leader Roger Motz Julien Lahaut
Party Liberal Communist
Leader since19451945
Last election17 seats, 8.93%23 seats, 12.69%
Seats won2912
Seat changeIncrease2.svg12Decrease2.svg11
Popular vote767,180376,765
Percentage15.25%7.49%
SwingIncrease2.svg6.32%Decrease2.svg5.20%

Prime Minister before election

Paul-Henri Spaak
Socialist

Prime Minister

Gaston Eyskens
Christian Social

General elections were held in Belgium on 26 June 1949. [1] Several reforms took effect prior to the elections; they were the first after the introduction of universal women's suffrage; the number of seats in the Chamber of Representatives was increased from 202 to 212, and from now on, elections for the nine provincial councils were held simultaneously with parliamentary elections. The number of Chamber seats and the simultaneous provincial and parliamentary elections would remain unchanged until state reforms in 1993.

Belgium Federal constitutional monarchy in Western Europe

Belgium, officially the Kingdom of Belgium, is a country in Western Europe. It is bordered by the Netherlands to the north, Germany to the east, Luxembourg to the southeast, France to the southwest, and the North Sea to the northwest. It covers an area of 30,688 square kilometres (11,849 sq mi) and has a population of more than 11.4 million. The capital and largest city is Brussels; other major cities are Antwerp, Ghent, Charleroi and Liège.

Womens suffrage the legal right of women to vote

Women's suffrage is the right of women to vote in elections; a person who advocates the extension of suffrage, particularly to women, is called a suffragist. Limited voting rights were gained by women in Tuscany, Finland, Iceland, Sweden and some Australian colonies and western U.S. states in the late 19th century. National and international organizations formed to coordinate efforts to gain voting rights, especially the International Woman Suffrage Alliance, and also worked for equal civil rights for women.

Provinces of Belgium subdivision of Belgium

The country of Belgium is divided into three regions. Two of these regions, the Flemish Region or Flanders, and Walloon Region, or Wallonia, are each subdivided into five provinces. The third region, the Brussels-Capital Region, is not divided into provinces, as it was originally only a small part of a province itself.

Contents

The result was a victory for the Christian Social Party, which won 105 of the 212 seats in the Chamber of Representatives and 54 of the 106 seats in the Senate. [2] Voter turnout was 94.4%. [3]

The Christian Social Party (PSC-CVP) was a Christian democratic political party in Belgium, which existed from 1945 until 1968 when it split along linguistic lines.

Results

Chamber of Deputies

PartyVotes%Seats+/–
Christian Social Party 2,190,89543.55105+13
Belgian Socialist Party 1,496,53929.7666-3
Liberal Party 767,18015.2529+12
Communist Party of Belgium 376,7657.4912–11
Flemish Concentration103,8962.070New
Middle Class45,7210.910New
Independent Party20,4500.410New
Traders Union6,7090.130New
National Belgian Rally6,0770.120New
Walloon Unity5,8520.120New
Luxembourg Defence2,0240.040New
Cosmocraten6850.010New
Light6800.010New
Independent General Syndicate6100.010New
Belgian Patriotic Party550.000New
Independents6,7450.1300
Invalid/blank votes289,333
Total5,320,216100212+10
Registered voters/turnout5,635,45294.41
Source: Belgian Elections

Senate

PartyVotes%Seats+/–
Christian Social Party 2,208,55346.9554+3
Belgian Socialist Party 1,410,13529.9833–1
Liberal Party 762,53016.2114+10
Communist Party of Belgium 377,2098.025–6
Flemish Concentration66,0551.400New
Middle Class37,3020.790New
Independent Party20,3570.430New
A13,3790.280New
Traders Union5,5070.120New
Walloon Unity5,0100.110New
B5550.010New
Independents5,2410.1200
Invalid/blank votes321,017
Total5,024,677100106+5
Registered voters/turnout5,635,45289.16
Source: Belgian Elections

Constituencies

The distribution of seats among the electoral districts of the Chamber of Representatives was as follows. [4] Several arrondissements got one or more additional seats.

ProvinceArrondissement(s)SeatsChange
Antwerp Antwerp 20+2
Mechelen 6
Turnhout 6+1
Limburg Hasselt 5+1
Tongeren-Maaseik 6+1
East Flanders Aalst 6
Oudenaarde 3
Gent-Eeklo 13+1
Dendermonde 4
Sint-Niklaas 4
West Flanders Bruges 5+1
Roeselare-Tielt 5+1
Kortrijk 6
Ypres 3
Veurne-Diksmuide-Ostend 5
Brabant Leuven 7
Brussels 32+2
Nivelles 5
Hainaut Tournai-Ath 6
Charleroi 11
Thuin 4
Mons 7
Soignies 3
Liège Huy-Waremme 4
Liège 14
Verviers 5
Luxembourg Arlon-Marche-Bastogne 3
Neufchâteau-Virton 3
Namur Namur 5
Dinant-Philippeville 4
Total212+10

Related Research Articles

1922 Dutch general election

General elections were held in the Netherlands on 5 July 1922. They were the first elections held under universal suffrage, which became reality after the acceptance of a proposal by Henri Marchant in 1919 that gave women full voting rights. Almost all major parties had a woman elected. The number of female representatives increased from one to seven. Only the Anti-Revolutionary Party principally excluded women from the House of Representatives. Another amendment to the electoral law increased the electoral threshold from 0.5% to 0.75%, after six parties had won seats with less than 0.75% of the vote in the previous elections.

1971 Austrian legislative election election in Austria which resulted in the winning of the Socialist Party

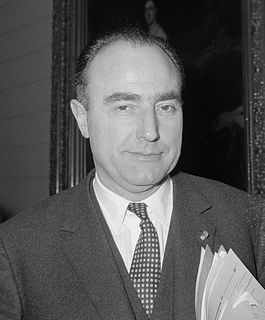
Early parliamentary elections were held in Austria on 10 October 1971, following electoral reforms which increased the number of seats in the National Council from 165 to 183 and increased the proportionality of the seat distribution. The result was a victory for the Socialist Party, which won 93 of the 183 seats, an absolute majority. Voter turnout was 92.4%. Socialist leader Bruno Kreisky remained Chancellor.

October 1959 Icelandic parliamentary election

Early parliamentary elections were held in Iceland on 25 and 26 October 1959. Following the electoral reforms made after the June elections, the Independence Party won 16 of the 40 seats in the Lower House of the Althing.

1950 Belgian general election

General elections were held in Belgium on 4 June 1950. The result was a victory for the Christian Social Party, which won 108 of the 212 seats in the Chamber of Representatives and 54 of the 106 seats in the Senate. Voter turnout was 92.6%. This election was the last one in Belgian history were a single party achieved an absolute majority. Elections for the nine provincial councils were also held.

1954 Belgian general election

General elections were held in Belgium on 11 April 1954. The dominant Christian Social Party won 95 of the 212 seats in the Chamber of Representatives and 49 of the 106 seats in the Senate. Voter turnout was 93.2%. Elections for the nine provincial councils were also held.

1958 Belgian general election

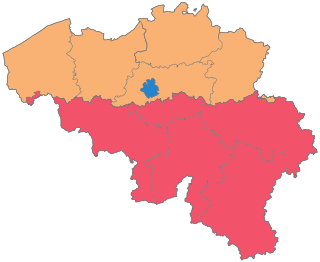
General elections were held in Belgium on 1 June 1958. The result was a victory for the Christian Social Party, which won 104 of the 212 seats in the Chamber of Representatives and 53 of the 106 seats in the Senate. Voter turnout was 93.6% in the Chamber election and 93.7% in the Senate election. Elections for the nine provincial councils were also held.

1961 Belgian general election

General elections were held in Belgium on 26 March 1961. The result was a victory for the Christian Social Party, which won 96 of the 212 seats in the Chamber of Representatives and 47 of the 106 seats in the Senate. Voter turnout was 92.3%. Elections for the nine provincial councils were also held.

1965 Belgian general election

General elections were held in Belgium on 23 May 1965. The result was a victory for the Christian Social Party, which won 77 of the 212 seats in the Chamber of Representatives and 44 of the 106 seats in the Senate. Voter turnout was 91.6%. Elections for the nine provincial councils were also held.

1971 Belgian general election

General elections were held in Belgium on 7 November 1971. The result was a victory for the Christian People's Party, which won 40 of the 212 seats in the Chamber of Representatives and 34 of the 106 seats in the Senate. Voter turnout was 91.5%. Elections to the nine provincial councils were also held.

1974 Belgian general election elections in Belgium

General elections were held in Belgium on 10 March 1974. The Belgian Socialist Party emerged as the largest faction in the Chamber of Representatives with 59 of the 212 seats. Voter turnout was 90.3%. Elections were also held for the nine provincial councils, as well as for the Council of the German Cultural Community for the first time.

1977 Belgian general election elections in Belgium

General elections were held in Belgium on 17 April 1977. The result was a victory for the Christian People's Party, which won 56 of the 212 seats in the Chamber of Representatives and 28 of the 106 seats in the Senate. Voter turnout was 95.1%. Elections were also held for the nine provincial councils and for the Council of the German Cultural Community.

1981 Belgian general election

General elections were held in Belgium on 8 November 1981. Voter turnout was 94.5% in the Chamber election and 94.6% in the Senate election. Elections were also held for the nine provincial councils and for the Council of the German Cultural Community. They were the first elections after the voting age was lowered from 21 to 18. This contributed to the success of the socialist parties and the green parties. The traditionally largest Christian People's Party saw significant losses, with only 43 of the 212 seats in the Chamber of Representatives.

1978 Belgian general election

General elections were held in Belgium on 17 December 1978. The Christian People's Party emerged as the largest party, with 57 of the 212 seats in the Chamber of Representatives and 29 of the 106 seats in the Senate. Voter turnout was 94.8%. Elections were also held for the nine provincial councils and for the Council of the German Cultural Community.

1921 Belgian general election

General elections were held in Belgium on 20 November 1921. The result was a victory for the Catholic Party, which won 70 of the 186 seats in the Chamber of Representatives. Voter turnout was 91.1% in the Chamber election and 91.0% in the Senate election.

1894 Belgian general election

Full general elections were held in Belgium on 14 October 1894, with run-off elections held on 21 October 1894.

1902 Belgian general election

Partial general elections were held in Belgium on 25 May 1902. The result was a victory for the Catholic Party, which won 54 of the 85 seats up for election in the Chamber of Representatives. Voter turnout was 95.7%.

1912 Belgian general election

Full general elections were held in Belgium on 2 June 1912.

1960 Cypriot legislative election

Parliamentary elections were held in Cyprus in 1960. The House of Representatives was elected on 31 July 1960, whilst the Communal Chambers were elected on 7 August. In the House of Representatives 35 seats were elected by Greek Cypriots and 15 by Turkish Cypriots. The result was a victory for the Patriotic Front, which won 30 of the 50 seats. In the Communal Chambers, the Patriotic Front won 20 of the 26 seats in the Greek Chamber, whilst the Cyprus Turkish National Union won all seats in the Turkish Chamber.

1978 Brazilian legislative election

Parliamentary elections were held in Brazil on 15 November 1978. The National Renewal Alliance Party won 231 of the 420 seats in the Chamber of Deputies and 15 of the 23 seats in the Senate. Voter turnout was 81.7%.

July 1836 Portuguese legislative election

Parliamentary elections were held in Portugal on 17 and 31 July 1836.

References

  1. Dieter Nohlen & Philip Stöver (2010) Elections in Europe: A data handbook, p289 ISBN   978-3-8329-5609-7
  2. Nohlen & Stöver, pp309-311
  3. Nohlen & Stöver, p290
  4. List of members of the Chamber of Representatives (1949-1950)