Belgian general election, 1965

Last updated
Belgian general election, 1965
Flag of Belgium (civil).svg
  1961 23 May 1965 1968  

212 seats in the Chamber of Representatives

 First partySecond partyThird party
  Pierre Harmel 1965.jpg Leo Collard 1968.jpg Omer Vanaudenhove.jpg
Leader Pierre Harmel Léo Collard Omer Vanaudenhove
Party Christian Social Socialist PVV
Leader sinceCandidate for PM19591961
Last election96 seats, 41.46%84 seats, 36.72%New
Seats won776448
Seat changeDecrease2.svg 19Decrease2.svg 20New
Popular vote1,785,2111,403,1071,119,991
Percentage34.45%28.28%21.61%
SwingDecrease2.svg 7.01%Decrease2.svg 8.44%New

 Fourth partyFifth partySixth party
  No image.png No image.png No image.png
LeaderFrans Van der Elst Ernest Burnelle Paul Brien
Party VU Communist DéFI
Leader since195519541964
Last election5 seats, 3.46%5 seats, 3.08%New
Seats won1263
Seat changeIncrease2.svg 7Increase2.svg 1New
Popular vote346,860247,31168,966
Percentage6.69%4.77%1.33%
SwingIncrease2.svg 3.23%Increase2.svg 1.69%New

Prime Minister before election

Théo Lefèvre
Christian Social

Elected Prime Minister

Pierre Harmel
Christian Social

State Coat of Arms of Belgium.svg
This article is part of a series on the
politics and government of
Belgium
Constitution
Foreign relations

General elections were held in Belgium on 23 May 1965. [1] The result was a victory for the Christian Social Party, which won 77 of the 212 seats in the Chamber of Representatives and 44 of the 106 seats in the Senate. [2] Voter turnout was 91.6%. [3] Elections for the nine provincial councils were also held.

Belgium Federal constitutional monarchy in Western Europe

Belgium, officially the Kingdom of Belgium, is a country in Western Europe. It is bordered by the Netherlands to the north, Germany to the east, Luxembourg to the southeast, France to the southwest, and the North Sea to the northwest. It covers an area of 30,688 square kilometres (11,849 sq mi) and has a population of more than 11.4 million. The capital and largest city is Brussels; other major cities are Antwerp, Ghent, Charleroi and Liège.

The Christian Social Party (PSC-CVP) was a Christian democratic political party in Belgium, which existed from 1945 until 1968 when it split along linguistic lines.

Provinces of Belgium subdivision of Belgium

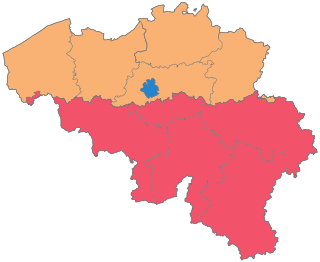
The country of Belgium is divided into three regions. Two of these regions, the Flemish Region or Flanders, and Walloon Region, or Wallonia, are each subdivided into five provinces. The third region, the Brussels-Capital Region, is not divided into provinces, as it was originally only a small part of a province itself.

Contents

The elections followed the implementation of the 1962 language laws. As a result, the Flemish nationalist People's Union made big gains, as well as the new Democratic Front of the Francophones which was founded as a response to the language laws.

Language legislation in Belgium

This article outlines the legislative chronology concerning the use of official languages in Belgium.

People's Union was a Flemish nationalist political party in Belgium, formed in 1954 as a successor to the Christian Flemish People's Union.

The election also followed the founding of the Party for Freedom and Progress, succeeding the Liberal Party. The new party aimed to reach a broader voter base, in which it succeeded by more than doubling its number of seats.

The Party for Freedom and Progress was a liberal political party in Belgium which existed from 1961 until 1992. The party was the successor of the Liberal Party, which had roots dating back to 1846. It was succeeded in Flanders by the Flemish Liberals and Democrats (VLD) and in Wallonia by the Liberal Reformist Party, Parti des Réformes et des Libertés de Wallonie and the current-day Reformist Movement. In the German-speaking Community, it still exists as the Party for Freedom and Progress.

The Liberal Party was a Belgian political party that existed from 1846 until 1961, when it became the Party for Freedom and Progress, Partij voor Vrijheid en Vooruitgang/Parti de la Liberté et du Progrès or PVV-PLP, under the leadership of Omer Vanaudenhove.

Despite both government parties losing seats, they retained their sizeable majority and continued governing.

Results

Chamber of Representatives

PartyVotes%Seats+/–
Christian Social Party (CVP-PSC)1,785,21134.4577–19
Belgian Socialist Party (BSP-PSB)1,465,50328.2864–20
Party for Freedom and Progress (PVV-PLP)1,119,99121.6148+28
People's Union (Volksunie)346,8606.6912+7
Communist Party of Belgium (KPB-PCB)247,3114.776+1
Democratic Front of the Francophones (FDF)68,9661.333New
Communists41,6740.800New
Walloon Front 24,2450.471New
Walloon Workers' Party 23,5820.461New
de Socialist14,9370.290New
Catholic Party14,0070.270New
Flemish People's Party13,3210.260New
Walloon Communist Party13,3210.260New
Independent Social Party9,4930.180New
Independent Workers Union8,6800.170New
Flemish Democrats7,9830.150New
Walloon Democratic Front5,7090.110New
Afzonderlijk4,7620.090New
Francophone Union3,7760.070New
Independent National Party3,0890.060New
Animal Protection2,5430.050New
Belgian Workers' Party2,2370.040New
Independent Rally2,2130.040New
National Party1,8890.0400
Return to Liège1,5520.030New
Union of Independents1,0140.020New
Independent Middle Class9580.020New
Kaganovemus8900.020New
Trotsky Communists3850.010New
New Resistance Movement3090.010New
Independents4930.010–1
Invalid/blank votes396,941
Total5,578,8761002120
Registered voters/turnout6,091,53491.58
Source: Belgian Elections

Senate

PartyVotes%Seats+/–
Christian Social Party (CVP-PSC)1,785,19134.8944–3
Belgian Socialist Party (BSP-PSB)1,449,48228.3331–14
Party for Freedom and Progress (PVV-PLP)1,111,89421.7323+12
People's Union (Volksunie)338,7706.624+2
Communist Party of Belgium (KPB-PCB)249,7964.883+2
Democratic Front of the Francophones (FDF)68,3971.341New
Walloon Democratic Front27,2150.530New
Walloon Workers' Party 21,5110.420New
Independent Social Party12,1800.240New
Walloon Communist Party11,6000.230New
Francophone Union7,6560.150New
Independent Rally7,4560.150New
Independent Workers Union6,4480.130New
Catholic Party5,2260.100New
Belgian Workers' Party4,2070.080New
Independent National Party4,0660.080New
National Party2,8850.0600
Kaganovemus1,7390.030New
Independent Middle Class8310.020New
Flemish Democrats4750.010New
Invalid/blank votes461,584
Total5,578,6091001060
Registered voters/turnout6,091,53491.58
Source: Belgian Elections

Constituencies

The distribution of seats among the electoral districts was as follows for the Chamber of Representatives. Seats were reapportioned among the districts due to population growth, which was stronger in Flanders than in Wallonia, and due to several municipalities having been changed to another province following the 1962 language laws. For example, the Comines-Warneton municipalities were transferred from Ypres (West Flanders) to the newly created arrondissement of Mouscron (Hainaut), causing Ypres to lose one seat and Tournai-Ath-Mouscron to gain one seat.

Comines-Warneton Municipality in French Community, Belgium

Comines-Warneton is a Belgian city and municipality in the Walloon province of Hainaut. On January 1, 2006, it had a total population of 17,562. Its total area is 61.09 km2 (23.59 sq mi) which gives a population density of 287 inhabitants per square kilometre (740/sq mi). The name "Comines" is believed to have a Celtic, or Gaulish, origin. Comines-Warneton is a municipality with language facilities for Dutch-speakers.

Arrondissement of Mouscron Arrondissement in Wallonia, Belgium

The Arrondissement of Mouscron is one of the seven administrative arrondissements in the Province of Hainaut, Belgium. It is not a judicial arrondissement. Its municipalities are a part of the Judicial Arrondissement of Tournai.

ProvinceArrondissement(s)ChamberChange
Antwerp Antwerp 20
Mechelen 6
Turnhout 7+1
Limburg Hasselt 6+1
Tongeren-Maaseik 7+1
East Flanders Aalst 6
Oudenaarde 3
Gent-Eeklo 13
Dendermonde 4
Sint-Niklaas 4
West Flanders Bruges 5
Roeselare-Tielt 5
Kortrijk 6
Ypres 2–1
Veurne-Diksmuide-Ostend 5
Brabant Leuven 8+1
Brussels 33+1
Nivelles 5
Hainaut Tournai-Ath- Mouscron 7+1
Charleroi 11
Thuin 3–1
Mons 6–1
Soignies 4
Liège Huy-Waremme 4
Liège 14
Verviers 5–1
Luxembourg Arlon-Marche-Bastogne 3
Neufchâteau-Virton 2–1
Namur Namur 5
Dinant-Philippeville 3–1
Total212

Related Research Articles

1993 Russian legislative election

Parliamentary elections were held in Russia on 12 December 1993. They included the last elections to the Federation Council of Russia.

1946 Belgian general election

General elections were held in Belgium on 17 February 1946. The result was a victory for the Christian Social Party, which won 92 of the 202 seats in the Chamber of Representatives and 51 of the 101 seats in the Senate. Voter turnout was 90.3%.

1949 Belgian general election

General elections were held in Belgium on 26 June 1949. Several reforms took effect prior to the elections; they were the first after the introduction of universal women's suffrage; the number of seats in the Chamber of Representatives was increased from 202 to 212, and from now on, elections for the nine provincial councils were held simultaneously with parliamentary elections. The number of Chamber seats and the simultaneous provincial and parliamentary elections would remain unchanged until state reforms in 1993.

1950 Belgian general election

General elections were held in Belgium on 4 June 1950. The result was a victory for the Christian Social Party, which won 108 of the 212 seats in the Chamber of Representatives and 54 of the 106 seats in the Senate. Voter turnout was 92.6%. This election was the last one in Belgian history were a single party achieved an absolute majority. Elections for the nine provincial councils were also held.

1961 Belgian general election

General elections were held in Belgium on 26 March 1961. The result was a victory for the Christian Social Party, which won 96 of the 212 seats in the Chamber of Representatives and 47 of the 106 seats in the Senate. Voter turnout was 92.3%. Elections for the nine provincial councils were also held.

1939 Belgian general election

General elections were held in Belgium on 2 April 1939. The result was a victory for the Catholic Party, which won 67 of the 202 seats in the Chamber of Representatives. Voter turnout was 93.3%.

1919 Belgian general election

General elections were held in Belgium on 16 November 1919. Although the Belgian Labour Party received the most votes in the Chamber of Representatives elections, the Catholic Party remained the largest party in both the Chamber and the Senate. Voter turnout was 88.5% in the Chamber elections.

1921 Belgian general election

General elections were held in Belgium on 20 November 1921. The result was a victory for the Catholic Party, which won 70 of the 186 seats in the Chamber of Representatives. Voter turnout was 91.1% in the Chamber election and 91.0% in the Senate election.

1894 Belgian general election

Full general elections were held in Belgium on 14 October 1894, with run-off elections held on 21 October 1894.

1900 Belgian general election

Full general elections were held in Belgium on 27 May 1900.

1902 Belgian general election

Partial general elections were held in Belgium on 25 May 1902. The result was a victory for the Catholic Party, which won 54 of the 85 seats up for election in the Chamber of Representatives. Voter turnout was 95.7%.

1904 Belgian general election

Partial general elections were held in Belgium on 29 May 1904. The result was a victory for the Catholic Party, which won 38 of the 81 seats in the Chamber of Representatives.

1910 Belgian general election

Partial general elections were held in Belgium on 22 May 1910. The result was a victory for the Catholic Party, which won 49 of the 85 seats up for election in the Chamber of Representatives.

1912 Belgian general election

Full general elections were held in Belgium on 2 June 1912.

1936 Belgian general election

General elections were held in Belgium on 24 May 1936. The result was a victory for the Belgian Labour Party, which won 70 of the 202 seats in the Chamber of Representatives and 39 of the 101 seats in the Senate. Voter turnout was 94.7%.

1852 Belgian general election

Partial general elections were held in Belgium on 8 June 1852. In the elections for the Chamber of Representatives the result was a victory for the Liberal Party, who won 57 of the 108 seats. Voter turnout was 69.2%, although only 42,053 people were eligible to vote.

1866 Belgian general election

Partial general elections were held in Belgium on 12 June 1866. In the elections for the Chamber of Representatives the result was a victory for the Liberal Party, which won 70 of the 122 seats. Voter turnout was 70%, although only 51,465 people were eligible to vote.

1859 Belgian general election

Partial general elections were held in Belgium on 14 June 1859. The result was a victory for the Liberal Party, which won 69 of the 116 seats in the Chamber of Representatives and 31 of the 58 seats in the Senate. Voter turnout was 55.9%, although only 49,672 people were eligible to vote.

1878 Belgian general election

Partial general elections were held in Belgium on 11 June, 18 June and 15 July 1878. The result was a victory for the Liberal Party, which won 72 of the 132 seats in the Chamber of Representatives and 36 of the 66 seats in the Senate. Voter turnout was 62.5%, although only 56,640 people were eligible to vote.

1882 Belgian general election

Partial general elections were held in Belgium on 13 June 1882. The result was a victory for the Liberal Party, which won 79 of the 138 seats in the Chamber of Representatives and 37 of the 69 seats in the Senate. Voter turnout was 75.1%, although only 55,517 people were eligible to vote.

References

  1. Dieter Nohlen & Philip Stöver (2010) Elections in Europe: A data handbook, p289 ISBN   978-3-8329-5609-7
  2. Nohlen & Stöver, pp309-311
  3. Nohlen & Stöver, p291