| |||||||||||||||||||||||||||||||||||||||||||||||||||||||||||||||||||||||||||||||||||||
212 seats in the Chamber of Representatives | |||||||||||||||||||||||||||||||||||||||||||||||||||||||||||||||||||||||||||||||||||||
---|---|---|---|---|---|---|---|---|---|---|---|---|---|---|---|---|---|---|---|---|---|---|---|---|---|---|---|---|---|---|---|---|---|---|---|---|---|---|---|---|---|---|---|---|---|---|---|---|---|---|---|---|---|---|---|---|---|---|---|---|---|---|---|---|---|---|---|---|---|---|---|---|---|---|---|---|---|---|---|---|---|---|---|---|---|
| |||||||||||||||||||||||||||||||||||||||||||||||||||||||||||||||||||||||||||||||||||||
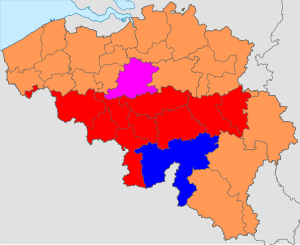
Colours denote the winning party in each electoral district (for the Chamber of Deputies). a Whilst still technically the same party in this election, for the first time the Walloon and Flemish sections of the party ran candidates separately. | |||||||||||||||||||||||||||||||||||||||||||||||||||||||||||||||||||||||||||||||||||||
|
This article is part of a series on the politics and government of Belgium |
---|
Constitution |
|
Foreign relations |
General elections were held in Belgium on 17 April 1977. [1] The result was a victory for the Christian People's Party, which won 56 of the 212 seats in the Chamber of Representatives and 28 of the 106 seats in the Senate. Voter turnout was 95.1%. [2] Elections were also held for the nine provincial councils and for the Council of the German Cultural Community.
Belgium, officially the Kingdom of Belgium, is a country in Western Europe. It is bordered by the Netherlands to the north, Germany to the east, Luxembourg to the southeast, France to the southwest, and the North Sea to the northwest. It covers an area of 30,688 square kilometres (11,849 sq mi) and has a population of more than 11.4 million. The capital and largest city is Brussels; other major cities are Antwerp, Ghent, Charleroi and Liège.
Christian Democratic and Flemish is a Christian democratic Flemish political party in Belgium. The party has historical ties to both trade unionism (ACV) and trade associations (UNIZO) and the Farmer's League. Until 2001, the party was named the Christian People's Party.
The Parliament of the German-speaking Community is the legislative assembly of the German-speaking Community of Belgium based in Eupen.
Party | Votes | % | Seats | +/– |
---|---|---|---|---|
Christian People's Party | 1,460,757 | 26.20 | 56 | +6 |
Belgian Socialist Party (Flanders) | 725,513 | 13.01 | 27 | New |
Belgian Socialist Party | 602,132 | 10.80 | 34 | New |
People's Union | 559,567 | 10.04 | 20 | –2 |
Party for Freedom and Progress | 475,917 | 8.54 | 17 | New |
Christian Social Party | 406,694 | 7.29 | 24 | +2 |
Democratic Front of the Francophones | 263,104 | 4.72 | 11 | New |
Liberal Reformist Party | 191,196 | 3.34 | 16 | New |
Belgian Socialist Party (Wallonia) | 145,771 | 2.61 | 0 | 0 |
PSC-CSP | 138,361 | 2.48 | 0 | New |
Walloon Rally | 132,773 | 2.38 | 4 | –7 |
PLRW/PRF | 107,015 | 1.92 | 0 | New |
PLRW-PL | 92,178 | 1.65 | 0 | New |
Communist Party of Belgium | 62,410 | 1.12 | 0 | –2 |
PCB-UDP | 51,930 | 0.93 | 0 | New |
Community Party (Wallonia) | 37,104 | 0.67 | 2 | New |
PSB-RW | 33,598 | 0.60 | 1 | New |
AMADA | 22,919 | 0.41 | 0 | New |
ECOLOG | 11,839 | 0.21 | 0 | New |
RAL | 8,562 | 0.15 | 0 | New |
Party of German-speaking Belgians | 7,735 | 0.14 | 0 | 0 |
PLPW | 5,220 | 0.09 | 0 | New |
ECOLOG-PBNZ | 4,321 | 0.08 | 0 | New |
Ecolo | 3,834 | 0.07 | 0 | New |
LRT-RAL | 3,127 | 0.06 | 0 | New |
LRT | 2,905 | 0.05 | 0 | New |
AGALEV | 2,435 | 0.04 | 0 | New |
FFF | 2,099 | 0.04 | 0 | New |
TPO | 1,980 | 0.04 | 0 | New |
CPC/URB | 1,547 | 0.03 | 0 | New |
PRF | 1,514 | 0.03 | 0 | New |
RLiège | 1,421 | 0.03 | 0 | 0 |
UB | 1,083 | 0.02 | 0 | New |
FNP | 994 | 0.02 | 0 | New |
VFP | 967 | 0.02 | 0 | New |
KAGANO | 884 | 0.02 | 0 | New |
COLOGIQUE | 777 | 0.01 | 0 | New |
EW | 605 | 0.01 | 0 | New |
PCBML | 533 | 0.01 | 0 | New |
VOP | 443 | 0.01 | 0 | New |
VB77 | 377 | 0.01 | 0 | New |
UCMLB | 222 | 0.00 | 0 | New |
UC-MEUNIER | 199 | 0.00 | 0 | New |
PORT | 175 | 0.00 | 0 | New |
PP | 169 | 0.00 | 0 | New |
POE | 152 | 0.00 | 0 | New |
Invalid/blank votes | 431,153 | – | – | – |
Total | 6,006,211 | 100 | 212 | 0 |
Source: Belgian Elections |
Party | Votes | % | Seats | +/– |
---|---|---|---|---|
Christian People's Party | 1,446,806 | 26.18 | 28 | +1 |
Belgian Socialist Party (Wallonia) | 756,401 | 13.69 | 19 | New |
Belgian Socialist Party (Flanders) | 719,533 | 13.02 | 12 | New |
People's Union | 562,894 | 10.19 | 10 | 0 |
Christian Social Party | 522,613 | 9.46 | 11 | +1 |
Party for Freedom and Progress | 472,645 | 8.55 | 9 | New |
Liberal Reformist Party | 316,292 | 5.72 | 7 | New |
Democratic Front of the Francophones | 546,367 | 4.46 | 6 | New |
Walloon Rally | 158,642 | 2.87 | 2 | New |
Communist Party of Belgium | 108,000 | 1.95 | 1 | 0 |
PL | 70,458 | 1.28 | 0 | New |
PCB-UDP | 50,749 | 0.92 | 0 | New |
BSP-RW | 33,945 | 0.61 | 1 | New |
AMADA-TPO | 27,693 | 0.50 | 0 | New |
Party of German-speaking Belgians | 10,213 | 0.18 | 0 | 0 |
Ecolo | 7,558 | 0.14 | 0 | New |
PLPW | 5,305 | 0.10 | 0 | New |
VFP-PFU | 3,413 | 0.06 | 0 | New |
AGALEV | 3,270 | 0.06 | 0 | New |
UB | 1,182 | 0.02 | 0 | New |
VOP | 896 | 0.02 | 0 | New |
LRT-RAL | 387 | 0.01 | 0 | New |
URB | 207 | 0.00 | 0 | New |
Invalid/blank votes | 486,091 | – | – | – |
Total | 6,012,062 | 100 | 106 | 0 |
Source: Belgian Elections |
General elections were held in Belgium on 26 June 1949. Several reforms took effect prior to the elections; they were the first after the introduction of universal women's suffrage; the number of seats in the Chamber of Representatives was increased from 202 to 212, and from now on, elections for the nine provincial councils were held simultaneously with parliamentary elections. The number of Chamber seats and the simultaneous provincial and parliamentary elections would remain unchanged until state reforms in 1993.
General elections were held in Belgium on 26 March 1961. The result was a victory for the Christian Social Party, which won 96 of the 212 seats in the Chamber of Representatives and 47 of the 106 seats in the Senate. Voter turnout was 92.3%. Elections for the nine provincial councils were also held.
General elections were held in Belgium on 20 November 1921. The result was a victory for the Catholic Party, which won 70 of the 186 seats in the Chamber of Representatives. Voter turnout was 91.1% in the Chamber election and 91.0% in the Senate election.
Federal elections were held in Switzerland on 28 October 1928. Although the Social Democratic Party received the most votes, the Free Democratic Party remained the largest party in the National Council, winning 58 of the 198 seats.
Federal elections were held in Switzerland on 25 October 1931. Although the Social Democratic Party received the most votes, the Free Democratic Party remained the largest party in the National Council, winning 52 of the 187 seats.
Federal elections were held in Switzerland on 23 October 1983. The Free Democratic Party emerged as the largest party in the National Council, winning 54 of the 200 seats. It was the first time the Social Democratic Party had not received the most votes in a federal election since 1925.
Federal elections were held in Switzerland on 29 October 1967. The Social Democratic Party remained the largest party in the National Council, winning 50 of the 200 seats.
Federal elections were held in Switzerland on 27 October 1963. The Social Democratic Party emerged as the largest party in the National Council, winning 53 of the 200 seats.
Federal elections were held in Switzerland on 25 October 1959. The Social Democratic Party and the Free Democratic Party emerged as the largest parties in the National Council, each winning 51 of the 196 seats.
Federal elections were held in Switzerland on 30 October 1955. The Social Democratic Party emerged as the largest party in the National Council, winning 53 of the 196 seats.
Federal elections were held in Switzerland on 28 October 1951. Although the Social Democratic Party received the most votes, the Free Democratic Party remained the largest party in the National Council, winning 51 of the 196 seats.
Federal elections were held in Switzerland on 26 October 1947. Although the Social Democratic Party received the most votes, the Free Democratic Party emerged as the largest party in the National Council, winning 52 of the 194 seats.
Parliamentary elections were held in Andorra on 9 December 1981, with a second round of voting on 16 December. Local elections were held on the same day. Following the elections, Òscar Ribas Reig became the country's first Prime Minister.
Full general elections were held in Belgium on 14 October 1894, with run-off elections held on 21 October 1894.
Federal elections were held in Switzerland on 26 October 1919. The Free Democratic Party emerged as the largest party in the National Council, winning 60 of the 189 seats.
Federal elections were held in Switzerland on 29 October 1922. The Free Democratic Party remained the largest party in the National Council, winning 60 of the 198 seats.
Federal elections were held in Switzerland on 25 October 1925. The Free Democratic Party remained the largest party in the National Council, winning 60 of the 198 seats.
Federal elections were held in Switzerland on 27 October 1935. The Social Democratic Party emerged as the largest party in the National Council, winning 50 of the 187 seats.
Federal elections were held in Switzerland on 29 October 1939. The Free Democratic Party emerged as the largest party in the National Council, winning 49 of the 187 seats. Due to the outbreak of World War II, there were no elections in nine of the 25 cantons; Appenzell Ausserrhoden, Lucerne, Neuchâtel, Schwyz, Solothurn, Ticino, Valais, Vaud and Zug. In what became known as "silent elections", a total of 55 candidates were elected unopposed.
Federal elections were held in Switzerland on 31 October 1943. The Social Democratic Party emerged as the largest party in the National Council, winning 56 of the 194 seats.