Bristol City Council election, 1983

Last updated
Bristol City Council election, 1983
Flag of England.svg
  1979 5 May 1983 1984  

All 68 seats to Bristol City Council
35 seats needed for a majority

  First party Second party Third party
 
Party Conservative Labour SDP–Liberal Alliance
Seats won 32 30 6

Council control before election

Labour Party (UK)

Council control after election

No Overall Control

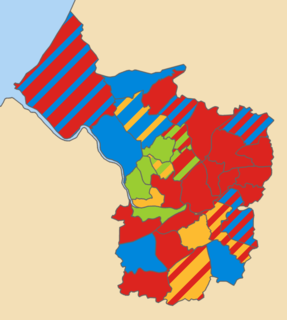
1983 local election results in Bristol Bristol ward results 1983.png
1983 local election results in Bristol

The 1983 Bristol City Council election took place on 5 May 1983 to elect members of Bristol City Council in England. This was on the same day as other local elections. All seats were up for election, two seats in every ward, due to the introduction of new ward boundaries. Therefore, direct comparisons with previous elections are not possible. Majority is the number of votes separating the 2nd and 3rd candidates. Alliance candidates who were Liberals are described as such. No party had an overall majority; as the largest party the Conservatives formed a minority administration.

Bristol City Council local authority of Bristol, England

Bristol City Council is the local authority of Bristol, England. The council is a unitary authority, and is unusual in the United Kingdom in that its executive function is controlled by a directly elected mayor of Bristol. Bristol has 35 wards, electing a total of 70 councillors.

Contents

Ward results

Ashley

Ashley
PartyCandidateVotes%±
Labour K.A. Bassett 2,060 51.8
Labour M.J. Shotter 1,880
Conservative C.M. O'Leary 1,091 27.4
Conservative B.J. Mitchell 1,089
Liberal J.J. Errington 477 12.0
SDP–Liberal Alliance M.F. Pratt 372
Ecology J.S. Jameson 188 4.7
Communist V. Ralph 163 4.1
Majority 789

Avonmouth

Avonmouth
PartyCandidateVotes%±
Labour V.W. Pople 2,184 50.5
Labour A. Crowley 2,147
Conservative W.T. Lippiatt 1,512 34.9
Conservative S.M. Tanner 1,462
SDP–Liberal Alliance M.C. Brown 632 14.6
SDP–Liberal Alliance C.F. Slater 617
Majority 635

Bedminster

Bedminster
PartyCandidateVotes%±
Conservative I.P. Gillard 1,888 45.9
Labour A.E. Hillman 1,734 42.2
Conservative J.M. Fey 1,731
Labour J.E. Wood 1,729
SDP–Liberal Alliance P.P. Hoare 489 11.9
SDP–Liberal Alliance R.M. Kirkham 477
Majority 3

Bishopston

Bishopston
PartyCandidateVotes%±
Conservative D. Topham 2,265 42.6
Conservative M.C. Withers 2,164
Labour H. Bashforth 1,658 31.2
Labour M.C. Georghiou 1,628
Liberal A.M. Carter 1,201 22.6
SDP–Liberal Alliance S.V. Spilsbury 1,134
Ecology A. Clarke 196 3.7
Majority 506

Bishopsworth

Bishopsworth
PartyCandidateVotes%±
Conservative V.E. Goodland 1,342 43.0
Labour D.M. Jackson 1,265 40.6
Labour J.R.G. Comerford 1,254
Conservative D.E. Humphry 1,151
SDP–Liberal Alliance C.M. Sharland 511 16.4
SDP–Liberal Alliance V.P. Thomas 420
Majority 11

Brislington East

Brislington East
PartyCandidateVotes%±
Labour D.R. Parsons 2,020 40.9
Labour C.C. Reid 1,792
Conservative R.J. Wynne 1,704 34.5
Conservative T.W. Bray 1,648
Independent Labour K.P. Legg 698 14.1
SDP–Liberal Alliance P.J. Gingell 519 10.5
SDP–Liberal Alliance J.W. Hale 404
Majority 88

Brislington West

Brislington West
PartyCandidateVotes%±
Conservative M.M. Lippitt 2,008 45.7
Conservative O.B. Scantlebury 1,973
Labour G.E. Maggs 1,221 27.8
Labour C.L. Orlik 1,170
SDP–Liberal Alliance B.G. Clarke 1,163 26.5
SDP–Liberal Alliance R.T. Parsons 1,127
Majority 752

Cabot

Cabot
PartyCandidateVotes%±
SDP–Liberal Alliance R.J. Howell 1,642 43.1
SDP–Liberal Alliance I.H. Dunn 1,515
Conservative T.V. Barrington 1,256 33.0
Conservative B.C. Hubble 1,190
Labour M.P. Broussine 752 19.7
Ecology M. McClelland 160 4.2
Majority 259

Clifton

Clifton
PartyCandidateVotes%±
Conservative J.R. Kerridge 2,062 44.6
Conservative J. Lloyd-Kirk 2,014
SDP–Liberal Alliance J.F. Gray 1,644 35.5
SDP–Liberal Alliance R.A. Smith 1,595
Labour A.E. Thomas 808 17.5
Labour K.K. Anand 696
Clock Party N. Fox 111 2.4
Clock Party N. Tubbs 72
Majority 370

Cotham

Cotham
PartyCandidateVotes%±
Conservative G. Hebblethwaite 1,931 43.5
Conservative W.E. Blackmore 1,722
Liberal G. Box 1,478 33.3
Liberal N.A. Winch 1,372
Labour A.W. MacCallum 804 18.1
Labour A.M. Thyer 763
Ecology C.A. Rose 222 5.0
Majority 244

Easton

Easton
PartyCandidateVotes%±
Liberal S.R. Comer 1,965 50.5
Liberal J.F. Kiely 1,907
Labour J.H. King 1,309 33.6
Labour D. McLaren 1,187
Conservative I.D. Millard 535 13.7
Conservative J.M. Short 498
Communist D.E. Esbester 83 2.1
Majority 598

Eastville

Eastville
PartyCandidateVotes%±
Conservative J.A. Vowles 1,821 42.3
Conservative D.A. Fey 1,732
Labour W.G. Williams 1,379 32.0
Labour R.A. Fehler 1,147
SDP–Liberal Alliance P. Hawkesworth 1,019 23.7
SDP–Liberal Alliance P.H. Main 894
Ecology G.A. Dorey 88 2.0
Majority 353

Filwood

Filwood
PartyCandidateVotes%±
Labour V.J. Hicks 1,703 70.9
Labour W.W. Jenkins 1,488
Conservative M. MacDonald 425 17.7
Conservative P.J. Sidebottom 293
Liberal A. Elkan 212 8.8
Liberal A.F. Ryder 205
Communist A. Chester 61 2.5
Majority 1,063

Frome Vale

Frome Vale
PartyCandidateVotes%±
Conservative K.I. Blanchard 2,040 41.9
Conservative J.M. Bosdet 1,951
Labour C.I. Rust 1,893 38.9
Labour E.G. Skuse 1,825
SDP–Liberal Alliance R.H. Long 934 19.2
SDP–Liberal Alliance S.D. Long 797
Majority 58

Hartcliffe

Hartcliffe
PartyCandidateVotes%±
Labour F.H. Pidgeon 1,701 50.4
Labour B.B. Richards 1,632
Conservative L.E. Vann 990 29.3
Conservative K.P. Godden 982
SDP–Liberal Alliance R.T. Rowe 685 20.3
SDP–Liberal Alliance R.S. Sharland 670
Majority 642

Henbury

Henbury
PartyCandidateVotes%±
Labour J.D. Fisk 2,046 45.1
Conservative P.G. Gollop 1,906 42.0
Conservative P.B. Evans 1,899
Labour G.M. Head 1,640
SDP–Liberal Alliance R.A. Coombs 585 12.9
SDP–Liberal Alliance P.H. Cole 521
Majority 7

Hengrove

Hengrove
PartyCandidateVotes%±
Conservative A.J. Telling 2,370 53.2
Conservative S.C. Williams 2,354
Labour A.B. Abrams 1,544 34.6
Labour J.M. Smith 1,496
SDP–Liberal Alliance M.C. Blundell 545 12.2
SDP–Liberal Alliance R.M. Virgo 518
Majority 810

Henleaze

Henleaze
PartyCandidateVotes%±
Conservative G.J. Browne 3,221 65.8
Conservative P. Paternoster 3,106
Liberal D.N. Clarke 1,117 22.8
Liberal B.J. Blanchard 1,094
Labour R. Chamberlain 558 11.4
Labour M.D. Vokins 538
Majority 1,989

Hillfields

Hillfields
PartyCandidateVotes%±
Labour G.R. Robertson 1,672 47.7
Labour J.D. Naysmith 1,641
Conservative J.D. Seville 1,203 34.3
Conservative R.C. Walker 1,099
Liberal J.S. Wright 631 18.0
Liberal A.J. Humphrey 624
Majority 438

Horfield

Horfield
PartyCandidateVotes%±
Conservative B.J.D. Topham 2,330 44.5
Conservative F.J. Apperley 2,229
SDP–Liberal Alliance C. Boney 1,677 32.0
SDP–Liberal Alliance P.J. Hurford 1,487
Labour I.M. Knight 1,158 22.1
Labour T. Morgan 1,137
Ecology C.S. Jameson 73 1.4
Majority 552

Kingsweston

Kingsweston
PartyCandidateVotes%±
Labour T.R. Thomas 1,868 46.2
Conservative R. Mellor 1,619 40.0
Labour A.E. Tudball 1,607
Conservative S.F. Gorringe 1,437
SDP–Liberal Alliance J.G. Miller 556 13.8
SDP–Liberal Alliance A.D. West 547
Majority 12

Knowle

Knowle
PartyCandidateVotes%±
Labour A. Munroe 1,420 46.1
Labour J. McLaren 1,287
Conservative G. Bridcut 1,260 40.9
Conservative S. Roberts 1,109
SDP–Liberal Alliance S.E. Bateman 403 13.1
SDP–Liberal Alliance G. taylor 371
Majority 27

Lawrence Hill

Lawrence Hill
PartyCandidateVotes%±
Labour J. Jones 2,329 66.4
Labour D.B. Tedder 1,987
Conservative G.H.W. Woodhouse 618 17.6
Conservative S.C. Trench 616
SDP–Liberal Alliance J.R. McCullough 558 15.9
SDP–Liberal Alliance A.W.J. Wilcox 520
Majority 1,369

Lockleaze

Lockleaze
PartyCandidateVotes%±
Labour C.E. Merrett 1,922 49.0
Labour J. Hynes 1,726
Conservative D. MacFarlane 1,026 26.2
Conservative J.E.V. Henley 989
SDP–Liberal Alliance H.L. Myers 973 24.8
SDP–Liberal Alliance P.T. Nagle 762
Majority 700

Redland

Redland
PartyCandidateVotes%±
Conservative T.M. Allen 2,491 52.8
Conservative R.S. Trench 2,429
SDP–Liberal Alliance J. Freeland 1,019 21.6
SDP–Liberal Alliance R.C. Westbury-Jones 901
Labour R.J. Ritchie 869 18.4
Labour S.J. Sims 826
Ecology T.R. Leegwater 338 7.2
Majority 1,410

St George East

St. George East
PartyCandidateVotes%±
Conservative K.M. Mountstephen 1,773 46.7
Conservative R.E. King 1,627
Labour P.W. Hammond 1,504 39.6
Labour G. Bee 1,402
SDP–Liberal Alliance J.A. Hoddell 521 13.7
SDP–Liberal Alliance G.G. Morgan 491
Majority 123

St George West

St. George West
PartyCandidateVotes%±
Liberal R.G.H. Lewis 1,414 41.2
Liberal J. Myers 1,256
Labour J. McLaren 1,210 35.2
Labour D.P. Beer 1,168
Conservative A.L. Blevins-Walker 810 23.6
Conservative M.E.C. Stump 732
Majority 46

Southmead

Southmead
PartyCandidateVotes%±
Labour B. Begley 1,757 50.0
Labour D.L. Hughes 1,750
Conservative D.W. Dowling 1,288 36.6
Conservative I.D.G. Roberts 1,190
Liberal G.R. Beddoes 471 13.4
Liberal M.J. Turner 447
Majority 462

Southville

Southville
PartyCandidateVotes%±
Labour A.J. May 2,088 45.9
Labour R.W. Walthon 1,928
Conservative R.S. Merriott 1,566 34.4
Conservative T.J. Skipp 1,542
SDP–Liberal Alliance A.M. Mason 781 17.2
SDP–Liberal Alliance J.R. Osborne 677
Ecology G. Pollard 112 2.5
Majority 362

Stockwood

Stockwood
PartyCandidateVotes%±
Conservative M.A. Stamper 2,666 51.3
Conservative C.J. Williams 2,618
Labour I. Douglas 1,867 35.9
Labour J.A. Patterson 1,812
Liberal R.I. Johnson 661 12.7
SDP–Liberal Alliance M.V. Pipping 490
Majority 751

Stoke Bishop

Stoke Bishop
PartyCandidateVotes%±
Conservative P.J. Abraham 3,705 67.5
Conservative C.D.M.B. Alderson 3,667
SDP–Liberal Alliance P.V. Griew 846 15.4
Liberal J.F. Farrand 838
Labour M.I. Waddington 728 13.3
Labour R.G. Moss 693
Ecology G.A.R. Sawday 212 3.9
Majority 2,821

Westbury-on-Trym

Westbury-on-Trym
PartyCandidateVotes%±
Conservative D.H. Poole 3,884 73.3
Conservative R.W. Wall 3,788
Liberal M.C. Hamilton 781 14.7
SDP–Liberal Alliance E. Jacobs 728
Labour D.V. Evans 551 10.4
Labour A.N. Gillett 542
Ecology A.C. Hosegood 82 1.5
Majority 3,007

Whitchurch Park

Whitchurch Park
PartyCandidateVotes%±
Labour H.W.M. Willcox 1,783 55.8
Labour C. Draper 1,353
Conservative E.M. MacDonald 874 27.3
Conservative M.B. Tellford Beasley 825
SDP–Liberal Alliance J.C. Cassidy 541 16.9
SDP–Liberal Alliance J.A. Rowe 535
Majority 479

Windmill Hill

Windmill Hill
PartyCandidateVotes%±
Labour G. Micklewright 2,445 50.0
Labour P. Tatlow 2,373
Conservative W.R. Biggs 1,711 35.0
Conservative P.L. Roberts 1,634
SDP–Liberal Alliance A.F. Akerman 738 15.1
SDP–Liberal Alliance F. Thomas 737
Majority 662

Sources

Related Research Articles

Oxford East (UK Parliament constituency) Parliamentary constituency in the United Kingdom

Oxford East is a constituency represented in the House of Commons of the UK Parliament by Anneliese Dodds of the Labour Party.

Bristol West (UK Parliament constituency) Parliamentary constituency in the United Kingdom

Bristol West is a borough constituency represented in the House of Commons of the Parliament of the United Kingdom. It covers the central and western parts of Bristol.

Derby North (UK Parliament constituency) Parliamentary constituency in the United Kingdom

Derby North is a constituency formed of part of the city of Derby represented in the House of Commons of the UK Parliament since 2017 by Chris Williamson, of the Labour Party. On 27 February 2019, Williamson was suspended from the Labour Party, he now sits as an Independent.

Bristol North West (UK Parliament constituency) Parliamentary constituency in the United Kingdom

Bristol North West is a constituency to the north and north-west of Bristol city centre represented in the House of Commons of the UK Parliament since 2017 by Darren Jones of the Labour Party.

Bristol East (UK Parliament constituency) Parliamentary constituency in the United Kingdom

Bristol East is a constituency recreated in 1983 covering the eastern part of the City of Bristol, represented in the House of Commons of the UK Parliament since 2005 by Kerry McCarthy of the Labour Party. An earlier guise of the seat existed between 1885 and 1950.

Politics of Bristol

The city of Bristol, England, is a unitary authority, represented by four MPs representing seats wholly within the city boundaries. As well as these, Filton and Bradley Stoke covers the northern urban fringe in South Gloucestershire and the north eastern urban fringe is in the Kingswood constituency. The overall trend of both local and national representation became left of centre, favouring the Labour Party and Liberal Democrats during the latter 20th century, but there was a shift to the right in the 2010 general election. The city has a tradition of local activism, with environmental issues and sustainable transport being prominent issues in the city.
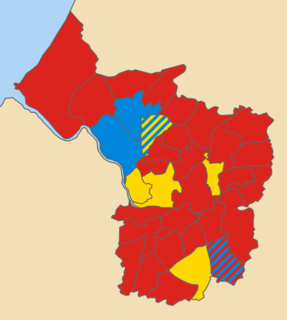
1995 Bristol City Council election

The 1995 Bristol City Council election took place on 4 May 1995 with all seats being up for election, in preparation for Bristol City Council becoming a Unitary Authority following the abolition of Avon County Council. The same ward boundaries were used, however these are elections to a new authority and cannot be considered gains or losses compared to previously held seats.

St George West (ward) electoral ward of the unitary authority of Bristol

St George West is a district (Ward) of Bristol. Its councillors are Ron Stone and Peter Hammond . It can be found in the outer east of the city of Bristol. According to a report released by Bristol City Council, St George West has an average crime rate.
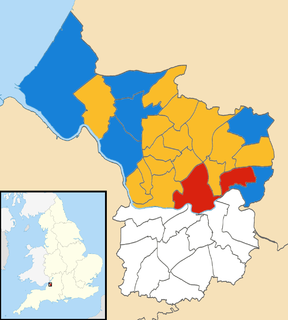
2009 Bristol City Council election

The 2009 Bristol City Council elections were held on Thursday 4 June 2009, for 23 seats, that being one-third of the total number of councilors. The Liberal Democrats who had been leading a minority administration, won an overall majority of the council, the first time the party had achieved this on Bristol City Council. The Liberal Democrats were defending 11 seats, the Labour Party 10 and the Conservatives 2.

2007 Winchester City Council election

The 2007 Winchester Council election took place on 3 May 2007 to elect members of Winchester District Council in Hampshire, England. One third of the council was up for election and the Conservative party stayed in overall control of the council.

2010 Barnet London Borough Council election

The 2010 Barnet Council election took place on 6 May 2010 to elect members of Barnet London Borough Council in London, England. The whole council was up for election and the Conservative party stayed in overall control of the council.

2010 Bristol City Council election

The 2010 Bristol City Council elections were held on Thursday 6 May 2010, for 23 seats, that being one third of the total number of councillors. The Liberal Democrats, who had won overall control of the council in 2009, increased their majority to six seats.

2010 Plymouth City Council election

The 2010 Plymouth City Council election was held on 6 May 2010 to elect members of Plymouth City Council in England.

The 2011 council elections in Guildford saw the Conservatives retain control over Guildford Borough Council with an increased majority of 20 seats. Full results for each ward can be found at Guildford Council election, full results, 2011.
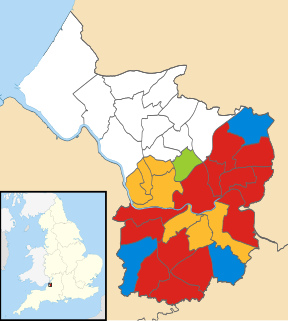
2011 Bristol City Council election

The 2011 Bristol City Council elections were held on Thursday 5 May 2011, for 24 seats, that being one third of the total number of councillors. The Liberal Democrats, who had won overall control of the council in 2009 and increased their majority in 2010, experienced a drop in support and lost 5 seats; 4 to the Labour Party and 1 to the Green Party, which gained its second ever council seat in Bristol. This meant that the Lib Dems no longer had a majority on the council. However, they continued to run the council, relying on opposition groups to vote through any proposal.

2014 St Albans City and District Council election

The 2014 St Albans City and District Council election took place on 22 May 2014 to elect members of St Albans District Council in Hertfordshire, England. One third of the council was up for election and the council stayed under no overall control.

2014 Enfield London Borough Council election

The 2014 Enfield Council election took place on 22 May 2014 to elect members of Enfield London Borough Council in London, England. The whole council was up for election and the Labour party retained overall control of the council, increasing their majority over the Conservative party by five seats.
2016 Bristol City Council election

The 2016 Bristol City Council election took place on Thursday 5 May 2016, alongside nationwide local elections. Following a boundary review, the number of wards in the City was reduced to 34, with each electing one, two or three Councillors. The overall number of Councillors remained 70, with all seats are up for election at the same time. Elections would then be held every 4 years.

1999 Bristol City Council election

The 1999 Bristol City Council election took place on 6 May 1999, on the same day as other local elections. All seats were up for election due to boundary changes, with each ward electing 2 councillors. The total number of seats on the council increased by 2 due to the creation of a new ward: Clifton East.

2016 Exeter City Council election

The 2016 Exeter City Council election took place on 5 May 2016, to elect members of Exeter City Council in England. Following boundary changes, the entire council was up for election, and all 13 wards were contested, each electing three councillors. The election was held concurrently with other local elections held in England on the 5 May.