Elections to Eastleigh Council were held on 4 May 2010. One third of the council was up for election and the Liberal Democrat party kept overall control of the council.
The Liberal Democrats are a liberal political party in the United Kingdom. They presently have 11 Members of Parliament in the House of Commons, 96 members of the House of Lords, and one member of the European Parliament. They also have five Members of the Scottish Parliament and a member each in the Welsh Assembly and London Assembly. The party reached the height of its influence in the early 2010s, forming a junior partner in a coalition government from 2010 to 2015. It is presently led by Vince Cable.
After the election, the composition of the council was
Party | Seats | Gains | Losses | Net gain/loss | Seats % | Votes % | Votes | +/− | |
---|---|---|---|---|---|---|---|---|---|
Liberal Democrat | 13 | 1 | 0 | +1 | 81.3 | ||||
Conservative | 2 | 0 | 0 | 0 | |||||
Labour | 1 | 0 | 1 | -1 | |||||
UKIP | 0 | 0 | 0 | 0 | 0 | ||||
Independent | 0 | 0 | 0 | 0 | 0 | ||||
Party | Candidate | Votes | % | ± | |
---|---|---|---|---|---|
Liberal Democrat | Catherine Fraser | 1,528 | 51.1 | ||
Conservative | Jerry Hall | 1,160 | 38.9 | ||
Labour | Geoffrey Kosted | 170 | 5.7 | ||
UKIP | Peter Stewart | 126 | 4.2 | ||
Majority | |||||
Turnout | 2984 | 74.1 | |||
Liberal Democrat hold | Swing | ||||
Party | Candidate | Votes | % | ± | |
---|---|---|---|---|---|
Liberal Democrat | Justin Baker | 2025 | 52.1 | ||
Conservative | John Milne | 1371 | 35.2 | ||
Labour | justin Baker | 298 | 7.7 | ||
UKIP | Beryl Humphrey | 196 | 4.9 | ||
Majority | |||||
Turnout | 3980 | 67.0 | |||
Liberal Democrat hold | Swing | ||||
Party | Candidate | Votes | % | ± | |
---|---|---|---|---|---|
Liberal Democrat | Pam Holden-Brown | 1348 | 49.3 | ||
Conservative | John Milne | 1019 | 37.3 | ||
Labour | Beryl Addison | 211 | 7.7 | ||
UKIP | Paul Webber | 155 | 5.7 | ||
Majority | 329 | 12.0 | |||
Turnout | 2733 | 72.7 | |||
Liberal Democrat hold | Swing | ||||
Party | Candidate | Votes | % | ± | |
---|---|---|---|---|---|
Liberal Democrat | Alan Broadhurst | 1779 | 51.9 | ||
Conservative | Cindy George | 1295 | 37.8 | ||
Labour | Philip Grice | 236 | 6.9 | ||
UKIP | Angela Young | 115 | 3.4 | ||
Majority | |||||
Turnout | 3429 | 73.7 | |||
Liberal Democrat hold | Swing | ||||
Party | Candidate | Votes | % | ± | |
---|---|---|---|---|---|
Liberal Democrat | 2604 | 54.7 | |||
Conservative | 1015 | 21.3 | |||
Labour | 793 | 16.7 | |||
UKIP | 262 | 5.5 | |||
Independent | 83 | 1.7 | |||
Turnout | 4757 | 60.95 | |||
Liberal Democrat hold | Swing | ||||
Party | Candidate | Votes | % | ± | |
---|---|---|---|---|---|
Liberal Democrat | Maureen Sollitt | 2329 | 54.9 | ||
Conservative | 1215 | 28.6 | |||
Labour | 517 | 12.2 | |||
UKIP | 182 | 4.3 | |||
Majority | |||||
Turnout | 4,243 | 67.47 | |||
Liberal Democrat hold | Swing | ||||
Party | Candidate | Votes | % | ± | |
---|---|---|---|---|---|
Liberal Democrat | Roy Sollitt | 1831 | 48.6 | ||
Labour | Peter Luffman | 878 | 23.3 | ||
Conservative | Felicity Smith | 841 | 22.3 | ||
UKIP | George Stewart | 221 | 5.9 | ||
Majority | |||||
Turnout | 3771 | 61.66 | |||
Liberal Democrat gain from Labour | Swing | ||||
Party | Candidate | Votes | % | ± | |
---|---|---|---|---|---|
Liberal Democrat | Des Scott | 2,737 | 54.2 | ||
Conservative | Christopher Rhodes | 1,703 | 31.5 | ||
Labour | Mary Shephard | 336 | 6.2 | ||
UKIP | Hugh McGuinness | 273 | 5.0 | ||
Majority | 1034 | 34.3 | |||
Turnout | 5,409 | 75.1 | |||
Liberal Democrat hold | Swing | ||||
Party | Candidate | Votes | % | ± | |
---|---|---|---|---|---|
Liberal Democrat | Louise Bloom | 1,019 | 61.2 | +6.3 | |
Conservative | Paul Philp | 562 | 33.7 | -7.3 | |
Labour | George Carter | 46 | 2.8 | -1.3 | |
UKIP | Caroline Bradbeer | 39 | 2.3 | +2.3 | |
Majority | 457 | 27.5 | +13.6 | ||
Turnout | 1,666 | 38.5 | +10.4 | ||
Liberal Democrat hold | Swing | ||||
Party | Candidate | Votes | % | ± | |
---|---|---|---|---|---|
Liberal Democrat | Julie Skinner | 1,298 | 50.9 | -1.7 | |
Conservative | Jeremy Hall | 1,006 | 39.5 | +7.6 | |
UKIP | Michale O'Donoghue | 246 | 9.6 | -0.3 | |
Majority | 292 | 11.4 | -9.3 | ||
Turnout | 2,550 | 43.5 | +4.1 | ||
Liberal Democrat gain from Conservative | Swing | ||||
Party | Candidate | Votes | % | ± | |
---|---|---|---|---|---|
Liberal Democrat | Keith House | 920 | 58.5 | +6.2 | |
Conservative | Peter Hudson | 550 | 35.0 | -5.5 | |
UKIP | Frederick Estall | 103 | 6.5 | +6.5 | |
Majority | 370 | 23.5 | +11.7 | ||
Turnout | 1,573 | 38.6 | +10.1 | ||
Liberal Democrat hold | Swing | ||||
Party | Candidate | Votes | % | ± | |
---|---|---|---|---|---|
Conservative | John Caldwell | 1,326 | 63.3 | +2.4 | |
Liberal Democrat | Peter Child | 587 | 28.0 | -5.7 | |
UKIP | Marion Stewart | 109 | 5.2 | +5.2 | |
Labour | Beryl Addison | 73 | 3.5 | -1.9 | |
Majority | 739 | 35.3 | +8.1 | ||
Turnout | 2,095 | 51.0 | -3.3 | ||
Conservative hold | Swing | ||||
Party | Candidate | Votes | % | ± | |
---|---|---|---|---|---|
Conservative | Colin Davidovitz | 994 | 50.6 | +1.7 | |
Liberal Democrat | Grahame Smith | 839 | 42.7 | -5.2 | |
UKIP | Vivienne Young | 79 | 4.0 | +4.0 | |
Labour | Kevin Butt | 53 | 2.7 | -0.5 | |
Majority | 155 | 7.9 | +6.9 | ||
Turnout | 1,965 | 48.1 | -3.6 | ||
Conservative hold | Swing | ||||
Party | Candidate | Votes | % | ± | |
---|---|---|---|---|---|
Liberal Democrat | Bruce Tennent | 871 | 54.0 | +9.6 | |
Conservative | Neville Dickinson | 577 | 35.8 | -11.1 | |
Labour | Edith Durham | 100 | 6.2 | -2.6 | |
UKIP | Daniel Bradbeer | 64 | 4.0 | +4.0 | |
Majority | 294 | 18.2 | |||
Turnout | 1,612 | 41.2 | +9.4 | ||
Liberal Democrat hold | Swing | ||||
Party | Candidate | Votes | % | ± | |
---|---|---|---|---|---|
Liberal Democrat | Joyce Sortwell | 960 | 56.5 | +8.4 | |
Conservative | Reginald Campbell | 515 | 30.3 | -11.4 | |
Labour | Daniel Clarke | 125 | 7.4 | -2.9 | |
UKIP | Peter Stewart | 98 | 5.8 | +5.8 | |
Majority | 445 | 26.2 | +19.8 | ||
Turnout | 1,698 | 37.7 | |||
Liberal Democrat hold | Swing | ||||
Preceded by Eastleigh Council election, 2008 | Eastleigh local elections | Succeeded by Eastleigh Council election, 2011 |
As a result of the 2009 structural changes to local government in England, the former Wiltshire County Council and the four districts within its geographical area were replaced by the new Wiltshire Council, which is a unitary authority covering the same area, with elections continuing to be held every four years, beginning in June 2009. Previously, Wiltshire County Council had been elected between 1889 and 2005, initially every three years, later every four years.
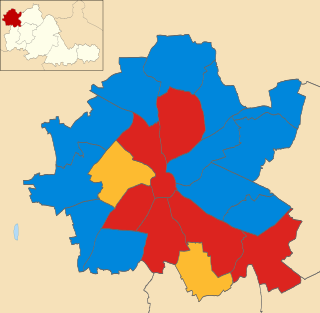
Elections to Wolverhampton City Council were held on 1 May 2008 in Wolverhampton, England. One third of the council was up for election and the Labour group lost overall control after losing eight seats across the City.
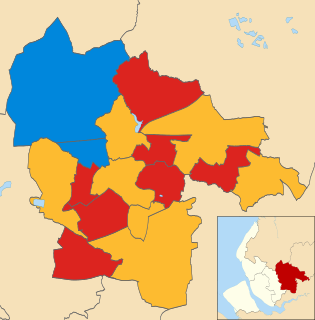
The 2007 St Helens Metropolitan Borough Council election took place on 3 May 2007 to elect members of St Helens Metropolitan Borough Council in Merseyside, England. One third of the council was up for election and the council stayed under no overall control.
The 2003 Worthing Borough Council election took place on 1 May 2003 to elect members of Worthing Borough Council in West Sussex, England. One third of the council was up for election and the Liberal Democrats lost overall control of the council to no overall control. Overall turnout was 28.61%.
The 2007 Hull City Council election took place on 3 May 2007 to elect members of Hull City Council in England. One third of the council was up for election and the Liberal Democrats gained overall control of the council from no overall control. Overall turnout was 27%.
The 2004 Winchester Council election took place on 10 June 2004 to elect members of Winchester District Council in Hampshire, England. One third of the council was up for election and the Liberal Democrats lost overall control of the council to no overall control.
The 2004 Harrogate Council election took place on 10 June 2004 to elect members of Harrogate Borough Council in North Yorkshire, England. One third of the council was up for election and the Conservative party stayed in overall control of the council.
The 1998 Pendle Borough Council election took place on 7 May 1998 to elect members of Pendle Borough Council in Lancashire, England. One third of the council was up for election and the Liberal Democrats stayed in overall control of the council.
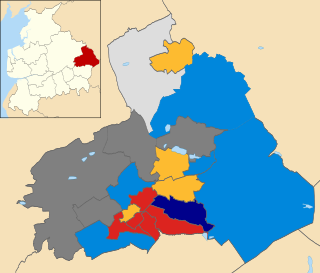
The 1999 Pendle Borough Council election took place on 6 May 1999 to elect members of Pendle Borough Council in Lancashire, England. One third of the council was up for election and the Liberal Democrats lost overall control of the council to no overall control.
The 2007 Pendle Borough Council election took place on 3 May 2007 to elect members of Pendle Borough Council in Lancashire, England. One third of the council was up for election and the Liberal Democrats stayed in overall control of the council.
The 2008 Pendle Borough Council election took place on 1 May 2008 to elect members of Pendle Borough Council in Lancashire, England. One third of the council was up for election and the Liberal Democrats lost overall control of the council to no overall control.
The 2000 Sandwell Metropolitan Borough Council election took place on 4 May 2000 to elect members of Sandwell Metropolitan Borough Council in the West Midlands, England. One third of the council was up for election and the Labour party stayed in overall control of the council.
Elections for Cambridge City Council were held on Thursday 3 May 2012. One third of the council was up for election and the Liberal Democrats lost overall control of the council, to No Overall Control.
The 2012 St Albans City and District Council election took place on 3 May 2012 to elect members of St Albans District Council in Hertfordshire, England. One third of the council was up for election and the council stayed under no overall control.
The 2000 Colchester Borough Council election took place on 4 May 2000 to elect members of Colchester Borough Council in Essex, England. One third of the council was up for election and the council stayed under no overall control.
The 2008 Colchester Borough Council election took place on 1 May 2008 to elect members of Colchester Borough Council in Essex, England. One third of the council was up for election and the Conservative party lost overall control of the council to no overall control.
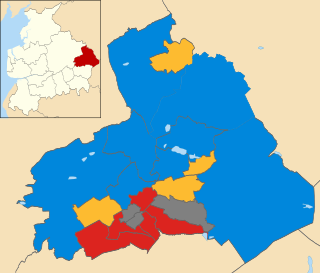
The 2011 Pendle Borough Council election took place on 5 May 2011 to elect members of Pendle Borough Council in Lancashire, England. One third of the council was up for election and the council stayed under no overall control.
The 2012 Pendle Borough Council election took place on 3 May 2012 to elect members of Pendle Borough Council in Lancashire, England. One third of the council was up for election and the council stayed under no overall control.
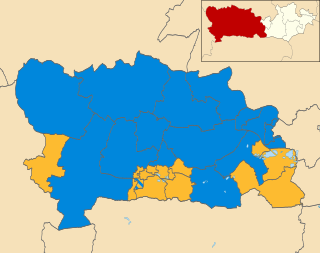
The 2003 West Berkshire Council election took place on 1 May 2003 to elect members of West Berkshire Council in Berkshire, England. The whole council was up for election with boundary changes since the last election in 2000 reducing the number of seats by 2. The Liberal Democrats lost overall control of the council to no overall control.
The 2018 Wokingham Borough Council election took place on Thursday 3 May 2018. That was the same day as other United Kingdom local elections in order to elect members of Wokingham Unitary Council in Berkshire, England. One third of the council was up for election and the Conservative party stayed comfortably in overall control of the council.