This is a list of electoral results for the division of Clark and Denison in Tasmanian elections from 1913 through 1969
Party | Candidate | Votes | % | ±% | |
---|---|---|---|---|---|
Quota | 4,921 | ||||
Liberal | Nigel Abbott (elected 1) | 5,144 | 13.1 | +6.7 | |
Liberal | Robert Mather (elected 3) | 3,084 | 7.8 | +2.6 | |
Liberal | Max Bingham (elected 4) | 2,999 | 7.6 | +7.6 | |
Liberal | Ronald Banks | 2,182 | 5.5 | +5.5 | |
Liberal | Bob Baker (elected 5) | 1,622 | 4.1 | +4.1 | |
Liberal | George Brown | 1,524 | 3.9 | +0.9 | |
Liberal | Horace Strutt | 1,086 | 2.8 | +1.1 | |
Liberal | John Hand | 1,035 | 2.6 | +2.6 | |
Labor | Merv Everett (elected 2) | 5,073 | 12.9 | +2.5 | |
Labor | Ken Austin (elected 6) | 3,213 | 8.2 | +3.3 | |
Labor | Neil Batt (elected 7) | 2,978 | 7.6 | +7.6 | |
Labor | Harry McLoughlin | 2,692 | 6.8 | −5.8 | |
Labor | Reginald Richardson | 971 | 2.5 | +2.5 | |
Labor | Albert Schluter | 889 | 2.3 | +2.3 | |
Labor | Malcolm Hills | 739 | 1.9 | +1.9 | |
Labor | Donald Finlay | 643 | 1.6 | +1.6 | |
Independent | Bill Wedd | 2,395 | 6.1 | +2.7 | |
Democratic Labor | Michael Delaney | 685 | 1.7 | +1.7 | |
Democratic Labor | Leslie Foley | 160 | 0.4 | +0.4 | |
Centre | Jim Campbell | 142 | 0.4 | +0.4 | |
Centre | James Rimmer | 106 | 0.3 | +0.3 | |
Total formal votes | 39,362 | 95.0 | −0.5 | ||
Informal votes | 2,055 | 5.0 | +0.5 | ||
Turnout | 41,417 | 92.9 | −1.1 | ||
Party total votes | |||||
Liberal | 18,676 | 47.4 | +2.5 | ||
Labor | 17,198 | 43.7 | −0.3 | ||
Independent | Bill Wedd | 2,395 | 6.1 | +2.7 | |
Democratic Labor | 845 | 2.1 | +2.1 | ||
Centre | 248 | 0.6 | +0.6 |
Party | Candidate | Votes | % | ±% | |
---|---|---|---|---|---|
Quota | 4,151 | ||||
Liberal | Rex Townley (elected 1) | 8,903 | 26.8 | +1.7 | |
Liberal | Nigel Abbott (elected 3) | 2,117 | 6.4 | +6.4 | |
Liberal | Robert Mather (elected 5) | 1,742 | 5.2 | +5.2 | |
Liberal | George Brown | 981 | 3.0 | +3.0 | |
Liberal | Horace Strutt (elected 6) | 578 | 1.7 | −0.3 | |
Liberal | Donald Clark | 308 | 0.9 | −2.1 | |
Liberal | Gladys Schott | 281 | 0.8 | +0.8 | |
Labor | Harry McLoughlin (elected 2) | 4,200 | 12.6 | +4.8 | |
Labor | Merv Everett (elected 4) | 3,453 | 10.4 | +10.4 | |
Labor | Ken Austin (elected 7) | 1,632 | 4.9 | +4.9 | |
Labor | Neville Lovell | 1,397 | 4.2 | +4.2 | |
Labor | Mary Cumming | 1,356 | 4.1 | −0.8 | |
Labor | Myron Tripp | 1,209 | 3.6 | +3.6 | |
Labor | Eric Howroyd | 696 | 2.1 | −0.7 | |
Labor | Henry Hope | 680 | 2.0 | +2.0 | |
Group A | Bill Wedd | 1,140 | 3.4 | −6.0 | |
Group A | John Clemente | 653 | 2.0 | +2.0 | |
Independent | Harold Senior | 1,086 | 3.3 | +3.3 | |
Independent | Bill Hodgman | 475 | 1.4 | +1.4 | |
Independent | Stanislaus Ryan | 125 | 0.4 | +0.4 | |
Independent | Charley Aylett | 102 | 0.3 | +0.3 | |
Communist | Max Bound | 92 | 0.3 | −0.1 | |
Total formal votes | 33,206 | 95.5 | +1.9 | ||
Informal votes | 1,579 | 4.5 | −1.9 | ||
Turnout | 34,785 | 94.0 | −0.5 | ||
Party total votes | |||||
Liberal | 14,910 | 44.9 | +5.1 | ||
Labor | 14,623 | 44.0 | +4.5 | ||
Group A | 1,793 | 5.4 | −4.0 | ||
Independent | Harold Senior | 1,086 | 3.3 | +3.3 | |
Independent | Bill Hodgman | 475 | 1.4 | +1.4 | |
Independent | Stanislaus Ryan | 125 | 0.4 | +0.4 | |
Independent | Charley Aylett | 102 | 0.3 | +0.3 | |
Communist | 92 | 0.3 | −0.1 |
Party | Candidate | Votes | % | ±% | |
---|---|---|---|---|---|
Quota | 4,106 | ||||
Liberal | Rex Townley (elected 1) | 8,251 | 25.1 | −3.9 | |
Liberal | Archibald Park (elected 7) | 1,332 | 4.1 | +4.1 | |
Liberal | Bill Hodgman (elected 6) | 1,064 | 3.2 | −0.8 | |
Liberal | Donald Clark | 996 | 3.0 | +3.0 | |
Liberal | Harold Solomon | 765 | 2.3 | +2.3 | |
Liberal | Horace Strutt | 650 | 2.0 | −1.2 | |
Labor | Frank Gaha (elected 3) | 3,033 | 9.2 | +5.5 | |
Labor | Harry McLoughlin (elected 4) | 2,575 | 7.8 | +7.8 | |
Labor | Charley Aylett (elected 5) | 2,451 | 7.5 | +7.5 | |
Labor | Mary Cumming | 1,608 | 4.9 | +4.9 | |
Labor | Bert Lacey | 1,430 | 4.4 | +2.6 | |
Labor | William Wilkinson | 961 | 2.9 | +2.9 | |
Labor | Eric Howroyd | 912 | 2.8 | +1.6 | |
Independent | Bill Wedd (elected 2) | 3,075 | 9.4 | +3.9 | |
Democratic Labor | Harold Senior | 1,133 | 3.4 | +3.4 | |
Democratic Labor | Brian Bresnehan | 725 | 2.2 | +2.2 | |
Democratic Labor | Rex McShane | 380 | 1.2 | +1.2 | |
Independent | Nigel Abbott | 1,356 | 4.1 | +4.1 | |
Communist | Max Bound | 126 | 0.4 | +0.4 | |
Communist | George Chenery | 18 | 0.1 | +0.1 | |
Total formal votes | 32,841 | 93.6 | −2.3 | ||
Informal votes | 2,241 | 6.4 | +2.3 | ||
Turnout | 35,082 | 94.5 | −0.6 | ||
Party total votes | |||||
Liberal | 13,058 | 39.8 | −1.6 | ||
Labor | 12,970 | 39.5 | −9.2 | ||
Independent | Bill Wedd | 3,075 | 9.4 | +3.9 | |
Democratic Labor | 2,238 | 6.8 | +4.2 | ||
Independent | Nigel Abbott | 1,356 | 4.1 | +4.1 | |
Communist | 144 | 0.4 | +0.4 |
Party | Candidate | Votes | % | ±% | |
---|---|---|---|---|---|
Quota | 4,938 | ||||
Labor | Robert Cosgrove (elected 1) | 10,050 | 29.1 | +4.7 | |
Labor | Alfred White (elected 6) | 2,444 | 7.1 | −1.9 | |
Labor | Brian Miller | 2,029 | 5.9 | +5.9 | |
Labor | Frank Gaha (elected 3) | 1,277 | 3.7 | −0.8 | |
Labor | Bert Lacey | 623 | 1.8 | +1.8 | |
Labor | Eric Howroyd | 414 | 1.2 | +1.2 | |
Liberal | Rex Townley (elected 2) | 10,030 | 29.0 | −2.3 | |
Liberal | Bill Hodgman (elected 5) | 1,391 | 4.0 | 0.0 | |
Liberal | Gordon Cashmore | 1,239 | 3.6 | +3.6 | |
Liberal | Horace Strutt (elected 4) | 1,094 | 3.2 | +1.4 | |
Liberal | Alfred Robertson | 362 | 1.0 | +1.0 | |
Liberal | William Stanton | 201 | 0.6 | −0.1 | |
Group D | Bill Wedd | 1,896 | 5.5 | −1.2 | |
Group D | Terry Bower | 460 | 1.3 | +1.3 | |
Labor (A-C) | Jack Bartholomew | 418 | 1.2 | +1.2 | |
Labor (A-C) | Anthony Orpwood | 414 | 1.2 | +1.2 | |
Labor (A-C) | Cyril Marshall | 68 | 0.2 | +0.2 | |
Communist | Max Bound | 91 | 0.3 | +0.3 | |
Independent | William Lloyd | 59 | 0.2 | +0.2 | |
Total formal votes | 34,560 | 95.9 | −0.3 | ||
Informal votes | 1,496 | 4.1 | +0.3 | ||
Turnout | 36,056 | 95.1 | +2.7 | ||
Party total votes | |||||
Labor | 16,837 | 48.7 | −2.1 | ||
Liberal | 14,317 | 41.4 | −1.1 | ||
Group D | 2,356 | 6.8 | +0.1 | ||
Labor (A-C) | 900 | 2.6 | +2.6 | ||
Communist | 91 | 0.3 | +0.3 | ||
Independent | William Lloyd | 59 | 0.2 | +0.2 |
Party | Candidate | Votes | % | ±% | |
---|---|---|---|---|---|
Quota | 3,633 | ||||
Labor | Robert Cosgrove (elected 2) | 6,194 | 24.4 | +1.5 | |
Labor | Alfred White (elected 3) | 2,287 | 9.0 | −0.5 | |
Labor | Terence Bower | 1,920 | 7.6 | +7.6 | |
Labor | Frank Gaha (elected 6) | 1,146 | 4.5 | −4.6 | |
Labor | Ross Maher | 858 | 3.4 | +3.4 | |
Labor | William Hannon | 509 | 2.0 | +2.0 | |
Liberal | Rex Townley (elected 1) | 7,961 | 31.3 | −5.1 | |
Liberal | Bill Hodgman (elected 5) | 1,021 | 4.0 | +4.0 | |
Liberal | Harold Solomon | 687 | 2.7 | +2.7 | |
Liberal | Thomas Lipscombe | 514 | 2.0 | +2.0 | |
Liberal | Horace Strutt (elected 4) | 447 | 1.8 | +0.4 | |
Liberal | William Stanton | 181 | 0.7 | +0.7 | |
Independent | Bill Wedd | 1,699 | 6.7 | −2.1 | |
Total formal votes | 25,424 | 96.2 | +2.5 | ||
Informal votes | 1,008 | 3.8 | −2.5 | ||
Turnout | 26,432 | 92.4 | −0.9 | ||
Party total votes | |||||
Labor | 12,914 | 50.8 | +4.6 | ||
Liberal | 10,811 | 42.5 | −1.6 | ||
Independent | Bill Wedd | 1,699 | 6.7 | −2.1 |
Party | Candidate | Votes | % | ±% | |
---|---|---|---|---|---|
Quota | 3,978 | ||||
Labor | Robert Cosgrove (elected 2) | 6,382 | 22.9 | +2.5 | |
Labor | Alfred White (elected 4) | 2,646 | 9.5 | −1.7 | |
Labor | Frank Gaha (elected 3) | 2,535 | 9.1 | +9.1 | |
Labor | Henry Hope | 558 | 2.0 | −1.8 | |
Labor | William Morgan | 393 | 1.4 | +1.4 | |
Labor | Lloyd Neville | 357 | 1.3 | +1.3 | |
Liberal | Rex Townley (elected 1) | 10,130 | 36.4 | +36.4 | |
Liberal | Campbell Duncan | 557 | 2.0 | −3.1 | |
Liberal | Arthur Hay | 524 | 1.9 | +1.9 | |
Liberal | John Driscoll | 435 | 1.6 | +1.6 | |
Liberal | Horace Strutt (elected 5) | 380 | 1.4 | −4.0 | |
Liberal | Roy Cazaly | 256 | 0.9 | +0.9 | |
Independent | Bill Wedd (elected 6) | 2,437 | 8.8 | −1.4 | |
Independent | Leo McPartlan | 166 | 0.6 | +0.6 | |
Communist | Max Bound | 86 | 0.3 | +0.3 | |
Total formal votes | 27,842 | 93.7 | −1.8 | ||
Informal votes | 1,857 | 6.3 | +1.8 | ||
Turnout | 29,699 | 93.3 | +3.2 | ||
Party total votes | |||||
Labor | 12,871 | 46.2 | +1.7 | ||
Liberal | 12,282 | 44.1 | +23.2 | ||
Independent | 2,603 | 9.3 | −2.8 | ||
Communist | 86 | 0.3 | +0.3 |
Party | Candidate | Votes | % | ±% | |
---|---|---|---|---|---|
Quota | 3,960 | ||||
Labor | Robert Cosgrove (elected 1) | 5,642 | 20.4 | +3.6 | |
Labor | Alfred White (elected 3) | 3,106 | 11.2 | +3.0 | |
Labor | John Nolan | 1,119 | 4.0 | +0.5 | |
Labor | Henry Hope (elected 5) | 1,046 | 3.8 | +3.8 | |
Labor | Albert Bowring | 518 | 1.9 | +1.9 | |
Labor | Timothy Mahoney | 494 | 1.8 | +1.8 | |
Labor | Norman Cooper | 419 | 1.5 | +1.5 | |
Liberal | Horace Strutt (elected 6) | 1,484 | 5.4 | +1.1 | |
Liberal | Campbell Duncan | 1,409 | 5.1 | +5.1 | |
Liberal | John Kennedy | 984 | 3.6 | +3.6 | |
Liberal | Wilfred Osborne | 552 | 2.0 | +2.0 | |
Liberal | Joyce Heathorn | 457 | 1.6 | −1.1 | |
Liberal | Robert Harvey | 391 | 1.4 | −0.8 | |
Liberal | Hubert Lewis | 309 | 1.1 | +1.1 | |
Liberal | Gerald Lyons | 201 | 0.7 | +0.7 | |
Group C | Rex Townley (elected 2) | 5,535 | 20.0 | −12.0 | |
Group C | Edgar Lee | 228 | 0.8 | +0.8 | |
Group A | Bill Wedd (elected 4) | 2,820 | 10.2 | +10.2 | |
Group A | Victor Ratten | 484 | 1.7 | +1.7 | |
Group A | Cyril Hosan | 61 | 0.2 | +0.2 | |
Independent | Thomas Layton | 282 | 1.0 | +1.0 | |
Independent | George Wallis | 175 | 0.6 | +0.6 | |
Total formal votes | 27,716 | 95.5 | +6.5 | ||
Informal votes | 1,304 | 4.5 | −6.5 | ||
Turnout | 29,020 | 90.1 | +0.1 | ||
Party total votes | |||||
Labor | 12,344 | 44.5 | −0.8 | ||
Liberal | 5,787 | 20.9 | +1.5 | ||
Group C | 5,763 | 20.8 | −11.2 | ||
Group A | 3,365 | 12.1 | +12.1 | ||
Independent | Thomas Layton | 282 | 1.0 | +1.0 | |
Independent | George Wallis | 175 | 0.6 | +0.6 |
Party | Candidate | Votes | % | ±% | |
---|---|---|---|---|---|
Quota | 3,684 | ||||
Labor | Robert Cosgrove (elected 2) | 4,337 | 16.8 | −17.5 | |
Labor | Alfred White (elected 5) | 2,113 | 8.2 | −3.0 | |
Labor | Arthur Tyler | 1,591 | 6.2 | +6.2 | |
Labor | Charles Culley (elected 6) | 937 | 3.6 | −4.8 | |
Labor | John Nolan | 896 | 3.5 | +3.5 | |
Labor | Francis Heerey | 835 | 3.2 | −2.0 | |
Labor | Maxwell Hickman | 492 | 1.9 | +1.9 | |
Labor | Sarah Kelly | 466 | 1.8 | −1.1 | |
Independent | Rex Townley (elected 1) | 8,247 | 32.0 | +32.0 | |
Liberal | Horace Strutt (elected 3) | 1,191 | 4.6 | +4.6 | |
Liberal | Charles Atkins (elected 4) | 1,165 | 4.5 | −1.2 | |
Liberal | Arthur Hay | 870 | 3.4 | +3.4 | |
Liberal | Joyce Heathorn | 701 | 2.7 | +2.7 | |
Liberal | Robert Harvey | 580 | 2.2 | −0.3 | |
Liberal | William Morrison | 483 | 1.9 | +1.9 | |
Group Independent | Leo McPartlan | 456 | 1.8 | +1.8 | |
Group Independent | Percival Partington | 224 | 0.9 | +0.9 | |
Independent | William Gittus | 198 | 0.8 | +0.8 | |
Total formal votes | 25,782 | 89.0 | −6.0 | ||
Informal votes | 3,191 | 11.0 | +6.0 | ||
Turnout | 28,973 | 90.0 | −1.2 | ||
Party total votes | |||||
Labor | 11,667 | 45.3 | −22.4 | ||
Independent | Rex Townley | 8,247 | 32.0 | +32.0 | |
Liberal | 4,990 | 19.4 | −11.6 | ||
Group Independent | 680 | 2.6 | +2.6 | ||
Independent | William Gittus | 198 | 0.8 | +0.8 |
Party | Candidate | Votes | % | ±% | |
---|---|---|---|---|---|
Quota | 3,537 | ||||
Labor | Robert Cosgrove (elected 1) | 8,482 | 34.3 | +16.5 | |
Labor | Alfred White (elected 5) | 2,778 | 11.2 | +8.4 | |
Labor | Charles Culley (elected 2) | 2,075 | 8.4 | −2.0 | |
Labor | Edmund Dwyer-Gray (elected 3) | 1,418 | 5.7 | −13.3 | |
Labor | Francis Heerey | 1,285 | 5.2 | −2.7 | |
Labor | Sarah Kelly | 725 | 2.9 | +2.9 | |
Nationalist | John Soundy (elected 4) | 3,033 | 12.2 | +1.2 | |
Nationalist | Charles Atkins (elected 6) | 1,407 | 5.7 | +5.7 | |
Nationalist | Ernest Turner | 1,103 | 4.5 | −0.9 | |
Nationalist | Raymond Smith | 838 | 3.4 | +3.4 | |
Nationalist | Robert Harvey | 614 | 2.5 | +2.5 | |
Nationalist | Dugald McDougall | 567 | 2.3 | +2.3 | |
Nationalist | Albert Kalbfell | 113 | 0.5 | +0.5 | |
Independent | Michael O'Reilly | 316 | 1.3 | +1.3 | |
Total formal votes | 24,754 | 95.0 | −3.0 | ||
Informal votes | 1,294 | 5.0 | +3.0 | ||
Turnout | 26,048 | 91.2 | −2.8 | ||
Party total votes | |||||
Labor | 16,763 | 67.7 | +9.0 | ||
Nationalist | 7,675 | 31.0 | −3.6 | ||
Independent | Michael O'Reilly | 316 | 1.3 | +1.3 |
Party | Candidate | Votes | % | ±% | |
---|---|---|---|---|---|
Quota | 3,469 | ||||
Labor | Edmund Dwyer-Gray (elected 1) | 4,614 | 19.0 | +11.8 | |
Labor | Robert Cosgrove (elected 2) | 4,314 | 17.8 | +1.9 | |
Labor | Charles Culley (elected 3) | 2,514 | 10.4 | −1.2 | |
Labor | Francis Heerey (elected 4) | 1,919 | 7.9 | +7.9 | |
Labor | Alfred White | 686 | 2.8 | +1.1 | |
Labor | John Lattin | 194 | 0.8 | +0.8 | |
Nationalist | John Soundy (elected 5) | 2,660 | 11.0 | −4.1 | |
Nationalist | Arndell Lewis (elected 6) | 2,466 | 10.2 | +6.1 | |
Nationalist | Eric Johnson | 1,444 | 5.9 | −0.8 | |
Nationalist | Ernest Turner | 1,316 | 5.4 | −0.8 | |
Nationalist | D'Arcy Addison | 517 | 2.1 | −2.2 | |
Independent | George Carruthers | 1,007 | 4.1 | −4.6 | |
Independent | George Collis | 554 | 2.3 | +2.3 | |
Independent | Frederick Lambert | 73 | 0.3 | +0.3 | |
Total formal votes | 24,278 | 98.0 | +1.1 | ||
Informal votes | 496 | 2.0 | −1.1 | ||
Turnout | 24,774 | 94.0 | −1.1 | ||
Party total votes | |||||
Labor | 14,241 | 58.7 | −10.0 | ||
Nationalist | 8,403 | 34.6 | −3.2 | ||
Independent | George Carruthers | 1,007 | 4.1 | −4.6 | |
Independent | George Collis | 554 | 2.3 | +2.3 | |
Independent | Frederick Lambert | 73 | 0.3 | +0.3 |
Party | Candidate | Votes | % | ±% | |
---|---|---|---|---|---|
Quota | 3,292 | ||||
Labor | Robert Cosgrove (elected 1) | 3,661 | 15.9 | +9.4 | |
Labor | Charles Culley (elected 3) | 2,665 | 11.6 | +11.6 | |
Labor | Edmund Dwyer-Gray (elected 4) | 1,662 | 7.2 | +0.4 | |
Labor | Gerald Mahoney | 1,661 | 7.2 | −4.1 | |
Labor | Walter Woods | 770 | 3.3 | −0.9 | |
Labor | Edgar Geer | 422 | 1.8 | +1.8 | |
Labor | Alfred White | 381 | 1.7 | +1.7 | |
Nationalist | John Soundy (elected 2) | 3,489 | 15.1 | +10.4 | |
Nationalist | Eric Johnson | 1,534 | 6.7 | +6.7 | |
Nationalist | Ernest Turner (elected 5) | 1,419 | 6.2 | −4.1 | |
Nationalist | D'Arcy Addison | 1,001 | 4.3 | +4.3 | |
Nationalist | Arndell Lewis | 937 | 4.1 | +0.6 | |
Nationalist | Trevor Young | 328 | 1.4 | +1.4 | |
Social Credit | George Carruthers (elected 6) | 1,995 | 8.7 | +8.7 | |
Independent | William Jarvis | 491 | 2.1 | +2.1 | |
Independent Labor | Thomas Jude | 320 | 1.4 | +1.4 | |
Independent | Lesley Murdoch | 192 | 0.8 | +0.8 | |
Independent | Robert Leitch | 111 | 0.5 | +0.5 | |
Total formal votes | 23,039 | 96.9 | +0.3 | ||
Informal votes | 736 | 3.1 | −0.3 | ||
Turnout | 23,775 | 95.1 | −0.2 | ||
Party total votes | |||||
Labor | 11,222 | 48.7 | +8.4 | ||
Nationalist | 8,708 | 37.8 | −15.9 | ||
Social Credit | George Carruthers | 1,995 | 8.7 | +8.7 | |
Independent | William Jarvis | 491 | 2.1 | +2.1 | |
Independent Labor | Thomas Jude | 320 | 1.4 | +1.4 | |
Independent | Lesley Murdoch | 192 | 0.8 | +0.8 | |
Independent | Robert Leitch | 111 | 0.5 | +0.5 |
Party | Candidate | Votes | % | ±% | |
---|---|---|---|---|---|
Quota | 3,102 | ||||
Nationalist | John McPhee (elected 1) | 5,068 | 23.3 | +7.7 | |
Nationalist | Ernest Turner (elected 2) | 2,226 | 10.3 | +10.3 | |
Nationalist | Charles Grant (elected 5) | 1,459 | 6.7 | −2.9 | |
Nationalist | John Soundy (elected 6) | 1,026 | 4.7 | −3.0 | |
Nationalist | Arndell Lewis | 754 | 3.5 | +3.5 | |
Nationalist | George Gilmore | 384 | 1.8 | +1.8 | |
Nationalist | Charles O'Conor | 336 | 1.5 | +1.5 | |
Nationalist | Maurice Susman | 248 | 1.1 | +1.1 | |
Nationalist | Alfred Richardson | 152 | 0.7 | +0.7 | |
Labor | Gerald Mahoney (elected 3) | 2,463 | 11.3 | +11.3 | |
Labor | Edmund Dwyer-Gray (elected 4) | 1,486 | 6.7 | −1.2 | |
Labor | Robert Cosgrove | 1,405 | 6.5 | −0.5 | |
Labor | Arthur Tyler | 1,328 | 6.1 | +6.1 | |
Labor | Walter Woods | 909 | 4.2 | −3.9 | |
Labor | Frederick Bates | 640 | 2.9 | +2.9 | |
Labor | John Cleary | 508 | 2.3 | −0.9 | |
Independent | James Counsel | 585 | 2.7 | +2.7 | |
Independent | Archibald Park | 410 | 1.9 | +1.9 | |
Independent | David Dicker | 322 | 1.5 | +1.5 | |
Total formal votes | 21,709 | 96.6 | −0.7 | ||
Informal votes | 775 | 3.4 | +0.7 | ||
Turnout | 22,484 | 95.3 | +11.7 | ||
Party total votes | |||||
Nationalist | 11,653 | 53.7 | +13.3 | ||
Labor | 8,739 | 40.3 | −0.6 | ||
Independent | James Counsel | 585 | 2.7 | +2.7 | |
Independent | Archibald Park | 410 | 1.9 | +1.9 | |
Independent | David Dicker | 322 | 1.5 | +1.5 |
Party | Candidate | Votes | % | ±% | |
---|---|---|---|---|---|
Quota | 2,634 | ||||
Labor | Walter Woods (elected 4) | 1,493 | 8.1 | −0.8 | |
Labor | Edmund Dwyer-Gray (elected 6) | 1,461 | 7.9 | +7.9 | |
Labor | Robert Cosgrove (elected 5) | 1,285 | 7.0 | −2.7 | |
Labor | John Brown | 977 | 5.3 | +5.3 | |
Labor | Charles Culley | 939 | 5.1 | −5.9 | |
Labor | John Cleary | 595 | 3.2 | −4.1 | |
Labor | William Lloyd | 502 | 2.7 | +2.7 | |
Labor | George Phillips | 293 | 1.6 | +1.6 | |
Nationalist | John McPhee (elected 1) | 2,872 | 15.6 | +7.0 | |
Nationalist | Charles Grant (elected 2) | 1,774 | 9.6 | +0.5 | |
Nationalist | John Soundy (elected 3) | 1,423 | 7.7 | −4.2 | |
Nationalist | Horace Walch | 1,258 | 6.8 | +6.8 | |
Nationalist | George Davis | 121 | 0.7 | +0.7 | |
Independent Labor | Gerald Mahoney | 1,982 | 10.8 | +3.1 | |
Independent | William McHugo | 1,057 | 5.7 | +5.7 | |
Independent | Richard Stamford | 223 | 1.2 | +1.2 | |
Independent | John Graham | 176 | 1.0 | +1.0 | |
Total formal votes | 18,431 | 97.3 | −0.6 | ||
Informal votes | 519 | 2.7 | +0.6 | ||
Turnout | 18,950 | 83.6 | +14.6 | ||
Party total votes | |||||
Labor | 7,545 | 40.9 | −8.5 | ||
Nationalist | 7,448 | 40.4 | −0.3 | ||
Independent Labor | Gerald Mahoney | 1,982 | 10.8 | +3.1 | |
Independent | William McHugo | 1,057 | 5.7 | +5.7 | |
Independent | Richard Stamford | 223 | 1.2 | +1.2 | |
Independent | John Graham | 176 | 1.0 | +1.0 |
Party | Candidate | Votes | % | ±% | |
---|---|---|---|---|---|
Quota | 2,381 | ||||
Labor | Charles Culley (elected 2) | 1,835 | 11.0 | +2.0 | |
Labor | Robert Cosgrove (elected 3) | 1,612 | 9.7 | +2.1 | |
Labor | Walter Woods (elected 4) | 1,490 | 8.9 | +8.9 | |
Labor | John Cleary (elected 6) | 1,208 | 7.3 | −6.4 | |
Labor | Enid Lyons | 998 | 6.0 | +6.0 | |
Labor | Eric Ogilvie | 922 | 5.5 | +5.5 | |
Labor | Charles Metz | 167 | 1.0 | +1.0 | |
Nationalist | John Soundy (elected 1) | 1,989 | 11.9 | +11.9 | |
Nationalist | Charles Grant | 1,524 | 9.1 | +0.3 | |
Nationalist | John McPhee (elected 5) | 1,436 | 8.6 | −5.4 | |
Nationalist | Leslie Payne | 994 | 6.0 | +3.3 | |
Nationalist | Frederick Wilson | 276 | 1.7 | +1.7 | |
Nationalist | William Jarvis | 258 | 1.5 | +1.5 | |
Nationalist | William Hammond | 205 | 1.2 | +1.2 | |
Independent Labor | Gerald Mahoney | 1,285 | 7.7 | +7.7 | |
Independent | Edith Waterworth | 462 | 2.8 | −3.7 | |
Total formal votes | 16,661 | 97.9 | +0.5 | ||
Informal votes | 360 | 2.1 | −0.5 | ||
Turnout | 17,021 | 69.0 | +2.8 | ||
Party total votes | |||||
Labor | 8,232 | 49.4 | +9.7 | ||
Nationalist | 6,682 | 40.1 | −12.3 | ||
Independent Labor | Gerald Mahoney | 1,285 | 7.7 | +7.7 | |
Independent | Edith Waterworth | 462 | 2.8 | −3.7 |
Party | Candidate | Votes | % | ±% | |
---|---|---|---|---|---|
Quota | 2,625 | ||||
Nationalist | John McPhee (elected 1) | 2,568 | 14.0 | +0.7 | |
Nationalist | Charles Grant (elected 5) | 1,729 | 9.4 | +9.4 | |
Nationalist | Robert Snowden (elected 4) | 1,368 | 7.4 | +1.2 | |
Nationalist | William Mulcahy | 1,229 | 6.7 | +6.7 | |
Nationalist | John Turner | 1,172 | 6.4 | +6.4 | |
Nationalist | Leslie Payne | 496 | 2.7 | +2.7 | |
Nationalist | Eric Stopp | 372 | 2.0 | +2.0 | |
Nationalist | Albert Richardson | 266 | 1.4 | +1.4 | |
Nationalist | Edward James | 199 | 1.1 | +1.1 | |
Nationalist | Francist Foster | 188 | 1.0 | +1.0 | |
Nationalist | Joseph Hatch | 32 | 0.2 | +0.2 | |
Labor | John Cleary (elected 2) | 2,510 | 13.7 | −7.8 | |
Labor | Charles Culley (elected 3) | 1,659 | 9.0 | +9.0 | |
Labor | William Sheridan (elected 6) | 1,474 | 8.0 | +1.8 | |
Labor | Robert Cosgrove | 1,388 | 7.6 | +2.7 | |
Labor | Will Reece | 266 | 1.4 | +1.4 | |
Independent | Edith Waterworth | 1,187 | 6.5 | +6.5 | |
Independent | Alicia O'Shea Petersen | 105 | 0.6 | +0.6 | |
Independent | William Lloyd | 84 | 0.5 | +0.5 | |
Independent | William Michael | 77 | 0.4 | +0.4 | |
Total formal votes | 18,369 | 97.4 | +0.4 | ||
Informal votes | 487 | 2.6 | −0.4 | ||
Turnout | 18,856 | 66.2 | +4.0 | ||
Party total votes | |||||
Nationalist | 9,619 | 52.4 | −3.3 | ||
Labor | 7,297 | 39.7 | −4.6 | ||
Independent | Edith Waterworth | 1,187 | 6.5 | +6.5 | |
Independent | Alicia O'Shea Petersen | 105 | 0.6 | +0.6 | |
Independent | William Lloyd | 84 | 0.5 | +0.5 | |
Independent | William Michael | 77 | 0.4 | +0.4 |
Party | Candidate | Votes | % | ±% | |
---|---|---|---|---|---|
Quota | 2,491 | ||||
Nationalist | Elliot Lewis (elected 2) | 2,564 | 14.7 | −1.2 | |
Nationalist | John McPhee (elected 3) | 2,316 | 13.3 | +2.7 | |
Nationalist | Duncan McRae | 1,225 | 7.0 | +7.0 | |
Nationalist | George Foster | 1,151 | 6.6 | +6.6 | |
Nationalist | Robert Snowden (elected 6) | 1,086 | 6.2 | +6.2 | |
Nationalist | Charles Hoggins | 937 | 5.4 | +5.4 | |
Nationalist | William Bottrill | 424 | 2.4 | +2.4 | |
Labor | John Cleary (elected 1) | 3,751 | 21.5 | +7.0 | |
Labor | William Sheridan (elected 4) | 1,085 | 6.2 | −13.4 | |
Labor | Robert Cosgrove (elected 5) | 846 | 4.9 | +0.3 | |
Labor | Walter Woods | 809 | 4.6 | −8.3 | |
Labor | Abraham Needham | 801 | 4.6 | +4.6 | |
Labor | John Lewis | 439 | 2.5 | −3.0 | |
Total formal votes | 17,434 | 97.0 | +2.6 | ||
Informal votes | 543 | 3.0 | −2.6 | ||
Turnout | 17,977 | 70.2 | −4.7 | ||
Party total votes | |||||
Nationalist | 9,703 | 55.7 | +5.3 | ||
Labor | 7,731 | 44.3 | −5.3 |
Party | Candidate | Votes | % | ±% | |
---|---|---|---|---|---|
Quota | 2,428 | ||||
Liberal | Elliott Lewis (elected 2) | 2,709 | 15.9 | +0.5 | |
Liberal | William Burgess (elected 4) | 2,258 | 13.3 | +13.3 | |
Liberal | William Fullerton (elected 6) | 1,805 | 10.6 | +1.7 | |
Liberal | John McPhee | 1,793 | 10.6 | +10.6 | |
Labor | William Sheridan (elected 1) | 3,327 | 19.6 | +12.7 | |
Labor | Walter Woods (elected 3) | 2,190 | 12.9 | +3.5 | |
Labor | John Cleary (elected 5) | 1,194 | 7.0 | +7.0 | |
Labor | John Lewis | 935 | 5.5 | +5.5 | |
Labor | Robert Cosgrove | 784 | 4.6 | +4.6 | |
Total formal votes | 16,995 | 94.4 | −2.4 | ||
Informal votes | 1,014 | 5.6 | +2.4 | ||
Turnout | 18,009 | 74.9 | +6.1 | ||
Party total votes | |||||
Liberal | 8,565 | 50.4 | −1.6 | ||
Labor | 8,430 | 49.6 | +1.6 |
Party | Candidate | Votes | % | ±% | |
---|---|---|---|---|---|
Quota | 2,122 | ||||
Liberal | Elliott Lewis (elected 1) | 2,292 | 15.4 | −1.5 | |
Liberal | Sir John Davies (elected 2) | 1,902 | 12.8 | +4.2 | |
Liberal | William Fullerton (elected 4) | 1,321 | 8.9 | +8.9 | |
Liberal | Francis Valentine | 1,011 | 6.8 | +0.3 | |
Liberal | Frederick Rattle | 620 | 4.2 | +1.0 | |
Liberal | William Bottrill | 369 | 2.5 | +2.5 | |
Liberal | John Paterson | 202 | 1.4 | +1.4 | |
Labor | Lyndhurst Giblin (elected 3) | 1,760 | 11.9 | +11.9 | |
Labor | Walter Woods (elected 5) | 1,393 | 9.4 | −6.3 | |
Labor | Vincent Barker (elected 6) | 1,294 | 8.7 | +1.7 | |
Labor | William Sheridan | 1,027 | 6.9 | −5.8 | |
Labor | Henry Edmonds | 764 | 5.1 | −1.4 | |
Labor | Newham Waterworth | 502 | 3.4 | −0.5 | |
Labor | Edward O'Brien | 392 | 2.6 | +2.6 | |
Total formal votes | 14,849 | 96.8 | −0.5 | ||
Informal votes | 491 | 3.2 | +0.5 | ||
Turnout | 15,340 | 68.8 | −8.6 | ||
Party total votes | |||||
Liberal | 7,717 | 52.0 | +0.9 | ||
Labor | 7,132 | 48.0 | −0.9 |
The Division of Braddon is an Australian electoral division in the state of Tasmania. The current MP is Gavin Pearce of the Liberal Party, who was elected at the 2019 federal election.
Donald Norman Cameron was an Australian politician. He served in the House of Representatives and Tasmanian House of Assembly.
The 1998 Tasmanian state election was held on Saturday, 29 August 1998 in the Australian state of Tasmania to elect 25 members of the Tasmanian House of Assembly. The number of members was reduced from 35 to 25. The election used the Hare-Clark proportional representation system—five members were elected from each of five electorates. The quota required for election increased from 12.5% to 16.7%.
Graeme Lindsay Sturges is an Australian politician. He was a Labor Party member of the Tasmanian House of Assembly from 2002 to 2010 and 2011 to 2014, representing the Hobart-based electorate of Denison. He was elected twice before losing his seat in 2010, regained it in a countback following the resignation of David Bartlett in 2011, and retired at the 2014 election. He was the state Minister for Infrastructure from 2008 until 2010.
Sydney-Denison was an electoral district of the Legislative Assembly in the Australian state of New South Wales, created in 1894 from part of the electoral district of West Sydney in the Ultimo area and named after Governor Denison.
The 1946 Tasmanian state election was held on 23 November 1946 in the Australian state of Tasmania to elect 30 members of the Tasmanian House of Assembly. The election used the Hare-Clark proportional representation system — six members were elected from each of five electorates.
The 1950 Tasmanian state election was held on 6 May 1950 in the Australian state of Tasmania to elect 30 members of the Tasmanian House of Assembly. The election used the Hare-Clark proportional representation system — six members were elected from each of five electorates.
The 2014 Tasmanian state election was held on 15 March 2014 to elect all 25 members to the House of Assembly. The 16-year incumbent Labor government, led by the Premier of Tasmania Lara Giddings, sought to win a fifth consecutive term in government, but was defeated by the Liberal opposition, led by Opposition Leader Will Hodgman, in a landslide victory. Also contesting the election was the Greens led by Nick McKim. The Palmer United Party made a significant effort in the election.
This is a list of electoral division results for the Australian 2010 federal election in the state of Tasmania.
This is a list of House of Assembly results for the 2010 Tasmanian election.
This is a list of House of Assembly results for the 2006 Tasmanian election.
Periodic elections for the Tasmanian Legislative Council were held on 1 May 2010. The two seats up for election were Apsley, held by independent MLC Tania Rattray, and Elwick, held by retiring Labor-turned-independent MLC Terry Martin. These seats were last contested in 2004.
This is a list of House of Assembly results for the 2014 Tasmanian election.
This is a list of House of Assembly results for the 2018 Tasmanian election.
The Division of Clark is an Australian Electoral Division in the state of Tasmania, first contested at the 2019 federal election.
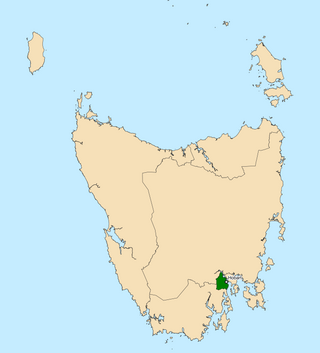
The electoral division of Clark is one of the five electorates in the Tasmanian House of Assembly, it is located in Hobart on the western shore of the River Derwent and includes the suburbs below Mount Wellington. Clark is named after Andrew Inglis Clark, a Tasmanian jurist who was the principal author of the Australian Constitution. The electorate shares its name and boundaries with the federal division of Clark.
Sydney-Denison, an electoral district of the Legislative Assembly in the Australian state of New South Wales, was created in 1894 and abolished in 1904.
This is a list of House of Assembly results for the 1913 Tasmanian election.
Kristie Joy Johnston is an Australian politician. She was elected as the Mayor of City of Glenorchy in 2014 and 2018 and is an Independent member for the seat of Division of Clark, having been elected in the 2021 Tasmanian state election.
This is a list of electoral results for the division of Clark and Denison in Tasmanian elections since 1972.