This is a list of electoral results for the division of Clark and Denison in Tasmanian elections since 1972.
Party | Candidate | Votes | % | ±% | |
---|---|---|---|---|---|
Quota | 7,951 | ||||
Labor | Ella Haddad (elected 1) | 6,944 | 10.9 | −1.6 | |
Labor | Josh Willie (elected 3) | 5,670 | 8.9 | +8.9 | |
Labor | Stuart Benson | 1,929 | 3.0 | +3.0 | |
Labor | John Kamara | 1,689 | 2.7 | +2.7 | |
Labor | Rebecca Prince | 1,441 | 2.3 | +2.3 | |
Labor | Simon Davis | 852 | 1.3 | −1.8 | |
Labor | Susan Wallace | 850 | 1.3 | +1.3 | |
Liberal | Simon Behrakis (elected 6) | 5,168 | 8.1 | +2.3 | |
Liberal | Madeleine Ogilvie (elected 7) | 4,623 | 7.3 | +1.0 | |
Liberal | Marcus Vermey | 3,513 | 5.5 | +5.5 | |
Liberal | Jon Gourlay | 1,434 | 2.3 | +2.3 | |
Liberal | Mohammad Aldergham | 878 | 1.4 | +1.4 | |
Liberal | Catherine Searle | 828 | 1.3 | +1.3 | |
Liberal | Emma Atterbury | 800 | 1.3 | +1.3 | |
Greens | Vica Bayley (elected 2) | 6,313 | 9.9 | +7.8 | |
Greens | Helen Burnet (elected 5) | 3,422 | 5.4 | +5.4 | |
Greens | Janet Shelley | 1,076 | 1.7 | +1.7 | |
Greens | Peter Jones | 821 | 1.3 | +1.3 | |
Greens | Nathan Volf | 629 | 1.0 | +0.3 | |
Greens | Trenton Hoare | 545 | 0.9 | +0.9 | |
Greens | James Zalotockyj | 459 | 0.7 | +0.7 | |
Independent | Kristie Johnston (elected 4) | 4,925 | 7.7 | −3.2 | |
Independent | Sue Hickey | 3,117 | 4.9 | −4.9 | |
Independent | Ben Lohberger | 1,702 | 2.7 | +2.7 | |
Independent | Louise Elliot | 1,160 | 1.8 | +1.8 | |
Animal Justice | Casey Davies | 1,088 | 1.7 | +1.7 | |
Shooters, Fishers, Farmers | Adrian Pickin | 521 | 0.8 | +0.8 | |
Shooters, Fishers, Farmers | Lorraine Bennett | 408 | 0.6 | +0.2 | |
Local Network | David Nunn | 147 | 0.2 | +0.2 | |
Local Network | Frank Formby | 129 | 0.2 | +0.2 | |
Local Network | Sam Campbell | 112 | 0.2 | +0.2 | |
Local Network | Ranae Zollner | 88 | 0.1 | +0.1 | |
Independent | Stefan Vogel | 162 | 0.3 | +0.3 | |
Independent | Angela Triffitt | 90 | 0.1 | +0.1 | |
Independent | John Michael Forster | 70 | 0.1 | +0.1 | |
Total formal votes | 63,603 | 94.6 | −0.4 | ||
Informal votes | 3,655 | 5.4 | +0.4 | ||
Turnout | 67,258 | 90.6 | −0.1 | ||
Party total votes | |||||
Labor | 19,375 | 30.5 | +8.4 | ||
Liberal | 17,244 | 27.1 | −4.7 | ||
Greens | 13,265 | 20.9 | +0.8 | ||
Independent | Kristie Johnston | 4,925 | 7.7 | −3.2 | |
Independent | Sue Hickey | 3,117 | 4.9 | −4.9 | |
Independent | Ben Lohberger | 1,702 | 2.7 | +2.7 | |
Independent | Louise Elliot | 1,160 | 1.8 | +1.8 | |
Animal Justice | 1,088 | 1.7 | +1.7 | ||
Shooters, Fishers, Farmers | 929 | 1.5 | +0.1 | ||
Local Network | 476 | 0.7 | +0.7 | ||
Independent | Stefan Vogel | 162 | 0.3 | +0.3 | |
Independent | Angela Triffitt | 90 | 0.1 | +0.1 | |
Independent | John Michael Forster | 70 | 0.1 | +0.1 |
Party | Candidate | Votes | % | ±% | |
---|---|---|---|---|---|
Quota | 10,626 | ||||
Liberal | Elise Archer (elected 2) | 9,402 | 14.7 | −1.6 | |
Liberal | Madeleine Ogilvie (elected 4) | 3,992 | 6.3 | +6.3 | |
Liberal | Simon Behrakis | 3,722 | 5.8 | +2.3 | |
Liberal | Will Coats | 1,690 | 2.7 | +2.7 | |
Liberal | Harvey Lennon | 1,488 | 2.3 | +2.3 | |
Labor | Ella Haddad (elected 3) | 7,998 | 12.5 | +4.4 | |
Labor | Simon Davis | 1,986 | 3.1 | +3.1 | |
Labor | Chris Clark | 1,597 | 2.5 | +2.5 | |
Labor | Sam Mitchell | 1,294 | 2.0 | +2.0 | |
Labor | Deb Carnes | 1,191 | 1.9 | +1.9 | |
Greens | Cassy O'Connor (elected 1) | 9,469 | 14.9 | +2.4 | |
Greens | Vica Bayley | 1,372 | 2.2 | +2.2 | |
Greens | Bec Taylor | 943 | 1.5 | +1.5 | |
Greens | Tim Smith | 546 | 0.9 | +0.9 | |
Greens | Nathan Volf | 442 | 0.7 | +0.7 | |
Independent | Kristie Johnston (elected 5) | 6,994 | 11.0 | +11.0 | |
Independent | Sue Hickey | 6,261 | 9.8 | +9.8 | |
Animal Justice | Tim Westcott | 902 | 1.4 | +1.4 | |
Shooters, Fishers, Farmers | Andrew Large | 588 | 0.9 | +0.9 | |
Shooters, Fishers, Farmers | Lorraine Bennett | 310 | 0.5 | +0.5 | |
Independent | Mike Dutta | 615 | 1.0 | +1.0 | |
Independent | Jax Ewin | 537 | 0.8 | +0.8 | |
Independent | Lisa Gershwin | 260 | 0.4 | +0.4 | |
Federation | Justin Stringer | 154 | 0.2 | +0.2 | |
Total formal votes | 63,753 | 95.0 | −0.9 | ||
Informal votes | 3,378 | 5.0 | +0.9 | ||
Turnout | 67,131 | 90.7 | −0.7 | ||
Party total votes | |||||
Liberal | 20,294 | 31.8 | −5.9 | ||
Labor | 14,066 | 22.1 | −19.8 | ||
Greens | 12,772 | 20.0 | +2.5 | ||
Independent | Kristie Johnston | 6,994 | 11.0 | +11.0 | |
Independent | Sue Hickey | 6,261 | 9.8 | +9.8 | |
Animal Justice | 902 | 1.4 | +1.4 | ||
Shooters, Fishers, Farmers | 898 | 1.4 | +1.4 | ||
Independent | Mike Dutta | 615 | 1.0 | +1.0 | |
Independent | Jax Ewin | 537 | 0.8 | +0.8 | |
Independent | Lisa Gershwin | 260 | 0.4 | +0.4 | |
Federation | 154 | 0.2 | +0.2 | ||
Liberal hold | Swing | –1.6 | |||
Liberal hold | Swing | +6.3 | |||
Labor hold | Swing | +4.4 | |||
Greens hold | Swing | +2.4 | |||
Independent gain from Labor | Swing | +11.0 |
Party | Candidate | Votes | % | ±% | |
---|---|---|---|---|---|
Quota | 10,866 | ||||
Labor | Scott Bacon (elected 1) | 11,798 | 18.1 | −4.5 | |
Labor | Ella Haddad (elected 5) | 5,288 | 8.1 | +8.1 | |
Labor | Madeleine Ogilvie | 4,340 | 6.7 | +3.3 | |
Labor | Tim Cox | 3,860 | 5.9 | +5.9 | |
Labor | Zelinda Sherlock | 1,998 | 3.1 | +3.1 | |
Liberal | Elise Archer (elected 2) | 10,627 | 16.3 | +5.8 | |
Liberal | Sue Hickey (elected 4) | 7,142 | 11.0 | +11.0 | |
Liberal | Kristy Johnson | 3,234 | 5.0 | +5.0 | |
Liberal | Simon Behrakis | 2,317 | 3.6 | +3.6 | |
Liberal | Dean Young | 1,260 | 1.9 | +1.9 | |
Greens | Cassy O'Connor (elected 3) | 8,095 | 12.4 | −2.7 | |
Greens | Helen Burnet | 1,532 | 2.4 | +2.4 | |
Greens | Mel Fitzpatrick | 733 | 1.1 | +1.1 | |
Greens | Rose Kokkoris | 603 | 0.9 | +0.9 | |
Greens | Aaron Benham | 465 | 0.7 | +0.7 | |
Shooters, Fishers, Farmers | Lorraine Bennett | 1,190 | 1.8 | +1.8 | |
Tasmanians 4 Tasmania | Rob Newitt | 362 | 0.6 | +0.6 | |
Tasmanians 4 Tasmania | Alan Barnett | 347 | 0.5 | +0.5 | |
Total formal votes | 65,191 | 95.8 | +0.6 | ||
Informal votes | 2,835 | 4.2 | −0.6 | ||
Turnout | 68,026 | 91.4 | −1.3 | ||
Party total votes | |||||
Labor | 27,284 | 41.9 | +8.1 | ||
Liberal | 24,580 | 37.7 | −0.6 | ||
Greens | 11,428 | 17.5 | −3.7 | ||
Shooters, Fishers, Farmers | 1,190 | 1.8 | +1.8 | ||
Tasmanians 4 Tasmania | 709 | 1.1 | +1.1 | ||
Labor hold | Swing | –4.5 | |||
Labor hold | Swing | +8.1 | |||
Liberal hold | Swing | +5.8 | |||
Liberal hold | Swing | +11.0 | |||
Greens hold | Swing | –2.7 |
Party | Candidate | Votes | % | ±% | |
---|---|---|---|---|---|
Quota | 10,660 | ||||
Liberal | Matthew Groom (elected 2) | 13,829 | 21.6 | +6.5 | |
Liberal | Elise Archer (elected 4) | 6,701 | 10.5 | +5.8 | |
Liberal | Robert Mallett | 2,080 | 3.3 | +3.3 | |
Liberal | Deborah De Williams | 1,052 | 1.6 | +1.6 | |
Liberal | René Kling | 823 | 1.3 | +1.3 | |
Labor | Scott Bacon (elected 1) | 14,469 | 22.6 | +11.1 | |
Labor | Madeleine Ogilvie (elected 5) | 2,156 | 3.4 | +2.4 | |
Labor | Julian Amos | 1,917 | 3.0 | +3.0 | |
Labor | Alphonse Mulumba | 1,587 | 2.5 | +2.5 | |
Labor | Sharon Carnes | 1,482 | 2.3 | +2.3 | |
Greens | Cassy O'Connor (elected 3) | 9,694 | 15.2 | −1.0 | |
Greens | Bill Harvey | 1,614 | 2.5 | +2.5 | |
Greens | Penelope Ann | 934 | 1.5 | +0.2 | |
Greens | Philip Cocker | 695 | 1.1 | +1.1 | |
Greens | Alan Whykes | 615 | 1.0 | +1.0 | |
Palmer United | Barbara Etter | 737 | 1.2 | +1.2 | |
Palmer United | Rob Newitt | 369 | 0.6 | +0.6 | |
Palmer United | Justin Stringer | 357 | 0.6 | +0.6 | |
Palmer United | Charles Forrest | 303 | 0.5 | +0.5 | |
Palmer United | Mark Grube | 254 | 0.4 | +0.4 | |
Independent | Marti Zucco | 788 | 1.2 | +1.2 | |
Independent | Hans Willink | 413 | 0.6 | +0.6 | |
Socialist Alliance | Shaine Stephen | 300 | 0.5 | +0.5 | |
Independent | Leo Foley | 207 | 0.3 | +0.3 | |
National | Vlad Gala | 75 | 0.1 | +0.1 | |
National | Julian Edwards | 61 | 0.1 | +0.1 | |
National | Domenic Allocca | 48 | 0.1 | +0.1 | |
Independent | Freddy Hill | 152 | 0.2 | +0.2 | |
Independent | Lucas Noyes | 130 | 0.2 | +0.2 | |
Independent | Michael Swanton | 114 | 0.2 | +0.2 | |
Total formal votes | 63,956 | 95.2 | −1.0 | ||
Informal votes | 3,218 | 4.8 | +1.0 | ||
Turnout | 67,174 | 92.7 | −0.3 | ||
Party total votes | |||||
Liberal | 24,485 | 38.3 | +8.5 | ||
Labor | 21,611 | 33.8 | −2.5 | ||
Greens | 13,552 | 21.2 | −3.7 | ||
Palmer United | 2,020 | 3.2 | +3.2 | ||
Independent | Marti Zucco | 788 | 1.2 | +1.2 | |
Independent | Hans Willink | 413 | 0.6 | +0.6 | |
Socialist Alliance | 300 | 0.5 | −0.1 | ||
Independent | Leo Foley | 207 | 0.3 | +0.3 | |
National | 184 | 0.3 | +0.3 | ||
Independent | Freddy Hill | 152 | 0.2 | +0.2 | |
Independent | Lucas Noyes | 130 | 0.2 | +0.2 | |
Independent | Michael Swanton | 114 | 0.2 | +0.2 | |
Liberal hold | Swing | +6.5 | |||
Liberal hold | Swing | +5.8 | |||
Labor hold | Swing | +11.1 | |||
Labor hold | Swing | +2.4 | |||
Greens hold | Swing | –1.0 |
Party | Candidate | Votes | % | ±% | |
---|---|---|---|---|---|
Quota | 10,630 | ||||
Labor | David Bartlett (elected 2) | 10,169 | 15.9 | +2.9 | |
Labor | Scott Bacon (elected 4) | 7,356 | 11.5 | +11.5 | |
Labor | Lisa Singh | 3,833 | 6.0 | −3.4 | |
Labor | Graeme Sturges | 1,185 | 1.9 | −7.7 | |
Labor | Madeleine Ogilvie | 608 | 1.0 | +1.0 | |
Liberal | Matthew Groom (elected 3) | 9,602 | 15.1 | +15.1 | |
Liberal | Richard Lowrie | 3,138 | 4.9 | +1.3 | |
Liberal | Elise Archer (elected 5) | 2,999 | 4.7 | +1.5 | |
Liberal | Matt Stevenson | 1,834 | 2.9 | +2.9 | |
Liberal | Jenny Branch | 1,428 | 2.2 | +2.2 | |
Greens | Cassy O'Connor (elected 1) | 10,336 | 16.2 | +12.3 | |
Greens | Helen Burnet | 3,142 | 4.9 | +4.9 | |
Greens | Peter Cover | 875 | 1.4 | +1.4 | |
Greens | Penelope Ann | 811 | 1.3 | +1.3 | |
Greens | Kartika Franks | 713 | 1.1 | +1.1 | |
Independent | Andrew Wilkie | 5,382 | 8.4 | +8.4 | |
Socialist Alliance | Melanie Barnes | 365 | 0.6 | +0.6 | |
Total formal votes | 63,776 | 96.2 | +0.5 | ||
Informal votes | 2,541 | 3.8 | −0.5 | ||
Turnout | 66,317 | 93.0 | +0.7 | ||
Party total votes | |||||
Labor | 23,151 | 36.3 | −10.5 | ||
Liberal | 19,001 | 29.8 | +3.1 | ||
Greens | 15,877 | 24.9 | +0.8 | ||
Independent | Andrew Wilkie | 5,382 | 8.4 | +8.4 | |
Socialist Alliance | 365 | 0.6 | +0.2 |
Party | Candidate | Votes | % | ±% | |
---|---|---|---|---|---|
Quota | 10,257 | ||||
Labor | David Bartlett (elected 3) | 7,982 | 13.0 | +8.7 | |
Labor | Graeme Sturges (elected 5) | 5,922 | 9.6 | +4.9 | |
Labor | Lisa Singh (elected 4) | 5,760 | 9.4 | +9.4 | |
Labor | Louise Sullivan | 4,067 | 6.6 | +6.6 | |
Labor | Julie Collins | 3,703 | 6.0 | +6.0 | |
Labor | Joe Ritchie | 1,449 | 2.4 | +2.4 | |
Liberal | Michael Hodgman (elected 2) | 7,436 | 12.1 | +5.1 | |
Liberal | Fabian Dixon | 3,596 | 5.8 | +5.8 | |
Liberal | Richard Lowrie | 2,239 | 3.6 | +3.6 | |
Liberal | Elise Archer | 1,939 | 3.2 | +3.2 | |
Liberal | John Klonaris | 1,130 | 1.8 | +1.8 | |
Greens | Peg Putt (elected 1) | 11,338 | 18.4 | −1.6 | |
Greens | Cassy O'Connor | 2,426 | 3.9 | +3.9 | |
Greens | Marrette Corby | 371 | 0.6 | +0.6 | |
Greens | Bill Harvey | 364 | 0.6 | +0.6 | |
Greens | Toby Rowallan | 313 | 0.5 | +0.5 | |
Group F | Michael Fracalossi | 309 | 0.5 | +0.5 | |
Group F | Paul Glover | 89 | 0.1 | +0.1 | |
Group F | Ken Higgs | 43 | 0.1 | +0.1 | |
Tasmania First | Kevin Pelham | 190 | 0.3 | +0.3 | |
Tasmania First | Eric Zeppenfeld | 135 | 0.2 | +0.2 | |
Independent | Leo Foley | 271 | 0.4 | +0.4 | |
Socialist Alliance | Linda Seaborn | 237 | 0.4 | +0.4 | |
Independent | Hugh Miller | 229 | 0.4 | +0.4 | |
Total formal votes | 61,538 | 95.7 | 0.0 | ||
Informal votes | 2,747 | 4.3 | 0.0 | ||
Turnout | 64,285 | 94.2 | +1.6 | ||
Party total votes | |||||
Labor | 28,883 | 47.0 | −3.9 | ||
Liberal | 16,340 | 26.5 | +3.6 | ||
Greens | 14,812 | 24.0 | −0.4 | ||
Group F | 441 | 0.7 | +0.7 | ||
Tasmania First | 325 | 0.5 | +0.5 | ||
Independent | Leo Foley | 271 | 0.4 | +0.4 | |
Socialist Alliance | 237 | 0.4 | +0.4 | ||
Independent | Hugh Miller | 229 | 0.4 | +0.4 |
Party | Candidate | Votes | % | ±% | |
---|---|---|---|---|---|
Quota | 10,040 | ||||
Labor | Jim Bacon (elected 1) | 21,391 | 35.5 | +3.7 | |
Labor | Graeme Sturges (elected 5) | 2,849 | 4.7 | +4.7 | |
Labor | David Bartlett | 2,554 | 4.2 | +4.2 | |
Labor | James Crotty | 2,281 | 3.8 | +3.8 | |
Labor | Judy Jackson (elected 4) | 1,551 | 2.6 | −2.4 | |
Greens | Peg Putt (elected 2) | 12,036 | 20.0 | +9.5 | |
Greens | Jo Hall | 720 | 1.2 | +1.2 | |
Greens | Mat Hines | 710 | 1.2 | +1.2 | |
Greens | Tim Graham | 651 | 1.1 | +1.1 | |
Greens | Cath Hughes | 643 | 1.1 | +1.1 | |
Liberal | Bob Cheek | 4,622 | 7.7 | −5.2 | |
Liberal | Michael Hodgman (elected 3) | 4,205 | 7.0 | 0.0 | |
Liberal | Jan Kuplis | 1,925 | 3.2 | +3.2 | |
Liberal | Steve Mav | 1,863 | 3.1 | +3.1 | |
Liberal | Tony Steven | 811 | 1.3 | +1.3 | |
Liberal | Matt Woolnough | 396 | 0.7 | +0.7 | |
Group E | Frank Nicklason | 462 | 0.8 | +0.8 | |
Group E | Steve Poulton | 143 | 0.2 | +0.2 | |
Socialist Alliance | Alex Bainbridge | 224 | 0.4 | +0.4 | |
Socialist Alliance | Shua Garfield | 178 | 0.3 | +0.3 | |
Total formal votes | 60,235 | 95.7 | −0.6 | ||
Informal votes | 2,724 | 4.3 | +0.6 | ||
Turnout | 62,959 | 92.6 | −1.2 | ||
Party total votes | |||||
Labor | 30,626 | 50.8 | +4.5 | ||
Greens | 14,760 | 24.5 | +11.4 | ||
Liberal | 13,822 | 22.9 | −13.3 | ||
Group E | 605 | 1.0 | +1.0 | ||
Socialist Alliance | 422 | 0.7 | +0.7 |
Party | Candidate | Votes | % | ±% | |
---|---|---|---|---|---|
Quota | 9,899 | ||||
Labor | Jim Bacon (elected 1) | 18,901 | 31.8 | +17.1 | |
Labor | Judy Jackson (elected 2) | 2,968 | 5.0 | −1.5 | |
Labor | Gwynn Mac Carrick | 1,854 | 3.1 | +3.1 | |
Labor | Andy Bennett | 1,281 | 2.2 | +2.2 | |
Labor | Stuart Slade | 1,093 | 1.8 | +0.1 | |
Labor | Luigi Bini | 797 | 1.3 | +1.3 | |
Labor | Deb Carnes | 608 | 1.0 | +1.0 | |
Liberal | Bob Cheek (elected 3) | 7,652 | 12.9 | +6.3 | |
Liberal | Ray Groom (elected 4) | 6,430 | 10.8 | −5.4 | |
Liberal | Michael Hodgman | 4,141 | 7.0 | +0.3 | |
Liberal | John Remess | 2,843 | 4.8 | +4.8 | |
Liberal | Steven Mavrigiannakis | 435 | 0.7 | +0.7 | |
Greens | Peg Putt (elected 5) | 6,263 | 10.5 | +0.9 | |
Greens | Dick Friend | 462 | 0.8 | −1.2 | |
Greens | Trish Moran | 460 | 0.8 | +0.3 | |
Greens | Simon Baptist | 306 | 0.5 | +0.5 | |
Greens | Mat Hines | 298 | 0.5 | +0.5 | |
Tasmania First | John Presser | 464 | 0.8 | +0.8 | |
Tasmania First | Geoff Churchill | 303 | 0.5 | +0.5 | |
Tasmania First | Frank Hesman | 223 | 0.4 | +0.4 | |
Tasmania First | Inez McCarthy | 192 | 0.3 | +0.3 | |
Tasmania First | Barbara Woods | 187 | 0.3 | +0.3 | |
Democrats | Chris Ivory | 354 | 0.6 | +0.6 | |
Democrats | Brent Blackburn | 345 | 0.6 | +0.6 | |
Independent | Bob Elliston | 186 | 0.3 | +0.3 | |
Independent | Informal | 103 | 0.2 | −0.3 | |
Group B | Jenny Forward | 65 | 0.1 | +0.1 | |
Group B | Mathew Munro | 37 | 0.1 | +0.1 | |
Independent | Matthew D. Piscioneri | 56 | 0.1 | +0.1 | |
Independent | Bob Campbell | 44 | 0.1 | +0.1 | |
Independent | Gregory Broszczyk | 39 | 0.1 | +0.1 | |
Total formal votes | 59,390 | 96.3 | +1.5 | ||
Informal votes | 2,310 | 3.7 | −1.5 | ||
Turnout | 61,700 | 93.8 | −1.4 | ||
Party total votes | |||||
Labor | 27,502 | 46.3 | +0.9 | ||
Liberal | 21,501 | 36.2 | +0.8 | ||
Greens | 7,789 | 13.1 | −0.9 | ||
Tasmania First | 1,369 | 2.3 | +2.3 | ||
Democrats | 699 | 1.2 | +1.2 | ||
Independent | Bob Elliston | 186 | 0.3 | +0.3 | |
Independent | Informal | 103 | 0.2 | −0.3 | |
Group B | 102 | 0.2 | +0.2 | ||
Independent | Matthew D. Piscioneri | 56 | 0.1 | +0.1 | |
Independent | Bob Campbell | 44 | 0.1 | +0.1 | |
Independent | Gregory Broszczyk | 39 | 0.1 | +0.1 |
Party | Candidate | Votes | % | ±% | |
---|---|---|---|---|---|
Quota | 7,453 | ||||
Labor | Jim Bacon (elected 2) | 8,766 | 14.7 | +14.7 | |
Labor | John White (elected 3) | 6,809 | 11.4 | +2.9 | |
Labor | Judy Jackson (elected 6) | 3,858 | 6.5 | −3.2 | |
Labor | Julian Amos | 3,721 | 6.2 | +0.5 | |
Labor | Cora Trevarthen | 1,541 | 2.6 | +2.6 | |
Labor | Stuart Slade | 1,038 | 1.7 | +1.7 | |
Labor | Pam Wright | 888 | 1.5 | +1.5 | |
Labor | Bob Riep | 424 | 0.7 | +0.7 | |
Liberal | Ray Groom (elected 1) | 9,637 | 16.2 | −10.6 | |
Liberal | Michael Hodgman (elected 7) | 3,994 | 6.7 | −5.5 | |
Liberal | Bob Cheek (elected 5) | 3,946 | 6.6 | +6.6 | |
Liberal | Jane Goodluck | 1,922 | 3.2 | +3.2 | |
Liberal | John Barker | 998 | 1.7 | +0.1 | |
Liberal | Nell Ames | 429 | 0.7 | +0.7 | |
Liberal | Hans Willink | 207 | 0.3 | +0.3 | |
Greens | Peg Putt (elected 4) | 5,738 | 9.6 | +7.8 | |
Greens | Dick Friend | 1,211 | 2.0 | +2.0 | |
Greens | Ann Wessing | 308 | 0.5 | +0.5 | |
Greens | Kath Hughes | 299 | 0.5 | +0.5 | |
Greens | Trish Moran | 277 | 0.5 | +0.5 | |
Greens | Peter Jones | 272 | 0.5 | +0.5 | |
Greens | Margie Law | 258 | 0.4 | +0.4 | |
National | Kevin Pelham | 462 | 0.8 | +0.8 | |
National | Ian Coggins | 292 | 0.5 | +0.5 | |
Extremely Greedy 40% | Chris Kelly | 435 | 0.7 | +0.7 | |
Extremely Greedy 40% | Jenny Sheridan | 267 | 0.4 | +0.4 | |
Independent | Austra Maddox | 698 | 1.2 | +1.2 | |
Group F | Jeff Briscoe | 551 | 0.9 | +0.9 | |
Group F | Sharon Howett | 35 | 0.1 | +0.1 | |
Group D | Informal | 285 | 0.5 | +0.5 | |
Group D | Janet Locke | 52 | 0.1 | +0.1 | |
Total formal votes | 59,618 | 94.8 | +0.8 | ||
Informal votes | 3,240 | 5.2 | −0.8 | ||
Turnout | 62,858 | 95.2 | +1.7 | ||
Party total votes | |||||
Labor | 27,045 | 45.4 | +12.1 | ||
Liberal | 21,333 | 35.4 | −8.5 | ||
Greens | 8,363 | 14.0 | −3.9 | ||
National | 754 | 1.3 | +1.3 | ||
Extremely Greedy 40% | 702 | 1.2 | +1.2 | ||
Independent | Austra Maddox | 698 | 1.2 | +1.2 | |
Group F | 586 | 1.0 | +1.0 | ||
Group D | 337 | 0.6 | +0.6 |
Party | Candidate | Votes | % | ±% | |
---|---|---|---|---|---|
Quota | 6,839 | ||||
Liberal | Ray Groom (elected 1) | 14,654 | 26.8 | +8.8 | |
Liberal | Michael Hodgman (elected 3) | 6,654 | 12.2 | +12.2 | |
Liberal | John Barker (elected 5) | 858 | 1.6 | −1.1 | |
Liberal | Joy Cairns | 822 | 1.5 | +1.5 | |
Liberal | Peter Dobromilsky | 377 | 0.7 | +0.7 | |
Liberal | Ingrid Wren | 346 | 0.6 | +0.6 | |
Liberal | Chris Gibson | 332 | 0.6 | −0.3 | |
Labor | Judy Jackson (elected 4) | 5,310 | 9.7 | +2.4 | |
Labor | John White (elected 6) | 4,648 | 8.5 | +0.3 | |
Labor | David Crean | 3,176 | 5.8 | −1.8 | |
Labor | Julian Amos (elected 7) | 3,142 | 5.7 | +5.7 | |
Labor | Charles Touber | 1,030 | 1.9 | −0.8 | |
Labor | Andrew Daniels | 640 | 1.2 | −1.3 | |
Labor | Rosalind Escott | 267 | 0.5 | +0.5 | |
Independent Greens | Bob Brown (elected 2) | 8,255 | 15.1 | −6.6 | |
Independent Greens | Peg Putt | 958 | 1.8 | +1.8 | |
Independent Greens | Rob Valentine | 210 | 0.4 | +0.4 | |
Independent Greens | Karen Weldrick | 137 | 0.3 | +0.3 | |
Independent Greens | Mary Jenkins | 101 | 0.2 | +0.2 | |
Independent Greens | Stuart Baird | 89 | 0.2 | +0.2 | |
Independent Greens | Dave Heatley | 66 | 0.1 | +0.1 | |
Advance Tasmania | Hank Petrusma | 1,928 | 3.5 | +3.5 | |
Advance Tasmania | Ruth Butler | 90 | 0.2 | +0.2 | |
More Jobs | Brian Sampson | 201 | 0.4 | +0.4 | |
More Jobs | Gordon Dunsby | 155 | 0.3 | +0.3 | |
Independent | Ken Harvey | 111 | 0.2 | +0.2 | |
Independent | Mary Guy | 104 | 0.2 | +0.2 | |
Independent | Doug Fenton | 46 | 0.1 | +0.1 | |
Total formal votes | 54,707 | 95.6 | +0.4 | ||
Informal votes | 2,508 | 4.4 | −0.4 | ||
Turnout | 57,215 | 93.5 | +2.1 | ||
Party total votes | |||||
Liberal | 24,043 | 43.9 | +5.5 | ||
Labor | 18,213 | 33.3 | −3.6 | ||
Independent Greens | 9,816 | 17.9 | −5.6 | ||
Advance Tasmania | 2,018 | 3.7 | +3.7 | ||
More Jobs | 356 | 0.7 | +0.7 | ||
Independent | Ken Harvey | 111 | 0.2 | +0.2 | |
Independent | Mary Guy | 104 | 0.2 | +0.2 | |
Independent | Doug Fenton | 46 | 0.1 | +0.1 |
Party | Candidate | Votes | % | ±% | |
---|---|---|---|---|---|
Quota | 6,783 | ||||
Liberal | Ray Groom (elected 2) | 9,775 | 18.0 | +1.7 | |
Liberal | John Bennett (elected 3) | 7,525 | 13.9 | +5.1 | |
Liberal | John Barker (elected 4) | 1,486 | 2.7 | +0.1 | |
Liberal | Nell Ames | 597 | 1.1 | +1.1 | |
Liberal | Chris Gibson | 515 | 0.9 | +0.9 | |
Liberal | Tony Steven | 469 | 0.9 | +0.9 | |
Liberal | Beth Darcey | 443 | 0.8 | +0.8 | |
Labor | John White (elected 6) | 4,472 | 8.2 | +2.0 | |
Labor | David Crean (elected 7) | 4,114 | 7.6 | +7.6 | |
Labor | Judy Jackson (elected 5) | 3,942 | 7.3 | +0.5 | |
Labor | Neil Batt | 3,889 | 7.2 | +0.3 | |
Labor | Charles Touber | 1,483 | 2.7 | +2.7 | |
Labor | Andrew Daniels | 1,356 | 2.5 | +2.5 | |
Labor | Catherine Cuthbert | 779 | 1.4 | +1.4 | |
Independent Greens | Bob Brown (elected 1) | 11,755 | 21.7 | +6.1 | |
Independent Greens | Michael Lynch | 537 | 1.0 | +1.0 | |
Independent Greens | Patsy Jones | 236 | 0.4 | +0.4 | |
Independent Greens | Sheena Brookman | 197 | 0.4 | +0.4 | |
Democrats | Robert Bell | 360 | 0.7 | +0.7 | |
Democrats | June Francis | 120 | 0.2 | +0.2 | |
Democrats | Wendy Cuskelly | 101 | 0.2 | +0.2 | |
Independent | Anthony Delara | 106 | 0.2 | +0.2 | |
Total formal votes | 54,257 | 95.2 | +1.3 | ||
Informal votes | 2,746 | 4.8 | −1.3 | ||
Turnout | 57,003 | 91.4 | −1.3 | ||
Party total votes | |||||
Liberal | 20,810 | 38.4 | −5.2 | ||
Labor | 20,035 | 36.9 | +6.1 | ||
Independent Greens | 12,725 | 23.5 | +4.9 | ||
Democrats | 581 | 1.1 | +1.1 | ||
Independent | Anthony Delara | 106 | 0.2 | +0.2 |
Party | Candidate | Votes | % | ±% | |
---|---|---|---|---|---|
Quota | 6,464 | ||||
Liberal | Ray Groom (elected 1) | 8,406 | 16.3 | +16.3 | |
Liberal | John Bennett (elected 3) | 4,547 | 8.8 | +8.8 | |
Liberal | Geoff Davis (elected 5) | 2,570 | 5.0 | 0.0 | |
Liberal | Carmel Holmes | 2,489 | 4.8 | +3.4 | |
Liberal | John Barker | 1,339 | 2.6 | +2.6 | |
Liberal | Peter Walker | 1,193 | 2.3 | −2.4 | |
Liberal | Clem Hoggett | 1,078 | 2.1 | +2.1 | |
Liberal | Andrew Hurburgh | 946 | 1.8 | +1.8 | |
Labor | Neil Batt (elected 6) | 3,578 | 6.9 | +6.9 | |
Labor | Judy Jackson (elected 4) | 3,516 | 6.8 | +6.8 | |
Labor | John White (elected 7) | 3,203 | 6.2 | +6.2 | |
Labor | Julian Amos | 2,017 | 3.9 | −4.6 | |
Labor | Bob Gordon | 1,795 | 3.5 | +3.5 | |
Labor | Bob Graham | 1,437 | 2.8 | −1.6 | |
Labor | Dee Alty | 389 | 0.8 | +0.8 | |
Independent Greens | Bob Brown (elected 2) | 8,056 | 15.6 | +7.4 | |
Independent Greens | Judy Richter | 171 | 0.3 | +0.3 | |
Independent | Brian Miller | 3,374 | 6.5 | +6.5 | |
Group D | Gabriel Haros | 1,269 | 2.5 | +2.5 | |
Group D | Bernard Devine | 124 | 0.2 | +0.2 | |
Independent | Chris Munday | 214 | 0.4 | +0.4 | |
Total formal votes | 51,711 | 93.9 | −0.5 | ||
Informal votes | 3,374 | 6.1 | +0.5 | ||
Turnout | 55,085 | 92.7 | 0.0 | ||
Party total votes | |||||
Liberal | 22,568 | 43.6 | −5.2 | ||
Labor | 15,935 | 30.8 | +2.2 | ||
Independent Greens | 8,227 | 15.9 | +7.6 | ||
Independent | Brian Miller | 3,374 | 6.5 | +6.5 | |
Group D | 1,393 | 2.7 | +2.7 | ||
Independent | Chris Munday | 214 | 0.4 | +0.4 |
Party | Candidate | Votes | % | ±% | |
---|---|---|---|---|---|
Quota | 6,201 | ||||
Liberal | Max Bingham (elected 1) | 12,068 | 24.3 | −1.4 | |
Liberal | Gabriel Haros (elected 4) | 2,803 | 5.7 | +0.9 | |
Liberal | Geoff Davis (elected 5) | 2,478 | 5.0 | +2.1 | |
Liberal | John Stopp | 2,433 | 4.9 | +4.9 | |
Liberal | Peter Walker (elected 6) | 2,350 | 4.7 | +4.7 | |
Liberal | Richard Mulcahy | 1,388 | 2.8 | +2.8 | |
Liberal | Carmel Holmes | 708 | 1.4 | +1.4 | |
Labor | Julian Amos (elected 2) | 4,213 | 8.5 | −3.5 | |
Labor | John Devine (elected 3) | 3,760 | 7.6 | −4.1 | |
Labor | Bob Graham | 2,201 | 4.4 | −0.7 | |
Labor | Colin Brown | 1,362 | 2.7 | +2.7 | |
Labor | Ian Cuthbertson | 762 | 1.5 | +1.5 | |
Labor | Marjorie Luck | 711 | 1.4 | +1.4 | |
Labor | Ron Snashall | 686 | 1.4 | +1.4 | |
Labor | Arnold Sierink | 498 | 1.0 | +1.0 | |
Democrats | Norm Sanders (elected 7) | 4,275 | 8.6 | +4.4 | |
Democrats | Angela Devine | 275 | 0.6 | +0.6 | |
Democrats | Mark Clough | 204 | 0.4 | +0.4 | |
Democrats | Peter Creet | 182 | 0.4 | +0.4 | |
Democrats | Rod Broadby | 175 | 0.4 | −2.4 | |
Independent Greens | Bob Brown | 4,064 | 8.2 | +8.2 | |
Independent Greens | Tina Fraser | 209 | 0.4 | +0.4 | |
Group A | Brian Hoyle | 504 | 1.0 | +1.0 | |
Group A | Mike Brown | 336 | 0.7 | +0.7 | |
Independent | Nigel Abbott | 545 | 1.1 | +1.1 | |
Independent | Peter Bell | 131 | 0.3 | +0.3 | |
Independent | Verne Reid | 129 | 0.3 | +0.3 | |
Independent | Harvey Wallace-Williams | 63 | 0.1 | +0.1 | |
Independent | Reg Johnston | 59 | 0.1 | +0.1 | |
Independent | Emery Thierjung | 29 | 0.1 | +0.1 | |
Total formal votes | 49,601 | 94.4 | −1.9 | ||
Informal votes | 2,965 | 5.6 | +1.9 | ||
Turnout | 52,566 | 92.7 | +0.3 | ||
Party total votes | |||||
Liberal | 24,228 | 48.8 | +6.8 | ||
Labor | 14,193 | 28.6 | −22.1 | ||
Democrats | 5,111 | 10.3 | +2.9 | ||
Independent Greens | 4,273 | 8.6 | +8.6 | ||
Group A | 840 | 1.7 | +1.7 | ||
Independent | Nigel Abbott | 545 | 1.1 | +1.1 | |
Independent | Peter Bell | 131 | 0.3 | +0.3 | |
Independent | Verne Reid | 129 | 0.3 | +0.3 | |
Independent | Harvey Wallace-Williams | 63 | 0.1 | +0.1 | |
Independent | Reg Johnston | 59 | 0.1 | +0.1 | |
Independent | Emery Thierjung | 29 | 0.1 | +0.1 |
Party | Candidate | Votes | % | ±% | |
---|---|---|---|---|---|
Quota | 6,048 | ||||
Labor | Neil Batt (elected 2) | 6,106 | 12.6 | −5.8 | |
Labor | Julian Amos (elected 3) | 5,808 | 12.0 | +5.2 | |
Labor | John Devine (elected 4) | 5,664 | 11.7 | +11.7 | |
Labor | John Green (elected 5) | 3,771 | 7.8 | +2.1 | |
Labor | Bob Graham | 2,444 | 5.1 | +5.1 | |
Labor | Des Lavey | 540 | 1.1 | −1.6 | |
Labor | Norm Hanscombe | 183 | 0.4 | +0.4 | |
Liberal | Max Bingham (elected 1) | 12,432 | 25.7 | −5.3 | |
Liberal | Gabriel Haros | 2,320 | 4.8 | +4.8 | |
Liberal | Robert Mather (elected 6) | 1,845 | 3.8 | +1.0 | |
Liberal | Geoff Davis | 1,449 | 3.0 | +3.0 | |
Liberal | Bob Baker (elected 7) | 837 | 1.7 | −1.4 | |
Liberal | Max Robinson | 667 | 1.4 | +0.4 | |
Liberal | John Avery | 533 | 1.1 | +1.1 | |
Liberal | Terry Bower | 218 | 0.5 | +0.5 | |
Democrats | Norm Sanders | 2,044 | 4.2 | +4.2 | |
Democrats | Rod Broadby | 1,360 | 2.8 | +2.8 | |
Democrats | Robert MacFie | 155 | 0.3 | +0.3 | |
Total formal votes | 48,376 | 96.3 | +0.1 | ||
Informal votes | 1,871 | 3.7 | −0.1 | ||
Turnout | 50,247 | 92.4 | −0.6 | ||
Party total votes | |||||
Labor | 24,516 | 50.7 | +3.9 | ||
Liberal | 20,301 | 42.0 | −4.8 | ||
Democrats | 3,559 | 7.4 | +7.4 |
Party | Candidate | Votes | % | ±% | |
---|---|---|---|---|---|
Quota | 5,854 | ||||
Liberal | Max Bingham (elected 1) | 14,521 | 31.0 | +7.1 | |
Liberal | Hank Petrusma | 1,777 | 3.8 | +2.0 | |
Liberal | Bob Baker (elected 6) | 1,466 | 3.1 | −0.7 | |
Liberal | Robert Mather (elected 5) | 1,305 | 2.8 | −1.8 | |
Liberal | David Brownlow | 1,297 | 2.8 | +2.8 | |
Liberal | Rudge Townley | 839 | 1.8 | +1.8 | |
Liberal | Max Robinson (elected 7) | 474 | 1.0 | +1.0 | |
Liberal | Basil Giffard | 230 | 0.5 | +0.5 | |
Labor | Neil Batt (elected 2) | 8,639 | 18.4 | +9.7 | |
Labor | Julian Amos (elected 3) | 3,167 | 6.8 | +6.8 | |
Labor | John Green (elected 4) | 2,668 | 5.7 | −4.5 | |
Labor | Ian Cole | 1,887 | 4.0 | +0.4 | |
Labor | Margaret Thurstans | 1,831 | 3.9 | +3.9 | |
Labor | Thomas Gascoigne | 1,316 | 2.8 | +2.8 | |
Labor | Des Lavey | 1,269 | 2.7 | +2.7 | |
Labor | Ken Austin | 1,132 | 2.4 | −6.2 | |
United Tasmania | Rod Broadby | 1,525 | 3.3 | +3.3 | |
United Tasmania | Helen Gee | 352 | 0.8 | +0.8 | |
United Tasmania | Patricia Armstrong | 290 | 0.6 | +0.6 | |
United Tasmania | Patricia Jones | 265 | 0.6 | +0.6 | |
United Tasmania | William Hickson | 96 | 0.2 | +0.2 | |
United Tasmania | Kevin Hazelwood | 73 | 0.2 | +0.2 | |
United Tasmania | David Stephen | 64 | 0.1 | +0.1 | |
Workers | Lance Buckingham | 199 | 0.4 | +0.4 | |
Workers | Peter Mollon | 26 | 0.1 | +0.1 | |
Socialist Workers | Rosanne Fidler | 72 | 0.2 | +0.2 | |
Socialist Workers | John Tully | 51 | 0.1 | +0.1 | |
Total formal votes | 46,831 | 96.2 | 0.0 | ||
Informal votes | 1,828 | 3.8 | 0.0 | ||
Turnout | 48,659 | 93.0 | −1.3 | ||
Party total votes | |||||
Liberal | 21,909 | 46.8 | +6.8 | ||
Labor | 21,909 | 46.8 | +0.5 | ||
United Tasmania | 2,665 | 5.7 | −1.2 | ||
Workers | 225 | 0.5 | +0.5 | ||
Socialist Workers | 123 | 0.3 | +0.3 |
Party | Candidate | Votes | % | ±% | |
---|---|---|---|---|---|
Quota | 5,039 | ||||
Labor | Merv Everett (elected 2) | 6,060 | 15.0 | +2.1 | |
Labor | Neil Batt (elected 4) | 3,519 | 8.7 | +1.1 | |
Labor | Ken Austin (elected 5) | 3,485 | 8.6 | +0.4 | |
Labor | Kevin Corby (elected 7) | 2,136 | 5.3 | +5.3 | |
Labor | Ian Cole | 1,466 | 3.6 | +3.6 | |
Labor | Gabriel Klok | 884 | 2.2 | +2.2 | |
Labor | Kath Venn | 607 | 1.5 | +1.5 | |
Labor | John Green | 489 | 1.2 | +1.2 | |
Liberal | Max Bingham (elected 1) | 9,630 | 23.9 | +16.3 | |
Liberal | Robert Mather (elected 3) | 1,865 | 4.6 | −3.2 | |
Liberal | Bob Baker (elected 6) | 1,523 | 3.8 | −0.3 | |
Liberal | George Brown | 887 | 2.2 | −1.7 | |
Liberal | Ronald Banks | 792 | 2.0 | −3.5 | |
Liberal | Hank Petrusma | 724 | 1.8 | +1.8 | |
Liberal | Fred Johnson | 485 | 1.2 | +1.2 | |
Liberal | Kathleen Sargison | 228 | 0.6 | +0.6 | |
United Tasmania | Norman Laird | 1,073 | 2.7 | +2.7 | |
United Tasmania | Alfred White | 739 | 1.8 | +1.8 | |
United Tasmania | Ian Milne | 536 | 1.3 | +1.3 | |
United Tasmania | Kevin Scott | 431 | 1.1 | +1.1 | |
Independent | Nigel Abbott | 1,193 | 3.0 | +3.0 | |
Independent | Bill Wedd | 851 | 2.1 | −4.0 | |
Independent | Harry McLoughlin | 600 | 1.5 | +1.5 | |
Independent | Elvie Cobern | 63 | 0.2 | +0.2 | |
Independent | Joseph Armstrong | 45 | 0.1 | +0.1 | |
Total formal votes | 40,311 | 96.2 | +1.2 | ||
Informal votes | 1,572 | 3.8 | −1.2 | ||
Turnout | 41,883 | 94.3 | +1.4 | ||
Party total votes | |||||
Labor | 18,646 | 46.3 | +2.6 | ||
Liberal | 16,134 | 40.0 | −7.4 | ||
United Tasmania | 2,779 | 6.9 | +6.9 | ||
Independent | Nigel Abbott | 1,193 | 3.0 | +3.0 | |
Independent | Bill Wedd | 851 | 2.1 | −4.0 | |
Independent | Harry McLoughlin | 600 | 1.5 | +1.5 | |
Independent | Elvie Cobern | 63 | 0.2 | +0.2 | |
Independent | Joseph Armstrong | 45 | 0.1 | +0.1 |
The Tasmanian Greens are a political party in Australia which developed from numerous environmental campaigns in Tasmania, including the flooding of Lake Pedder and the Franklin Dam campaign. They form a part of the Australian Greens.
The House of Assembly, or Lower House, is one of the two chambers of the Parliament of Tasmania in Australia. The other is the Legislative Council or Upper House. It sits in Parliament House in the state capital, Hobart.
The 1998 Tasmanian state election was held on Saturday, 29 August 1998 in the Australian state of Tasmania to elect 25 members of the Tasmanian House of Assembly. The number of members was reduced from 35 to 25. The election used the Hare-Clark proportional representation system—five members were elected from each of five electorates. The quota required for election increased from 12.5% to 16.7%.
The 1946 Tasmanian state election was held on 23 November 1946 in the Australian state of Tasmania to elect 30 members of the Tasmanian House of Assembly. The election used the Hare-Clark proportional representation system — six members were elected from each of five electorates.
Cassandra Stanwell O'Connor is an Australian politician, who was a Tasmanian Greens member of the Tasmanian House of Assembly from 2008 to 2023, representing the electorate of Denison which was renamed to Clark in September 2018. Since the 2024 Tasmanian Legislative Council periodic election, she has represented the electorate of Hobart. O'Connor was the first female Greens minister in Australia, serving in the Giddings ministry intermittently from 2011-14. In 2015, she became leader of the Tasmanian Greens following the resignation of Kim Booth.
The electoral district of Hobart was a multi-member electoral district of the Tasmanian House of Assembly. It was based in Tasmania's capital city, Hobart.
The 2014 Tasmanian state election was held on 15 March 2014 to elect all 25 members to the House of Assembly. The 16-year incumbent Labor government, led by the Premier of Tasmania Lara Giddings, sought to win a fifth consecutive term in government, but was defeated by the Liberal opposition, led by Opposition Leader Will Hodgman, in a landslide victory. Also contesting the election was the Greens led by Nick McKim. The Palmer United Party made a significant effort in the election.
This is a list of House of Assembly results for the 2010 Tasmanian election.
This is a list of House of Assembly results for the 2006 Tasmanian election.
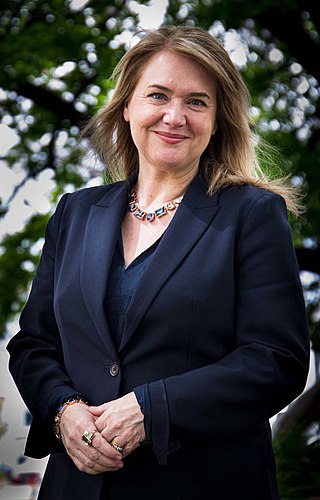
Madeleine Ruth Ogilvie is an Australian lawyer and politician. She is a Liberal Party member of the Tasmanian House of Assembly representing the Division of Clark and is a minister in the Second Rockliff ministry
Susanne Lynnette Hickey is an Australian politician. She represented the electorate of Denison from the 2018 state election until her defeat at the 2021 election, sitting with the Liberal Party until March 2021, when she quit the party and became an independent. Hickey is currently Mayor of the City of Glenorchy.
This is a list of House of Assembly results for the 2018 Tasmanian election.
Eloise Rafia "Ella" Haddad is an Australian politician. She was first elected to the Tasmanian House of Assembly for the Labor Party in the Division of Denison at the 2018 state election.
The Division of Clark is an Australian Electoral Division in the state of Tasmania, first contested at the 2019 federal election.
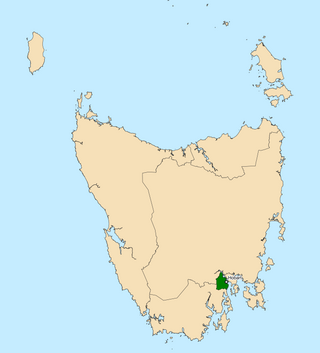
The electoral division of Clark is one of the five electorates in the Tasmanian House of Assembly, it is located in Hobart on the western shore of the River Derwent and includes the suburbs below Mount Wellington. Clark is named after Andrew Inglis Clark, a Tasmanian jurist who was the principal author of the Australian Constitution. The electorate shares its name and boundaries with the federal division of Clark.
Kristie Joy Johnston is an Australian politician. She was elected as the Mayor of City of Glenorchy in 2014 and 2018 and is an Independent member for the seat of Division of Clark, having been elected in the 2021 Tasmanian state election.
This is a list of electoral results for the division of Bass in Tasmanian elections since 1913.
This is a list of electoral results for the division of Braddon in Tasmanian elections since 1913.
This is a list of electoral results for the division of Franklin in Tasmanian elections since 1913.
This is a list of electoral results for the division of Bass in Tasmanian elections since 1972.