The software is focused on exploratory visual analytics, where users investigate and explore data. It also supports the verification of these explorations by hypothesis testing, data mining, or other analytic methods. Discoveries made using JMP's analytical tools are commonly applied for experimental design.
JMP is used in applications such as data mining, Six Sigma, quality control, design of experiments, as well as for research in science, engineering, and social sciences. The software can be purchased in any of four configurations: JMP, JMP Pro, JMP Clinical, and JMP Live. JMP can be automated with its proprietary scripting language, JSL.
History
Version 1.0 of JMP from 1989
JMP was developed in the mid- to late-1980s by John Sall and a team of developers to make use of the graphical user interface introduced by the Apple Macintosh.[2][3] It originally stood for "John's Macintosh Project"[4][5] and was first released in October 1989.[2] It was used mostly by scientists and engineers for design of experiments (DOE), quality and productivity support (Six Sigma), and reliability modeling.[6] Semiconductor manufacturers were also among JMP's early adopters.[7]
Interactive graphics and other features were added in 1991[8][9] with version 2.0, which was introduced at the 1991 Macworld Expo.[10] Version 2 was twice the size as the original, though it was still delivered on a floppy disk. It required 2 MB of memory and came with 700 pages of documentation.[11] Support for Microsoft Windows was added with version 3.1 in 1994.[5][12] Rewritten with Version 4 and released in 2002, JMP could import data from a wider variety of data sources[13] and added support for surface plots.[9] Version 4 also added time series forecasting and new smoothing models, such as the seasonal smoothing method, called Winter's Method, and ARIMA (Autoregressive Integrated Moving Average). It was also the first version to support JSL, JMP Scripting Language.[14]
In 2005, data mining tools like a decision tree and neural net were added with version 5[15] as well as Linux support, which was later withdrawn in JMP 9.[6] Later in 2005, JMP 6 was introduced.[7][16] JMP began integrating with SAS in version 7.0 in 2007 and has strengthened this integration ever since. Users can write SAS code in JMP, connect to SAS servers, and retrieve and use data from SAS. Support for bubble plots was added in version 7.[6][17] JMP 7 also improved data visualization and diagnostics.[18]
JMP 8 was released in 2009 with new drag-and-drop features and a 64-bit version to take advantage of advances in the Mac operating system.[19] It also added a new user interface for building graphs, tools for choice experiments and support for Life Distributions.[20] According to Scientific Computing, the software had improvements in "graphics, QA, ease-of-use, SAS integration and data management areas."[21] JMP 9 in 2010 added a new interface for using the R programming language from JMP and an add-in for Excel.[22][23] The main screen was rebuilt and enhancements were made to simulations, graphics and a new Degradation platform.[24] In March 2012, version 10 made improvements in data mining, predictive analytics, and automated model building.[25][26]
Version 11 was released in late 2014. It included new ease-of-use features, an Excel import wizard, and advanced features for design of experiments.[27] Two years later, version 12.0 was introduced. According to Scientific Computing, it added a new "Modeling Utilities" submenu of tools, performance improvements and new technical features for statistical analysis.[28] Version 13.0 was released in September 2016 and introduced various improvements to reporting, ease-of-use and its handling of large data sets in memory.[29][30] Version 14.0 was released in March 2018; new functionality included a Projects file management tool alongside the ability to use your own images as markers on your graph.[31]
JMP was originally developed by a business unit of SAS Institute. As of 2011, it had 180 employees and 250,000 users.[26] In January 2021, JMP Statistical Discovery, LLC became a wholly owned subsidiary of SAS.[32]
Software
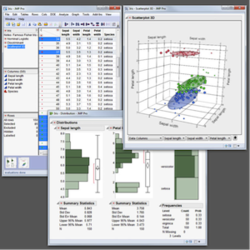
Screenshot of different data displays in JMP
JMP consists of JMP, JMP Pro, JMP Clinical and JMP Live.[33] It formerly included the Graph Builder iPad App.[34] It also formerly provided JMP Genomics, a combined JMP and SAS product, but that product was discontinued, and much of the functionality for genomic data analysis is available in JMP Pro. JMP Clinical was also formerly a combined JMP/SAS software package, but currently is solely a JMP package.
In 2024, JMP released also a free version of JMP Pro software for qualified students, instructors, and academic researchers currently enrolled or employed at a degree granting institution: JMP Student Edition.[35]
The software has a simple menu design, with information organized across either multiple windows or under multiple tabs within a single window.[36] Additional contextual menus are generated with new output.[37] The software's primary applications are for designed experiments and analyzing statistical data from industrial processes.[7] JMP can be used in conjunction with the R and Python open source programming languages to access features not available in JMP itself.[38]
JMP software is partly focused on exploratory data analysis and visualization. It is designed for users to investigate data to learn something unexpected, as opposed to confirming a hypothesis.[5][26][39] JMP links statistical data to graphics representing them, so users can drill down or up to explore the data and various visual representations of it.[13][40][41] When users interact with graphical objects, corresponding points in other tables will be updated accordingly.[37] For example, a user can select points on a graph and compare it to corresponding points on the data table, to facilitate the discovery of hidden structures within the data set.[42]
It is a desktop application with a wizard-based user interface, while SAS can be installed on servers.[26] According to a review in Pharmaceutical Statistics, JMP is often used as a graphical front-end for a SAS system, which performs the statistical analysis and tabulations.[44] JMP Pro is intended for data scientists, and has an emphasis on advanced predictive modelling and model selection.[37] JMP Genomics, used for analyzing and visualizing genomics data,[45] requires a SAS component to operate and can access SAS/Genetics and SAS/STAT procedures or invoke SAS macros.[44] JMP Clinical, used for analyzing clinical trial data, can package SAS code within the JSL scripting language and convert SAS code to JMP.[17]
JMP Scripting Language (JSL)
The JMP Scripting Language (JSL) is an interpreted language for recreating analytic results and for automating or extending the functionality of JMP software.[46]:29 JSL was first introduced in JMP version 4 in 2000.[47]:1 JSL has a LISP-like syntax, structured as a series of expressions. All programming elements, including if-then statements and loops, are implemented as JSL functions. Data tables, display elements and analyses are represented by objects in JSL that are manipulated with named messages. Users may write JSL scripts to perform analyses and visualizations not available in the point-and-click interface or to automate a series of commands, such as weekly reports.[46] SAS, Python, R, and Matlab code can also be executed using JSL.[48]
Notable applications
JMP is used for analytics, predictive modelling, machine learning, and data mining in various industries.[49][50]
In 2007, a wildlife monitoring organization, WildTrack, started using JMP with the Footprint Identification Technology (FIT) system to identify individual endangered animals by their footprints.[59][60] In 2009, the Chicago Botanic Garden used JMP to analyze DNA data from tropical breadfruit. Researchers determined that the seedless, starchy fruit was created by the deliberate hybridization of two fruits, the breadnut and the dugdug.[61]
↑ Kim, Ki (1992). "JMP, Version 2. Software for Statistical Visualization on the Apple Macintosh". Journal of Chemical Information and Modeling. 32 (2): 174–175. doi:10.1021/ci00006a600. ISSN1549-9596.
↑ John P. Sall, Northern Illinois University, archived from the original on December 5, 2012, retrieved November 16, 2012
↑ "Introducing JMP Version 8"(PDF), A Technical Publication for JMP Users, no.25, JMPer Cable, Winter 2009, archived from the original(PDF) on April 8, 2018, retrieved December 30, 2012
↑ Li, Jie; Mocko, Megan (2020-12-01). "Machine learning for a citizen data scientist: an experience with JMP". Journal of Marketing Analytics. 8 (4): 267–279. doi:10.1057/s41270-020-00092-6. ISSN2050-3326.
This page is based on this Wikipedia article Text is available under the CC BY-SA 4.0 license; additional terms may apply. Images, videos and audio are available under their respective licenses.