
The GNU Debugger (GDB) is a portable debugger that runs on many Unix-like systems and works for many programming languages, including Ada, C, C++, Objective-C, Free Pascal, Fortran, Go, and partially others.

An integrated development environment (IDE) is a software application that provides comprehensive facilities to computer programmers for software development. An IDE normally consists of at least a source code editor, build automation tools and a debugger. Some IDEs, such as NetBeans and Eclipse, contain the necessary compiler, interpreter, or both; others, such as SharpDevelop and Lazarus, do not.

An embedded system is a computer system—a combination of a computer processor, computer memory, and input/output peripheral devices—that has a dedicated function within a larger mechanical or electronic system. It is embedded as part of a complete device often including electrical or electronic hardware and mechanical parts. Because an embedded system typically controls physical operations of the machine that it is embedded within, it often has real-time computing constraints. Embedded systems control many devices in common use today. In 2009 it was estimated that ninety-eight percent of all microprocessors manufactured were used in embedded systems.

A debugger or debugging tool is a computer program used to test and debug other programs. The main use of a debugger is to run the target program under controlled conditions that permit the programmer to track its operations in progress and monitor changes in computer resources that may indicate malfunctioning code. Typical debugging facilities include the ability to run or halt the target program at specific points, display the contents of memory, CPU registers or storage devices, and modify memory or register contents in order to enter selected test data that might be a cause of faulty program execution.
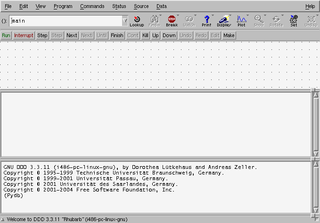
Data Display Debugger is a graphical user interface for command-line debuggers such as GDB, DBX, JDB, HP Wildebeest Debugger, XDB, the Perl debugger, the Bash debugger, the Python debugger, and the GNU Make debugger. DDD is part of the GNU Project and distributed as free software under the GNU General Public License.
In-circuit emulation (ICE) is the use of a hardware device or in-circuit emulator used to debug the software of an embedded system. It operates by using a processor with the additional ability to support debugging operations, as well as to carry out the main function of the system. Particularly for older systems, with limited processors, this usually involved replacing the processor temporarily with a hardware emulator: a more powerful although more expensive version. It was historically in the form of bond-out processor which has many internal signals brought out for the purpose of debugging. These signals provide information about the state of the processor.
JTAG is an industry standard for verifying designs and testing printed circuit boards after manufacture.
JSwat is a graphical Java debugger front-end, written to use the Java Platform Debugger Architecture. JSwat is licensed under the Common Development and Distribution License and is freely available in both binary and source code form. In addition to the graphical interface, there is a console based version which operates very much like jdb, the debugger included with the Java Development Kit.
Ups is an open source source-level debugger developed in the late 1980s for Unix and Unix-like systems, originally developed at the University of Kent by Mark Russell. It supports C and C++, and Fortran on some platforms. The last beta release was in 2003.
WinDbg is a multipurpose debugger for the Microsoft Windows computer operating system, distributed by Microsoft. Debugging is the process of finding and resolving errors in a system; in computing it also includes exploring the internal operation of software as a help to development. It can be used to debug user mode applications, device drivers, and the operating system itself in kernel mode.
On-line Debugging Tool (ODT) was used to describe several debugger programs developed for Digital Equipment Corporation (DEC) hardware. Various operating systems including OS/8, RT-11, RSX-11, and RSTS/E implemented ODT as did the firmware console of all of the LSI-11-family processors including the 11/03, 11/23/24, 11/53, 11/73, and 11/83/84.

Google Web Toolkit, or GWT Web Toolkit, is an open-source set of tools that allows web developers to create and maintain JavaScript front-end applications in Java. Other than a few native libraries, everything is Java source that can be built on any supported platform with the included GWT Ant build files. It is licensed under the Apache License 2.0.
DBG is an open-source debugger and profiler for the PHP programming language. It is the debugger used in NuSphere's PhpED.
Nemiver is computer software, a graphical standalone debugger for the programming languages C and C++, which integrates in the GNOME desktop environment. It currently features a backend which uses the well known GNU Debugger (GDB). The creator and the current lead developer is Dodji Seketeli.

Xdebug is a PHP extension which provides debugging and profiling capabilities. It uses the DBGp debugging protocol.
In computer programming and software development, debugging is the process of finding and resolving bugs within computer programs, software, or systems.
Wakanda is a JavaScript platform to develop and run web or mobile apps.
Intercepting Filter is a JavaEE pattern which creates pluggable filters to process common services in a standard manner without requiring changes to core request processing code. The filters intercept incoming requests and outgoing responses, allowing preprocessing and post-processing, and these filters can be added or removed unobtrusively without changing existing code. This pattern applies reusable processing transparently before and after the actual request execution by the front and page controllers.

