The early history of La Paz needs to be clarified. Legends state that an old pueblo called "Cama Juan" was situated along the bank of the Chico River, bordering the province of Tarlac and Nueva Ecija. When the Chico River overflowed during a storm, a great flood swept the entire pueblo during the night. The flood is said to have devastated the area, claiming many lives.[6]
This forced the inhabitants of "Cama Juan" to evacuate. The old site (Cama Juan) is known as "Balen Melakwan" or "Abandoned Town".
The inhabitants chose a field of evergreen grass and shrubbery on which to rebuild, which they named "Matayumtayum".[6]
Towards the end of the nineteenth century, Francisco Macabulos and Captain Mariano Ignacio selected a more centrally located site for the future town to be known as La Paz. This existed only as a barrio of the town of Tarlac until 1892, when it was separated from the latter and rechristened in honor of its patron saint Nuestra Senora de La Paz y Buen Viaje. Its emergence as a new town gave its citizens a chance to run their own government with Martin Aquino as the first Governadorcillo.[6]
La Paz was made the first seat of the revolutionary government of the province of Tarlac during the Spanish regime with Gen. Francisco Makabulos as its first provincial governor.
Geography
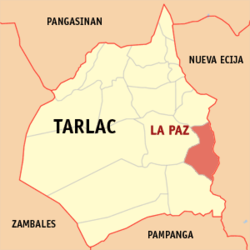
La Paz lies in the southeast portion of the province and is 141 kilometres (88mi) from Metro Manila, 17 kilometres (11mi) from the provincial capital of Tarlac City, and 33 kilometres (21mi) from Cabanatuan. It is bounded to the north by the town of Victoria, to the east by the Province of Nueva Ecija, to the south by the town of Concepcion, and to the west by Tarlac City.
The municipality has a total land area of 11,433 hectares (28,250 acres) which represents 2.34% of the entire provincial area. La Paz is politically subdivided into 18 barangays, of which barangays San Isidro and San Roque are considered as urban areas and the rest of the barangays are considered rural areas.
Economy
La Paz is home to Solaren Renewable Energy Solutions Corporation, a Department of Energy (DOE) and Philippine Contractors Accreditation Board (PCAB)–accredited solar EPC contractor headquartered in the municipality.[7]
Barangays
La Paz is politically subdivided into 21 barangays:
In the 2020 census, the population of La Paz, Tarlac, was 68,952 people,[14] with a density of 600 inhabitants per square kilometre or 1,600 inhabitants per square mile.
The feast of Nuestra De Seṅora De La Paz every January 23 to 24. Other tourism attractions in the town include Macabulos ancestral house, Nuestra Seṅora De La Paz Church, and Chico River Grill Station.
Transportation
The municipality has an approximate total road network of 78.863 kilometres (49.003mi) which are classified into four (4) categories, namely: national, provincial, municipal and barangay roads.
The barangay road network has an approximate length of 49.264 kilometres (30.611mi). The roads are paved with either concrete, asphalt, gravel or dirt. The gravel and dirt roads have a total length of 42.794 kilometres (26.591mi).
There are two schools district offices which govern all educational institutions within the municipality. They oversee the management and operations of all private and public, from primary to secondary schools.[23] These are La Paz North Schools District Office, and La Paz South Schools District Office.
Primary and elementary schools
Balanoy Elementary School
Bantog Elementary School
Caramutan Elementary School
Caut Elementary School
Comillas Elementary School
Dumarais Elementary School
E.M. Castaneda Central School
Great Eastern Institute
Guevara Elementary School
Guevara Ecumenical Christian School
Kapanikian Elementary School
La Paz Christian Academy
La Purisima Elementary School
Lara Primary School
Laungcupang Elementary School
Lomboy Elementary School
Macalong Elementary School
Matayumtayum Elementary School
Mayang Elementary School
Motrico Elementary School
Paludpud Elementary School
Rizal Multigrade
San Isidro Central Elementary School
Sierra Elementary School
Uzziel Montessori School
Secondary schools
Comillas High School
Guevara National High School
La Paz National High School
Points of interest
(F-1790) Shrine of Our Lady of Peace and Good Voyage (Nuestra Señora de la Paz y Buen Viaje), La Paz 2314 Tarlac, Philippines (Titular: Our Lady of Peace and Good Voyage, Feast day, January 24; Former Parish Priest: Father Ramon Capuno under the Roman Catholic Diocese of Tarlac; Pilgrims seek healing; Vicariate of Immaculate Conception (Victoria, Tarlac) Vicar Forane: Father Vely Lapitan.LA PAZ: THE CORRIDOR OF UPCOMING MARKET GROWTH AND BOOM
Gallery
Highway
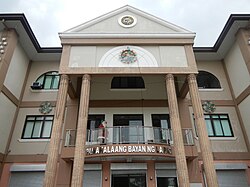
Legislative building
Public market
La Paz Church Shrine of Our Lady of Peace and Good Voyage
This page is based on this Wikipedia article Text is available under the CC BY-SA 4.0 license; additional terms may apply. Images, videos and audio are available under their respective licenses.