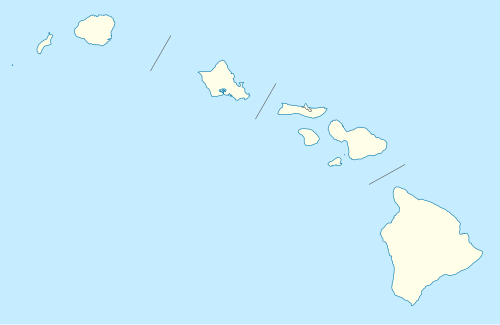
List of United States rapid transit systems

Last updated

The following is a list of all heavy rail rapid transit systems in the United States. It does not include statistics for bus or light rail systems; see: List of United States light rail systems by ridership for light rail systems. All ridership figures represent unlinked passenger trips, so line transfers on multi-line systems register as separate trips. The data is provided by the American Public Transportation Association's Ridership Reports.

Contents

Note: ridership does not mean unique passengers, it means total number of trips.

SystemTransit agencyCity/area servedAnnual
ridership
2024
[1]
Avg. ridership
weekdays, Q4 2024
[2]
System
length
Avg. boardings
per mile
weekdays, Q4 2024
OpenedStationsLines
1 New York City Subway NYCTA [note 1] New York City 2,040,132,0006,734,700248 mi (399 km) [3] 27,1561904 [4] 472 [4] 26 [4]
2 Washington Metro WMATA Washington metropolitan area 166,654,000519,700129 mi (208 km) [5] 4,0291976 [5] 98 [5] 6
3 Chicago "L" CTA Chicago 127,463,400390,100102.8 mi (165.4 km) [6] 3,7951892 [6] 146 [6] 8 [6]
4 MBTA subway ("The T") [note 2]
(Blue, Orange, and Red lines)
MBTA Boston 84,251,600284,70038 mi (61 km) [7] 7,492190153 [7] 3 [7]
5 PATH PANYNJ Manhattan, Hudson County, Newark 62,489,400211,60013.8 mi (22.2 km) [8] [9] 15,3331908 [10] 13 [8] 4 [11]
6 SEPTA Metro [note 3]
(L, B, and M)
SEPTA Philadelphia 59,009,800219,00036.7 mi (59.1 km) [12] [13] 5,9671907 [14] 75 [15] 3 [15]
7 Bay Area Rapid Transit (BART) [note 4] BART San Francisco Bay Area 49,075,000161,800131.4 mi (211.5 km) [16] 1,3591972 [17] 50 [16] 7 [18]
8 MARTA rail MARTA Atlanta 29,416,40089,00047.6 mi (76.6 km)1,8701979 [19] 38 [20] 4 [20]
9 Metro Rail [note 3]
(B and D lines)
LACMTA Los Angeles 22,471,20069,40017.4 mi (28.0 km) [21] 3,9891993 [21] 16 [21] 2 [21]
10 Metrorail Miami-Dade Transit Miami 14,911,30050,90024.4 mi (39.3 km) [22] 2,0861984 [23] 23 [22] 2 [22]
11 PATCO Speedline PATCO Philadelphia, Camden County 5,640,60018,50014.2 mi (22.9 km) [24] 1,3031936 [24] 13 [24] 1 [24]
12 Baltimore Metro SubwayLink MTA Baltimore 5,487,00015,000 [note 5] 15.5 mi (24.9 km) [25] 9701983 [26] 14 [25] 1 [25]
13 Staten Island Railway SIRTOA [note 1] Staten Island 4,743,00018,50014 mi (23 km) [3] 1,3211860 [27] 21 [3] 1 [3]
14 Tren Urbano ATI San Juan 4,438,40019,60010.7 mi (17.2 km) [28] 1,8322004 [28] 16 [28] 1 [28]
15 RTA Rapid Transit [note 3]
(Red Line)
GCRTA Cleveland 3,151,5009,70019 mi (31 km) [29] 5111955 [30] 18 [29] 1 [29]
16 Skyline Honolulu DTS Honolulu 614,8003,70010.8 mi (17.4 km)3432023 [31] 9 [31] 1 [31]

See also

Notes

  1. 1 2 Agency is a subsidiary of the Metropolitan Transportation Authority.
  2. System also includes the Green Line and Mattapan Line light rail lines; ridership data for these light rail lines is not included in statistics shown here.
  3. 1 2 3 System also includes light rail lines. Ridership data for such lines is not included in statistics given.
  4. Figures only include BART's five rapid transit lines, and not the system's AGT line to Oakland Airport nor the eBART line.
  5. This is the Average Daily Ridership not Average Weekday Ridership.

References

  1. "Transit Ridership Report Fourth Quarter 2024" (PDF). American Public Transportation Association. February 19, 2025. Retrieved February 25, 2025.
  2. "Transit Ridership Report Third Quarter 2024" (PDF). American Public Transportation Association. November 20, 2024. Retrieved November 23, 2024.
  3. 1 2 3 4 "Comprehensive Annual Financial Report for the Years Ended December 31, 2018 and 2017" (PDF). Metropolitan Transportation Authority (MTA). June 26, 2019. p. 156. Retrieved January 15, 2021.
  4. 1 2 3 "The MTA Network - New York City Transit at a Glance". Metropolitan Transportation Authority (MTA) . Retrieved August 29, 2014.
  5. 1 2 3 "About Metro". Washington Metropolitan Area Transit Authority. 2014. Archived from the original on December 2, 2016. Retrieved August 28, 2014.
  6. 1 2 3 4 "Facts at a Glance". Chicago Transit Authority . Retrieved May 17, 2013.
  7. 1 2 3 "Ridership and Service Statistics, Fourteenth Edition 2014" (PDF). Massachusetts Bay Transportation Authority. July 2014. pp. 3–4, 6. Archived from the original (pdf) on September 12, 2014. Retrieved August 31, 2014.
  8. 1 2 "Greenhouse Gas (GHG) and Criteria Air Pollutant (CAP) Emission Inventory (EI) for the Port Authority of New York & New Jersey: 2008 Summary and 2006-2008 Trends" (PDF). PATH. June 2010. p. 4. Archived from the original (pdf) on February 10, 2017. Retrieved September 27, 2012.
  9. "Facts & Info - PATH - The Port Authority of NY & NJ". PATH. 2013. Archived from the original on November 29, 2019. Retrieved July 18, 2013.
  10. "History". PATH . Retrieved June 6, 2012.
  11. "Maps & Schedule". PATH. Archived from the original on December 3, 2012. Retrieved June 6, 2012.
  12. "SEPTA Route Statistics 2014" (PDF). Southeastern Pennsylvania Transportation Authority (SEPTA) Service Planning Department. Spring 2014. pp. 9, 13, 221. Archived from the original (pdf) on May 24, 2013. Retrieved August 31, 2014.
  13. "Media Guide" (pdf). SEPTA. 2013. pp. 7, 11. Retrieved August 31, 2014.
  14. "SEPTA 'Elebrates' End Of Project". SEPTA. September 11, 2009.
  15. 1 2 "SEPTA Operating Facts Fiscal Year 2013" (pdf). SEPTA. June 30, 2013. pp. 4–6. Retrieved August 31, 2014.
  16. 1 2 "System Facts". Bay Area Rapid Transit . Retrieved January 19, 2023.
  17. "Rider recalls first day of BART passenger service on Sept. 11, 1972". Bay Area Rapid Transit. September 11, 2009. Retrieved June 19, 2012.
  18. "BART - Schedules By Line". Bay Area Rapid Transit. 2019. Retrieved March 3, 2019.
  19. "About MARTA: MARTA's Past & Future". Metropolitan Atlanta Rapid Transit Authority . Retrieved June 24, 2012.
  20. 1 2 "Bombardier Partners with Atlanta to Improve Track Worker Protection with TrackSafe Technology" (Press release). Bombardier. April 17, 2012. Retrieved June 24, 2012.
  21. 1 2 3 4 "Chapter 1.0 - Purpose and Need", Westside Transit Corridor Extension Study: Final Alternatives Analysis Study (pdf), Los Angeles County Metropolitan Transportation Authority, January 2009, pp. 1–18, retrieved September 28, 2012
  22. 1 2 3 "Metrorail". Miami-Dade County . Retrieved August 27, 2012.
  23. "Miami-Dade Transit History". Miami-Dade County . Retrieved June 26, 2012.
  24. 1 2 3 4 "A History of Commitment". Port Authority Transit Corporation . Retrieved June 6, 2012.
  25. 1 2 3 "Metro Subway". Maryland Transportation Authority . Retrieved September 28, 2012.
  26. "2010-2011 MTA Media Guide" (pdf). Maryland Transportation Authority . Retrieved September 28, 2012.
  27. Chan, Sewell; Schweber, Nate (December 26, 2008). "Staten Island Rail Car Derails in Tottenville". The New York Times . Retrieved September 28, 2012.
  28. 1 2 3 4 "Project Profiles: Tren Urbano". Federal Highway Administration . Retrieved September 28, 2012.
  29. 1 2 3 "2013 Annual Report - RTA Facts". Greater Cleveland Regional Transit Authority. October 31, 2013. Retrieved September 5, 2014.
  30. "RTA History". Greater Cleveland Regional Transit Authority . Retrieved September 28, 2012.
  31. 1 2 3 "Skyline Rail Operations". Honolulu City Council . Retrieved September 19, 2023.