Malimono

Last updated
Malimono
Municipality of Malimono
Flag of Malimono, Surigao del Norte.png
Ph locator surigao del norte malimono.png
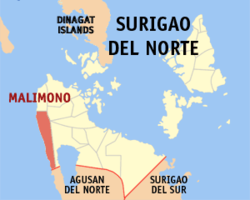
Map of Surigao del Norte with Malimono highlighted
OpenStreetMap
Malimono
Philippines location map (square).svg
Red pog.svg
Malimono
Location within the Philippines
Coordinates: 9°37′06″N125°24′07″E / 9.6183°N 125.4019°E / 9.6183; 125.4019
Country Philippines
Region Caraga
Province Surigao del Norte
District 2nd district
Barangays 14 (see Barangays)
Government
[1]
  Type Sangguniang Bayan
   Mayor Arnel Sinaca Amalla (NP)
   Vice Mayor Robert T. Senaca (NP)
   Representative Bernadette S. Barbers (NP)
   Municipal Council
Members
  • Monaliza C. Mantilla (IND)
  • Natividad P. Abraham (LAKAS)
  • Radito M. Galola (LAKAS)
  • Agustino G. Sandigan (NP)
  • Rose Ann L. Tandugon (NP)
  • Joan S. Stohlton (NP)
  • Eulogio S. Ferol III (NP)
  • Reynaldo T. Paño (LAKAS)
   Electorate 15,021 voters (2025)
Area
[2]
  Total
80.13 km2 (30.94 sq mi)
Elevation
178 m (584 ft)
Highest elevation
1,009 m (3,310 ft)
Lowest elevation
0 m (0 ft)
Population
 (2024 census) [3]
  Total
19,442
  Density240/km2 (630/sq mi)
   Households
4,629
Economy
   Income class 5th municipal income class
   Poverty incidence
31.82
% (2021) [4]
   Revenue 138.5 million (2022)
   Assets 406.9 million (2022)
   Expenditure 110.8 million (2022)
   Liabilities 172.4 million (2022)
Service provider
  ElectricitySurigao del Norte Electric Cooperative (SURNECO)
Time zone UTC+8 (PST)
ZIP code
8402
PSGC
IDD : area code +63(0)86
Native languages Surigaonon
Agusan
Cebuano
Tagalog
Website www.malimono.gov.ph

Malimono, officially the Municipality of Malimono (Surigaonon: Lungsod nan Malimono; Cebuano : Lungsod sa Malimono; Tagalog : Bayan ng Malimono), is a municipality in the province of Surigao del Norte, Philippines. According to the 2020 census, it has a population of 18,852 people. [5]

Contents

Geography

Barangays

Malimono is politically subdivided into 14 barangays. Each barangay consists of puroks while some have sitios.

Climate

Climate data for Malimono, Surigao del Norte
MonthJanFebMarAprMayJunJulAugSepOctNovDecYear
Mean daily maximum °C (°F)27
(81)
27
(81)
28
(82)
30
(86)
30
(86)
29
(84)
29
(84)
30
(86)
30
(86)
29
(84)
29
(84)
28
(82)
29
(84)
Mean daily minimum °C (°F)23
(73)
23
(73)
23
(73)
23
(73)
25
(77)
25
(77)
25
(77)
25
(77)
25
(77)
25
(77)
24
(75)
24
(75)
24
(75)
Average precipitation mm (inches)210
(8.3)
161
(6.3)
123
(4.8)
85
(3.3)
148
(5.8)
186
(7.3)
164
(6.5)
157
(6.2)
141
(5.6)
190
(7.5)
223
(8.8)
200
(7.9)
1,988
(78.3)
Average rainy days21.016.818.518.224.927.728.427.026.127.624.622.0282.8
Source: Meteoblue [6]

Demographics

Population census of Malimono
YearPop.±% p.a.
1960 6,537    
1970 9,412+3.71%
1975 10,074+1.37%
1980 12,109+3.75%
1990 16,208+2.96%
1995 14,191−2.46%
2000 14,597+0.61%
2007 16,883+2.03%
2010 18,316+3.01%
2015 18,054−0.27%
2020 18,852+0.91%
2024 19,442+0.74%
Source: Philippine Statistics Authority [7] [8] [9] [10] [11]

Economy

Poverty incidence of Malimono

10
20
30
40
50
60
70
2000
59.47
2003
69.03
2006
51.20
2009
50.25
2012
51.80
2015
42.86
2018
35.17
2021
31.82

Source: Philippine Statistics Authority [12] [13] [14] [15] [16] [17] [18] [19]

References

  1. Municipality of Malimono | (DILG)
  2. "2015 Census of Population, Report No. 3 – Population, Land Area, and Population Density" (PDF). Philippine Statistics Authority. Quezon City, Philippines. August 2016. ISSN   0117-1453. Archived (PDF) from the original on May 25, 2021. Retrieved July 16, 2021.
  3. "2024 Census of Population (POPCEN) Population Counts Declared Official by the President". Philippine Statistics Authority. 17 July 2025. Retrieved 18 July 2025.
  4. "PSA Releases the 2021 City and Municipal Level Poverty Estimates". Philippine Statistics Authority. 2 April 2024. Retrieved 28 April 2024.
  5. "2024 Census of Population (POPCEN) Population Counts Declared Official by the President". Philippine Statistics Authority. 17 July 2025. Retrieved 18 July 2025.
  6. "Malimono: Average Temperatures and Rainfall". Meteoblue. Retrieved 20 November 2019.
  7. "2024 Census of Population (POPCEN) Population Counts Declared Official by the President". Philippine Statistics Authority. 17 July 2025. Retrieved 18 July 2025.
  8. Census of Population (2015). "Caraga". Total Population by Province, City, Municipality and Barangay. Philippine Statistics Authority . Retrieved 20 June 2016.
  9. Census of Population and Housing (2010). "Caraga" (PDF). Total Population by Province, City, Municipality and Barangay. National Statistics Office . Retrieved 29 June 2016.
  10. Censuses of Population (1903–2007). "Caraga". Table 1. Population Enumerated in Various Censuses by Province/Highly Urbanized City: 1903 to 2007. National Statistics Office.
  11. "Province of". Municipality Population Data. Local Water Utilities Administration Research Division. Retrieved 17 December 2016.
  12. "Poverty incidence (PI):". Philippine Statistics Authority. Retrieved December 28, 2020.
  13. "Estimation of Local Poverty in the Philippines" (PDF). Philippine Statistics Authority. 29 November 2005.
  14. "2003 City and Municipal Level Poverty Estimates" (PDF). Philippine Statistics Authority. 23 March 2009.
  15. "City and Municipal Level Poverty Estimates; 2006 and 2009" (PDF). Philippine Statistics Authority. 3 August 2012.
  16. "2012 Municipal and City Level Poverty Estimates" (PDF). Philippine Statistics Authority. 31 May 2016.
  17. "Municipal and City Level Small Area Poverty Estimates; 2009, 2012 and 2015". Philippine Statistics Authority. 10 July 2019.
  18. "PSA Releases the 2018 Municipal and City Level Poverty Estimates". Philippine Statistics Authority. 15 December 2021. Retrieved 22 January 2022.
  19. "PSA Releases the 2021 City and Municipal Level Poverty Estimates". Philippine Statistics Authority. 2 April 2024. Retrieved 28 April 2024.