Oxford (provincial electoral district)

Last updated
Oxford
Flag of Ontario.svg Ontario electoral district
Oxford, riding.png
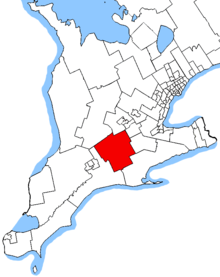
Oxford in relation to the southern Ontario ridings
Provincial electoral district
Legislature Legislative Assembly of Ontario
MPP


Ernie Hardeman
Progressive Conservative
District created1999
First contested 1999
Last contested 2022
Demographics
Population (2016)113,790
Electors (2018)89,597
Area (km²)2,270
Pop. density (per km²)50.1
Census division(s) Oxford County
Census subdivision(s) Woodstock, Tillsonburg, Ingersoll, Norwich, Zorra, South-West Oxford, East Zorra – Tavistock, Blandford-Blenheim

Oxford is a provincial electoral district in Ontario, Canada, that has been represented in the Legislative Assembly of Ontario since the 1999 provincial election.

Contents

It consists of the county of Oxford and a small portion of Brant.

Members of Provincial Parliament

Oxford
AssemblyYearsMemberParty
Created from Oxford North and Oxford South ridings in 1934
19th  1934–1937   Patrick Dewan Liberal
20th  1937–1943
21st  1943–1945   Thomas Roy Dent Progressive Conservative
22nd  1945–1948
23rd  1948–1951
24th  1951–1955
25th  1955–1959   Gord Innes Liberal
26th  1959–1963
27th  1963–1967   Gord Pittock Progressive Conservative
28th  1967–1971   Gord Innes Liberal
29th  1971–1975   Harry Parrott Progressive Conservative
30th  1975–1977
31st  1977–1981
32nd  1981–1985   Dick Treleaven Progressive Conservative
33rd  1985–1987
34th  1987–1990   Charlie Tatham Liberal
35th  1990–1995   Kimble Sutherland New Democratic
36th  1995–1999   Ernie Hardeman Progressive Conservative
37th  1999–2003
38th  2003–2007
39th  2007–2011
40th  2011–2014
41st  2014–2018
42nd  2018–2022
43rd  2022–present

Election results

2025 Ontario general election
The 2025 general election will be held on February 27.
PartyCandidateVotes%±%Expenditures
New Blue Peter Beimers
New Democratic Khadijah Haliru
Progressive Conservative Ernie Hardeman
Ontario Party Grace Harper
Green Colton Kaufman
Liberal Bernia Martin
Libertarian Henryk Szymczyszyn
Total valid votes/expense limit
Total rejected, unmarked, and declined ballots
Turnout
Eligible voters
2022 Ontario general election
PartyCandidateVotes%±%Expenditures
Progressive Conservative Ernie Hardeman 22,16650.015.72$47,286
New Democratic Lindsay Wilson9,50421.448.98$37,217
Liberal Mary Holmes5,45712.31+5.39$23,863
Ontario Party Karl Toews3,5798.08+7.22$39,947
Green Cheryle Rose Baker2,0974.73+0.42$570
New Blue Connie Oldenburger1,5183.43 $7,700
Total valid votes/expense limit44,32199.46+0.91$134,298
Total rejected, unmarked, and declined ballots2400.54-0.91
Turnout44,56146.45-12.8
Eligible voters94,368
Progressive Conservative hold Swing +1.63
Source(s)
  • "Summary of Valid Votes Cast for Each Candidate" (PDF). Elections Ontario. 2022. Archived from the original on 2023-05-18.
  • "Statistical Summary by Electoral District" (PDF). Elections Ontario. 2022. Archived from the original on 2023-05-21.
2018 Ontario general election
PartyCandidateVotes%±%
Progressive Conservative Ernie Hardeman 29,15255.73+9.49
New Democratic Tara King15,91730.43+4.66
Liberal James Howard3,6206.92-14.41
Green Albert De Jong2,2544.31-0.53
Ontario Party Robert Van Ryswyck4470.85
Libertarian Chris Swift3700.71-0.18
Independent David Sikal3350.64
Freedom Tim Hodges2160.41-0.53
Total valid votes52,311100.0  
Total rejected, unmarked and declined ballots
Turnout60.20
Eligible voters86,877
Progressive Conservative hold Swing +2.42
Source: Elections Ontario [1]
2014 Ontario general election
PartyCandidateVotes%±%
Progressive Conservative Ernie Hardeman 18,95846.24-8.63
New Democratic Bryan Smith10,57325.79+10.14
Liberal Dan Moulton8,73621.31-3.66
Green Mike Farlow1,9854.84+1.29
Freedom Tim Hodges3840.94
Libertarian Devin Wright3650.89
Total valid votes41001100.00
Progressive Conservative hold Swing -9.39
Source: Elections Ontario [2]
2011 Ontario general election
PartyCandidateVotes%±%
Progressive Conservative Ernie Hardeman 20,65854.87+7.60
Liberal David Hilderley9,41024.99-4.34
New Democratic Dorothy Marie Eisen5,88515.63+4.28
Green Catherine Stewart-Mott1,3363.55-5.26
Family Coalition Leonard Vanderhoeven3590.95-0.60
Total valid votes 37,648100.0
Total rejected, unmarked and declined ballots1230.33
Turnout37,77149.18
Eligible voters76,804
Progressive Conservative hold Swing +5.97
Source: Elections Ontario [3]
2007 Ontario general election
PartyCandidateVotes%±%
Progressive Conservative Ernie Hardeman 18,44547.27+3.21
Liberal Brian Jackson11,45529.36-8.77
New Democratic Mike Comeau4,42111.33-1.21
Green Tom Mayberry3,4418.82+6.83
Independent Jim Bender6591.69 
Family Coalition Leonard Vanderhoeven6011.54-0.08
Total valid votes 39,022 100.0
2003 Ontario general election
PartyCandidateVotes%±%
Progressive Conservative Ernie Hardeman 18,65644.06-9.19
Liberal Brian Brown16,13538.10+2.57
New Democratic Shawn Rouse5,31812.56+5.35
Green Tom Mayberry8381.98 
Family Coalition Andre De Decker6891.63-0.42
Freedom Paul Blair4040.95+0.22
Libertarian Kaye Sargent3060.72-0.03
Total valid votes42,346 100.0
1999 Ontario general election
PartyCandidateVotes%
Progressive Conservative Ernie Hardeman 22,72653.25
Liberal Brian Brown15,16035.53
New Democratic Martin Donlevy3,0777.21
Family Coalition Andre De Decker8752.05
Libertarian Kaye Sargent3210.75
Freedom Paul Blair3120.73
Natural Law Jim Morris2030.48
Total valid votes 42,674 100.0

2007 electoral reform referendum

2007 Ontario electoral reform referendum
SideVotes
First Past the Post25,05966
Mixed member proportional12,91734
Total valid votes37,976100.0

References

Sources

  1. "Summary of Valid Votes Cast for each Candidate" (PDF). Elections Ontario. p. 8. Archived from the original (PDF) on 28 December 2018. Retrieved 20 January 2019.
  2. Elections Ontario. "General Election Results by District, 067 Oxford" . Retrieved 13 June 2014.
  3. Elections Ontario (2011). "Official return from the records / Rapport des registres officiels - Oxford" (PDF). Retrieved 2 June 2014.

43°04′N80°36′W / 43.06°N 80.6°W / 43.06; -80.6