York Centre (provincial electoral district)

Last updated
York Centre
Flag of Ontario.svg Ontario electoral district
Ontario 2018 York Centre.svg
York Centre in relation to the other Toronto ridings (2015 boundaries)
Provincial electoral district
Legislature Legislative Assembly of Ontario
MPP


Michael Kerzner
Progressive Conservative
First contested 1999
Last contested 2025
Demographics
Population (2016)104,320
Electors (2018)70,520
Area (km²)35
Pop. density (per km²)2,980.6
Census division(s) Toronto
Census subdivision(s) Toronto
Map of York Centre York Centre Elections Canada map 35118 (2015 boundaries).gif
Map of York Centre
York Centre from 2003 to 2018 York Centre, Toronto.png
York Centre from 2003 to 2018
Map of York Centre under 2003 boundaries York Centre (2003 federal riding map).png
Map of York Centre under 2003 boundaries

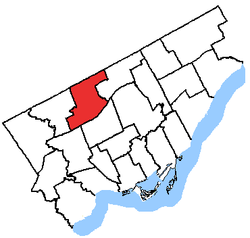
York Centre is a provincial electoral district in Ontario, Canada, that has been the name of ridings in the Legislative Assembly of Ontario three different times. It was created initially in 1955 from the southern part of York North. It was dissolved in 1963 when it was split into three ridings called Yorkview, Downsview and Armourdale. In 1967, it was reconstituted north of Steeles in the township of Markham. This lasted until 1999 when it was dissolved into Markham—Unionville. The name was given to a new riding formed in its original location south of Steeles. It remains as an existing riding today.

Contents

Boundaries

1955 to 1963

The original boundaries consisted of Steeles Avenue West to the north, Yonge Street to the East, Lawrence Avenue West to the south and the Humber River to the west.

1963 to 1999

1999 to present

York Centre consists of the part of the City of Toronto within the North York district bounded on the north by the northern city limit, and on the east, south and west by a line drawn from the city limit south along Yonge Street, west along the hydroelectric transmission line north of Finch Avenue West, south along Bathurst Street, southeast along the Don River West Branch, southwest and west along Highway 401, north along Jane Street, east along Sheppard Avenue West, northwest along Black Creek, east along Grandravine Drive, and north along Keele Street to the city limit.

History

The provincial electoral district was created in 1999 when provincial ridings were defined to have the same borders as federal ridings.

Before 1999, the name York Centre was assigned to a completely different riding located in York Region north of Toronto with none of the same territory as the current York Centre. In 1999, much of the old York Centre was absorbed by the new riding of Vaughan—King—Aurora. The former riding was Wilson Heights.

Members of Provincial Parliament

York Centre
AssemblyYearsMemberParty
Riding created from York North
25th  1955–1959   Thomas Graham Progressive Conservative
26th  1959–1963   Vernon Singer Liberal
Riding dissolved into Yorkview, Downsview and Armourdale
Riding re-created
28th  1967–1971   Donald Deacon Liberal
29th  1971–1975
30th  1975–1977 Alfred Stong
31st  1977–1981
32nd  1981–1985   Don Cousens Progressive Conservative
33rd  1985–1987
34th  1987–1990   Greg Sorbara Liberal
35th  1990–1995
36th  1995–1999   Al Palladini Progressive Conservative
Riding dissolved into Vaughan—King—Aurora and Markham
Riding re-created from Downsview and Wilson Heights
37th  1999–2003   Monte Kwinter Liberal
38th  2003–2007
39th  2007–2011
40th  2011–2014
41st  2014–2018
42nd  2018–2021   Roman Baber Progressive Conservative
 2021–2022   Independent
43rd  2022–2025   Michael Kerzner Progressive Conservative
44th  2025–present
Sourced from the Ontario Legislative Assembly [1]

Election results

Winning party in each polling division of York Centre at the 2025 Ontario general election York Centre 2025 pollling division map winner.svg
Winning party in each polling division of York Centre at the 2025 Ontario general election
2025 Ontario general election
PartyCandidateVotes%±%
Progressive Conservative Michael Kerzner 16,41654.06+8.03
Liberal Sam Nestico10,82335.64+3.70
New Democratic Natalie Van Halteren1,7005.60–8.39
Green Courtney Martin6582.17–0.67
New Blue Johnny Blythe3091.02–0.44
Special Needs Lionel Poizner2120.70+0.26
Populist Jeffrey Anisman1400.46N/A
Moderate Parviz Isgandadrov1110.37+0.09
Total valid votes30,36998.88+0.07
Total rejected, unmarked and declined ballots3451.12–0.07
Turnout30,71439.67+0.73
Eligible voters76,546
Progressive Conservative hold Swing +2.17
Source: Elections Ontario [2] [3]
Winning party in each polling division of York Centre at the 2022 Ontario general election York Centre 2022 polling division map winner.svg
Winning party in each polling division of York Centre at the 2022 Ontario general election
2022 Ontario general election
PartyCandidateVotes%±%Expenditures
Progressive Conservative Michael Kerzner 12,94746.034.12$79,866
Liberal Shelley Brown8,98431.94+10.54$74,566
New Democratic Frank Chu3,93513.999.45$16,511
Green Alison Lowney7992.84+0.55$0
Ontario Party Nick Balaskas6792.41 $988
New Blue Don Pincivero4111.46 $0
None of the Above Mark Dewdney1690.600.67$0
Special Needs Lionel Wayne Poizner1240.44 $0
Moderate Parviz Isgandarov800.280.09$780
Total valid votes/expense limit28,12898.81+0.30$102,341
Total rejected, unmarked, and declined ballots3391.19-0.30
Turnout28,46738.94-13.98
Eligible voters72,576
Progressive Conservative gain from Independent Swing 7.33
Source(s)
  • "Summary of Valid Votes Cast for Each Candidate" (PDF). Elections Ontario. 2022. Archived from the original on 2023-05-18.
  • "Statistical Summary by Electoral District" (PDF). Elections Ontario. 2022. Archived from the original on 2023-05-21.
2018 Ontario general election
PartyCandidateVotes%±%
Progressive Conservative Roman Baber 18,43450.15+19.29
New Democratic Andrea Vásquez Jiménez8,61723.44+7.07
Liberal Ramon Estaris7,86521.39-26.72
Green Roma Lyon8432.29-0.96
None of the Above Cherie Ann Day4671.27
Libertarian Benjamin Kamminga3981.08
Moderate Alexander Leonov1370.37
Total valid votes36,76198.51
Total rejected, unmarked and declined ballots5561.49
Turnout37,31752.92
Eligible voters70,520
Progressive Conservative notional gain from Liberal Swing +23.01
Source: Elections Ontario [4]
2014 general election redistributed results [5]
PartyVote %
  Liberal 14,55648.12
  Progressive Conservative 9,33330.85
  New Democratic 4,95316.37
  Green 9843.25
 Others4251.40
2014 Ontario general election
PartyCandidateVotes%±%
Liberal Monte Kwinter 16,93547.22+2.68
Progressive Conservative Avi Yufest11,12531.02-4.50
New Democratic John Fagan5,64515.74+1.61
Green Josh Borenstein1,1563.27+1.62
Freedom Laurence Cherniak4891.38+1.05
Total valid votes35,350100.0  
Liberal hold Swing +3.66
Source: Elections Ontario [6]
2011 Ontario general election
PartyCandidateVotes%±%
Liberal Monte Kwinter 14,69445.36-3.37
Progressive Conservative Michael Mostyn11,50635.52+3.24
New Democratic John Fagan4,57914.13+3.26
Libertarian David Epstein8462.61 
Green Yuriy Shevyryov5351.65-4.81
Independent Jeff Pancer1270.39 
Freedom Ron Tal1080.33 
Total valid votes32,395100.00
Total rejected, unmarked and declined ballots3250.99
Turnout32,72045.74
Eligible voters71,531
Liberal hold Swing -3.31
Source: Elections Ontario [7]
2007 Ontario general election
PartyCandidateVotes%±%
Liberal Monte Kwinter 16,64648.73-10.68
Progressive Conservative Igor Toutchinski11,02832.28+7.45
New Democratic Claudia Rodriguez3,71310.87-0.17
Green Marija Minic2,2076.46+1.73
Family Coalition Marilyn Carvalho5681.66 
Total valid votes100.0
2003 Ontario general election
PartyCandidateVotes%±%
Liberal Monte Kwinter 18,80859.41-1.68
Progressive Conservative Dan Cullen7,86224.83-1.6
New Democratic Matthew Norrish3,49411.04+0.34
Green Constantine Kritsonis1,4964.73 
Total valid votes31,660100.0
1999 Ontario general election
PartyCandidateVotes%
Liberal Monte Kwinter 21,25061.09
Progressive Conservative Robert Hausman9,19226.43
New Democratic Norm Jesin3,72110.70
Natural Law Angus Hunt6211.79
Total valid votes34,784100.0

2007 electoral reform referendum

2007 Ontario electoral reform referendum
SideVotes%
First Past the Post19,22359.8
Mixed member proportional12,90740.2
Total valid votes32,130100.0

Historic election results

1987 boundaries

1995 Ontario general election
PartyCandidateVotes%±%
Progressive Conservative Al Palladini 37,89748.94+25.24
Liberal Mario Ferri29,15037.65-8.03
New Democratic T. S. Joseph Thevarkunnel6,6988.65-21.97
Family Coalition Giuseppi Gori1,8912.44 
Libertarian Robert Ede1,7922.31 
Total valid votes77,428100.0
Source:Elections Ontario [8]
1990 Ontario general election
PartyCandidateVotes%±%
Liberal Greg Sorbara 28,05645.57-16.05
New Democratic Laurie Orrent1885030.62+12.33
Progressive Conservative Don McGuire14,65623.81+3.73
Total valid votes61,562100.0
Source: The Toronto Daily Star [9] [nb 1]
1987 Ontario general election
PartyCandidateVotes%±%
Liberal Greg Sorbara 26,09662.44+28.61
Progressive Conservative Doug Mason8,60519.83-30.43
New Democratic Joe Licastro7,69217.73+6.24
Total valid votes43.393100.0
Source: The Toronto Daily Star [10] [nb 2]

1974 boundaries

1985 Ontario general election
PartyCandidateVotes%±%
Progressive Conservative Donald Cousens 29,65250.40+3.09
Liberal Ron Maheu19,48433.12-9.37
New Democratic Diane Meaghan7,08912.05+2.55
Independent Stewart Cole2,6074.43 
Total valid votes58,832100.0
Source:Ottawa Citizen [11]
1981 Ontario general election
PartyCandidateVotes%±%
Progressive Conservative Donald Cousens 18,36947.31+7.55
Liberal Alfred Stong 16,49542.49-1.92
New Democratic John Campey3,6899.50-6.33
Total valid votes38,823100.0
Source: The Windsor Star [12]
1977 Ontario general election
PartyCandidateVotes%±%
Liberal Alfred Stong 17,60844.41+3.69
Progressive Conservative Bill Corcoran15,76839.76+2.95
New Democratic Chris Olsen6,27715.83-6.16
Total valid votes39,653100.0
Source: Canadian Press [13]
1975 Ontario general election
PartyCandidateVotes%±%
Liberal Alfred Stong 14,34740.72-1.55
Progressive Conservative Tony Roman 12,96836.81-4.86
New Democratic Tony Snedker7,74821.99+5.93
Independent John White1710.49 
Total valid votes35,234100.0
Source: Canadian Press [14]

1966 boundaries

1971 Ontario general election
PartyCandidateVotes%±%
Liberal Donald Deacon 14,88542.27+1.66
Progressive Conservative Tony Roman 14,67441.67+5.06
New Democratic Roy Clifton5,65716.06-6.73
Total valid votes35,216100.0
Source: Canadian Press [15]
1967 Ontario general election
PartyCandidateVotes%±%
Liberal Donald Deacon 9,99140.61+4.04
Progressive Conservative Lorne Wells9,00636.61+4.72
New Democratic Jim Norton5,60622.79-8.12
Total valid votes24,603100.0
Source: Canadian Press [16]

1950s

1959 Ontario general election
PartyCandidateVotes%±%
Liberal Vernon Singer 15,70236.57+2.12
Progressive Conservative Thomas Graham 13,69531.89-5.82
Co-operative Commonwealth Fred Young13,27230.91+4.94
Independent George Rolland2700.63 
Total valid votes42,939100.0
Source: Canadian Press [17]
1955 Ontario general election
PartyCandidateVotes%
Progressive Conservative Thomas Graham 12,64837.71
Liberal Frederick Joseph McMahon 11,55334.45
Co-operative Commonwealth Fred Young 8,71025.97
Labor–Progressive Stephen Endicott6461.93
Total valid votes33,537100.0
Source: Canadian Press [18]

References

Notes

  1. 390 out of 391 polls reporting.
  2. 301 out of 308 polls reporting.

Citations

  1. For a listing of each MPP's Queen's Park curriculum vitae see below:
    • For Thomas Graham's Legislative Assembly information see "Michael Bryant, MPP". Parliamentary History. Toronto: Legislative Assembly of Ontario. 2014. Retrieved 2014-09-08.
    • For Vernon Singer's Legislative Assembly information see "Vernon Singer, MPP". Parliamentary History. Toronto: Legislative Assembly of Ontario. 2014. Retrieved 2014-09-08.
    • For Donald Deacon's Legislative Assembly information see "Donald Deacon, MPP". Parliamentary History. Toronto: Legislative Assembly of Ontario. 2014. Retrieved 2014-09-08.
    • For Alfred Stong's Legislative Assembly information see "Alfred Stong, MPP". Parliamentary History. Toronto: Legislative Assembly of Ontario. 2014. Retrieved 2014-09-08.
    • For Don Cousens's Legislative Assembly information see "W. Donald Cousens, MPP". Parliamentary History. Toronto: Legislative Assembly of Ontario. 2014. Retrieved 2014-09-08.
    • For Greg Sorbara's Legislative Assembly information see "Greg Sorbara, MPP". Parliamentary History. Toronto: Legislative Assembly of Ontario. 2014. Archived from the original on September 8, 2014. Retrieved 2014-09-08.
    • For Al Palladini's Legislative Assembly information see "Al Palladini, MPP". Parliamentary History. Toronto: Legislative Assembly of Ontario. 2014. Retrieved 2014-09-08.
    • For Monte Kwinter's Legislative Assembly information see "Monte Kwinter, MPP". Parliamentary History. Toronto: Legislative Assembly of Ontario. 2014. Retrieved 2014-09-08.
  2. "Candidates in: York Centre (120)". Elections Ontario . Retrieved 13 February 2025.
  3. "Vote Totals From Official Tabulation" (PDF). Elections Ontario. 3 March 2025. Retrieved 4 March 2025.
  4. "Summary of Valid Votes Cast for each Candidate" (PDF). Elections Ontario. p. 11. Retrieved 20 January 2019.
  5. "22 - Don Valley West".
  6. "General Election Results by District, 104 York Centre". Elections Ontario. 2014. Archived from the original on June 17, 2014. Retrieved 17 June 2014.
  7. "Official return from the records / Rapport des registres officiels - York Centre" (PDF). Elections Ontario. 2011. Retrieved 6 June 2014.
  8. "Summary of Valid Ballots by Candidate". Elections Ontario. 1995-06-08. Retrieved 2012-09-04.
  9. "How Metro-Area Voted". The Toronto Daily Star. Toronto. 1990-09-07. p. A10.
  10. "How Metro-Area Voted". The Toronto Daily Star. Toronto. 1987-09-11. p. A12.
  11. Canadian Press (1985-05-03). "The night the Tories tumbled; riding by riding results". Ottawa Citizen. Toronto. p. 43. Retrieved 2012-05-10.
  12. Canadian Press (1981-03-20). "Election results for Metro Toronto ridings". The Windsor Star. Windsor, Ontario. p. 22. Retrieved 2012-05-10.
  13. Canadian Press (1977-06-10). "How they voted in Metro area". The Toronto Daily Star. Toronto. p. A10.
  14. Canadian Press (1975-09-19). "Results from the 29 ridings in Metro". The Toronto Daily Star. Toronto. p. A18.
  15. Canadian Press (1971-10-22). "Here's who won on the Metro ridings". The Toronto Daily Star. Toronto. p. 12.
  16. Canadian Press (1967-10-18). "Tories win, but..." The Windsor Star. Windsor, Ontario. p. B2. Retrieved 2012-04-30.
  17. Canadian Press (1959-06-12). "Complete Results of Ontario Voting by Constituencies". The Ottawa Citizen. Ottawa. p. 26. Retrieved 2012-04-22.
  18. Canadian Press (1955-06-10). "Complete Results of Ontario Voting by Constituencies". The Ottawa Citizen. Ottawa. p. 4. Retrieved 2012-04-22.
North: Thornhill
West: Humber River—Black Creek York CentreEast: Willowdale
South: Eglinton—Lawrence, York South—Weston

43°45′46″N79°26′44″W / 43.7627°N 79.4456°W / 43.7627; -79.4456