This article needs additional citations for verification .(April 2018) |
| |||||||||||||||||||||||||||||||||||||||||||||||||
125 seats in the 30th Legislative Assembly of Ontario 63 seats were needed for a majority | |||||||||||||||||||||||||||||||||||||||||||||||||
---|---|---|---|---|---|---|---|---|---|---|---|---|---|---|---|---|---|---|---|---|---|---|---|---|---|---|---|---|---|---|---|---|---|---|---|---|---|---|---|---|---|---|---|---|---|---|---|---|---|
| |||||||||||||||||||||||||||||||||||||||||||||||||
|
The 1975 Ontario general election was held on September 18, 1975, to elect the 125 members of the 30th Legislative Assembly of Ontario (Members of Provincial Parliament, or "MPPs") of the Province of Ontario, Canada.
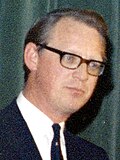
The Ontario Progressive Conservative Party, led by Bill Davis and campaigning under the slogan, "Your Future. Your choice.", won a tenth consecutive term in office but lost its majority in the legislature for the first time since the 1945 election. The PC party lost 27 seats from its result in the previous election.
The social democratic Ontario New Democratic Party, led by Stephen Lewis with the slogan "Tomorrow starts today", doubled its representation in the legislature, and became the Official Opposition on the strength of a campaign which called for rent control in Ontario and highlighted horror stories of individuals victimized by bad landlords who imposed exorbitant rent increases. The campaign forced Davis' Tories to promise to implement rent controls shortly before the election.
The Ontario Liberal Party, led by Robert Nixon, won 16 additional seats, but lost the role of Official Opposition to the NDP. One member of its caucus was elected as a Liberal-Labour candidate.
An Act passed in May 1975 [1] provided for an increase from 117 to 125 MPPs in the next Assembly:
Abolished ridings | New ridings |
---|---|
Drawn from parts of other ridings | |
Reorganization of ridings | |
Division of ridings | |
Renaming of ridings | |
Consequential renaming of ridings on the creation of the Regional Municipality of Durham | |
Candidates | PC | Lib | LL | NDP | Comm | Ind | Ltn | SC | NAL | Total |
---|---|---|---|---|---|---|---|---|---|---|
3 | 66 | 64 | 2 | 66 | 198 | |||||
4 | 41 | 41 | 41 | 19 | 5 | 9 | 6 | 2 | 164 | |
5 | 15 | 15 | 15 | 11 | 7 | 6 | 5 | 1 | 75 | |
6 | 2 | 2 | 2 | 2 | 3 | 1 | 12 | |||
7 | 1 | 1 | 1 | 1 | 2 | 1 | 7 | |||
Total | 125 | 123 | 2 | 125 | 33 | 17 | 15 | 13 | 3 | 456 |
Among the independent candidates, there were 12 from the Social Credit League of Ontario who were not officially recognized as such as the party did not qualify for official party status under the Election Finances Reform Act, 1975. [3] [4] [5] [6]
Polling firm | Last day of survey | Source | PCO | ONDP | OLP | Other | ME | Sample |
---|---|---|---|---|---|---|---|---|
Election 1975 | September 18, 1975 | 36.07 | 28.94 | 34.04 | 0.95 | |||
— | March 1975 | [7] | 30 | — | 42 | — | — | |
Election 1971 | June 9, 1977 | 44.5 | 27.1 | 27.8 | 0.6 |
Political party | Party leader | MPPs | Votes | |||||||
---|---|---|---|---|---|---|---|---|---|---|
Candidates | 1971 | 1975 | ± | # | ± | % | ± (pp) | |||
Progressive Conservative | Bill Davis | 125 | 78 | 51 | 27 | 1,192,592 | 272,721 | 36.07% | 8.43 | |
New Democratic | Stephen Lewis | 125 | 19 | 38 | 19 | 956,904 | 63,025 | 28.94% | 1.79 | |
Liberal | Robert Nixon | 123 | 20 | 35 | 15 | 1,125,615 | 211,873 | 34.04% | 6.29 | |
Liberal–Labour | 2 | – | 1 | 1 | 9,066 | 9,066 | 0.27% | Returned | ||
Communist | William Stewart | 33 | – | – | – | 9,120 | 7,500 | 0.28% | 0.23 | |
Libertarian | Terry Coughlin | 15 | – | – | – | 4,437 | 4,437 | 0.13% | New | |
Social Credit | Alcide Hamelin | 13 | – | – | – | 4,146 | 2,942 | 0.13% | 0.09 | |
Independent | 17 | – | – | – | 4,093 | 12,866 | 0.12% | 0.40 | ||
North American Labour | 3 | – | – | – | 424 | 424 | 0.01% | New | ||
Total | 456 | 117 | 125 | 3,306,397 | 100.00% | |||||
Rejected ballots | 17,937 | 122 | ||||||||
Voter turnout | 3,310,776 | 13,558 | 67.82 | 5.71 | ||||||
Registered electors | 4,503,142 | 398,635 |
Party | Seats | Votes | Change (pp) | ||
---|---|---|---|---|---|
█ Progressive Conservative | 51 / 125 | 36.07% | -8.43 | ||
█ New Democratic | 38 / 125 | 28.94% | 1.79 | ||
█ Liberal/Liberal-Labour | 36 / 125 | 34.31% | 6.56 | ||
█ Independent | 0 / 125 | 0.12% | -0.40 | ||
█ Other | 0 / 125 | 0.56% | 0.48 |
Riding | Winning party | Turnout [a 1] | Votes | ||||||||||||
---|---|---|---|---|---|---|---|---|---|---|---|---|---|---|---|
Name [a 2] | 1971 | Party | Votes | Share | Margin # | Margin % | PC | Lib/LL | NDP | Ind | Other | Total | |||
Algoma | PC | NDP | 4,923 | 38.57% | 398 | 3.12% | 72.02% | 4,525 | 3,315 | 4,923 | – | – | 12,763 | ||
Algoma—Manitoulin | PC | PC | 5,452 | 40.79% | 1,127 | 8.43% | 72.28% | 5,452 | 3,589 | 4,325 | – | – | 13,366 | ||
Brampton | New | PC | 16,432 | 43.66% | 5,608 | 14.90% | 72.11% | 16,432 | 9,906 | 10,824 | 65 | 410 | 37,637 | ||
Brantford | PC | NDP | 12,012 | 39.06% | 2,450 | 7.97% | 72.65% | 9,063 | 9,562 | 12,012 | – | 115 | 30,752 | ||
Brant—Oxford—Norfolk | Lib | Lib | 14,358 | 55.52% | 7,934 | 30.68% | 69.71% | 6,424 | 14,358 | 4,721 | – | 358 | 25,861 | ||
Brock | New | PC | 10,978 | 48.31% | 5,067 | 22.30% | 65.69% | 10,978 | 5,911 | 5,836 | – | – | 22,725 | ||
Burlington South | New | PC | 17,093 | 45.83% | 5,751 | 15.42% | 69.50% | 17,093 | 11,342 | 8,859 | – | – | 37,294 | ||
Cambridge | New | NDP | 11,255 | 38.14% | 1,593 | 5.40% | 66.96% | 8,595 | 9,662 | 11,255 | – | – | 29,512 | ||
Carleton | PC | PC | 12,653 | 38.87% | 676 | 2.08% | 68.68% | 12,653 | 11,977 | 7,769 | 157 | – | 32,556 | ||
Carleton East | PC | NDP | 11,982 | 36.02% | 281 | 0.84% | 66.58% | 9,579 | 11,701 | 11,982 | – | – | 33,262 | ||
Carleton-Grenville | New | PC | 12,759 | 53.80% | 7,027 | 29.63% | 68.88% | 12,759 | 5,226 | 5,732 | – | – | 23,717 | ||
Chatham—Kent | PC | PC | 10,146 | 43.73% | 2,819 | 12.15% | 61.68% | 10,146 | 7,327 | 5,728 | – | – | 23,201 | ||
Cochrane North | PC | PC | 9,987 | 61.74% | 6,220 | 38.45% | 66.45% | 9,987 | 2,423 | 3,767 | – | – | 16,177 | ||
Cochrane South | NDP | NDP | 11,073 | 47.87% | 1,292 | 5.59% | 68.42% | 9,781 | 1,958 | 11,073 | 114 | 205 | 23,131 | ||
Cornwall | New | NDP | 11,958 | 51.05% | 2,682 | 11.45% | 70.41% | 9,276 | 2,191 | 11,958 | – | – | 23,425 | ||
Dufferin—Simcoe | PC | PC | 14,201 | 45.88% | 1,691 | 5.46% | 68.52% | 14,201 | 12,510 | 3,585 | – | 655 | 30,951 | ||
Durham East | PC | NDP | 12,893 | 42.26% | 2,229 | 7.31% | 70.16% | 10,664 | 6,696 | 12,893 | – | 258 | 30,511 | ||
Durham North | PC | PC | 11,206 | 39.28% | 111 | 0.39% | 74.12% | 11,206 | 11,095 | 6,230 | – | – | 28,531 | ||
Durham West | PC | NDP | 11,356 | 38.99% | 1,314 | 4.51% | 72.71% | 7,579 | 10,042 | 11,356 | – | 149 | 29,126 | ||
Elgin | PC | PC | 11,880 | 43.98% | 1,829 | 6.77% | 71.27% | 11,880 | 10,051 | 5,084 | – | – | 27,015 | ||
Erie | Lib | Lib | 9,556 | 45.27% | 2,650 | 12.55% | 69.35% | 4,646 | 9,556 | 6,906 | – | – | 21,108 | ||
Essex North | Lib | Lib | 9,550 | 44.05% | 1,872 | 8.64% | 67.73% | 4,451 | 9,550 | 7,678 | – | – | 21,679 | ||
Essex South | Lib | Lib | 9,517 | 41.34% | 2,122 | 9.22% | 67.05% | 7,395 | 9,517 | 6,108 | – | – | 23,020 | ||
Fort William | PC | NDP | 9,173 | 36.59% | 953 | 3.80% | 64.61% | 8,220 | 7,444 | 9,173 | – | 230 | 25,067 | ||
Frontenac—Addington | PC | Lib | 10,372 | 44.63% | 1,415 | 6.09% | 70.78% | 8,957 | 10,372 | 3,368 | 545 | – | 23,242 | ||
Grey | PC | Lib | 11,686 | 45.02% | 277 | 1.07% | 73.81% | 11,409 | 11,686 | 2,863 | – | – | 25,958 | ||
Grey—Bruce | Lib | Lib | 14,193 | 55.39% | 5,964 | 23.28% | 75.71% | 8,229 | 14,193 | 3,202 | – | – | 25,624 | ||
Haldimand—Norfolk | PC | Lib | 13,976 | 45.36% | 1,955 | 6.35% | 71.99% | 12,021 | 13,976 | 4,814 | – | – | 30,811 | ||
Halton—Burlington | New | Lib | 10,998 | 39.14% | 463 | 1.65% | 72.75% | 10,535 | 10,998 | 6,567 | – | – | 28,100 | ||
Hamilton Centre | NDP | NDP | 8,114 | 38.43% | 586 | 2.78% | 56.70% | 5,256 | 7,528 | 8,114 | – | 214 | 21,112 | ||
Hamilton East | NDP | NDP | 14,415 | 47.89% | 5,736 | 19.06% | 64.10% | 6,407 | 8,679 | 14,415 | – | 601 | 30,102 | ||
Hamilton Mountain | PC | PC | 12,769 | 38.80% | 1,727 | 5.25% | 72.64% | 12,769 | 8,921 | 11,042 | – | 177 | 32,909 | ||
Hamilton West | PC | Lib | 10,583 | 38.34% | 542 | 1.96% | 66.04% | 10,041 | 10,583 | 6,978 | – | – | 27,602 | ||
Hastings—Peterborough | PC | PC | 10,912 | 47.89% | 2,341 | 10.27% | 71.01% | 10,912 | 8,571 | 2,969 | – | 335 | 22,787 | ||
Huron—Bruce | Lib | Lib | 16,276 | 65.70% | 10,393 | 41.95% | 73.52% | 5,883 | 16,276 | 2,613 | – | – | 24,772 | ||
Huron—Middlesex | New | Lib | 11,893 | 54.04% | 3,795 | 17.24% | 76.12% | 8,098 | 11,893 | 2,018 | – | – | 22,009 | ||
Kenora | PC | PC | 9,584 | 52.42% | 4,060 | 22.21% | 67.40% | 9,584 | 3,174 | 5,524 | – | – | 18,282 | ||
Kent—Elgin | Lib | Lib | 12,793 | 56.57% | 5,232 | 23.13% | 70.31% | 7,561 | 12,793 | 2,262 | – | – | 22,616 | ||
Kingston and the Islands | PC | PC | 9,442 | 37.82% | 203 | 0.81% | 65.01% | 9,442 | 9,239 | 6,161 | – | 124 | 24,966 | ||
Kitchener | Lib | Lib | 13,036 | 44.83% | 4,710 | 16.20% | 63.50% | 8,326 | 13,036 | 7,327 | – | 392 | 29,081 | ||
Kitchener—Wilmot | New | Lib | 9,929 | 40.71% | 1,745 | 7.16% | 64.38% | 6,275 | 9,929 | 8,184 | – | – | 24,388 | ||
Lake Nipigon | NDP | NDP | 7,114 | 59.38% | 4,014 | 33.51% | 66.78% | 1,766 | 3,100 | 7,114 | – | – | 11,980 | ||
Lambton | PC | PC | 11,042 | 51.53% | 1,836 | 8.57% | 73.00% | 11,042 | 9,206 | 1,180 | – | – | 21,428 | ||
Lanark | PC | PC | 11,641 | 56.58% | 5,799 | 28.18% | 72.17% | 11,641 | 5,842 | 3,092 | – | – | 20,575 | ||
Leeds | PC | PC | 13,913 | 58.21% | 8,197 | 34.29% | 70.69% | 13,913 | 4,274 | 5,716 | – | – | 23,903 | ||
Lincoln | PC | Lib | 8,995 | 42.84% | 1,094 | 5.21% | 69.87% | 7,901 | 8,995 | 4,100 | – | – | 20,996 | ||
London Centre | New | Lib | 11,572 | 40.37% | 2,569 | 8.96% | 61.12% | 9,003 | 11,572 | 7,878 | 213 | – | 28,666 | ||
London North | PC | Lib | 13,689 | 44.65% | 2,282 | 7.44% | 66.71% | 11,407 | 13,689 | 5,560 | – | – | 30,656 | ||
London South | PC | Lib | 14,496 | 40.94% | 559 | 1.58% | 64.25% | 13,937 | 14,496 | 6,971 | – | – | 35,404 | ||
Middlesex | New | PC | 10,092 | 44.97% | 869 | 3.87% | 72.34% | 10,092 | 9,223 | 3,125 | – | – | 22,440 | ||
Mississauga East | New | PC | 9,973 | 39.05% | 1,335 | 5.23% | 64.95% | 9,973 | 8,638 | 6,499 | 432 | – | 25,542 | ||
Mississauga North | New | PC | 11,001 | 35.55% | 385 | 1.24% | 67.33% | 11,001 | 9,332 | 10,616 | – | – | 30,949 | ||
Mississauga South | New | PC | 11,870 | 43.04% | 3,144 | 11.40% | 69.04% | 11,870 | 8,726 | 6,981 | – | – | 27,577 | ||
Muskoka | PC | PC | 7,061 | 43.97% | 1,376 | 8.57% | 68.73% | 7,061 | 3,200 | 5,685 | – | 111 | 16,057 | ||
Niagara Falls | PC | Lib | 10,594 | 37.80% | 172 | 0.61% | 65.02% | 10,422 | 10,594 | 7,013 | – | – | 28,029 | ||
Nickel Belt | NDP | NDP | 10,243 | 60.09% | 6,209 | 36.42% | 72.60% | 4,034 | 2,770 | 10,243 | – | – | 17,047 | ||
Nipissing | Lib | Lib | 15,483 | 54.35% | 8,244 | 28.94% | 69.44% | 7,239 | 15,483 | 5,110 | 658 | – | 28,490 | ||
Northumberland | PC | PC | 13,328 | 44.58% | 3,001 | 10.04% | 72.44% | 13,328 | 10,327 | 6,241 | – | – | 29,896 | ||
Oakville | New | PC | 12,933 | 45.84% | 3,759 | 13.32% | 74.29% | 12,933 | 9,174 | 6,011 | – | 97 | 28,215 | ||
Oshawa | PC | NDP | 14,638 | 58.94% | 7,787 | 31.35% | 63.27% | 6,851 | 3,202 | 14,638 | – | 146 | 24,837 | ||
Ottawa Centre | NDP | NDP | 11,658 | 41.07% | 2,680 | 9.44% | 62.19% | 8,978 | 7,500 | 11,658 | – | 250 | 28,386 | ||
Ottawa East | Lib | Lib | 14,900 | 60.96% | 9,899 | 40.50% | 53.08% | 5,001 | 14,900 | 4,543 | – | – | 24,444 | ||
Ottawa South | PC | PC | 14,767 | 43.15% | 3,668 | 10.72% | 67.88% | 14,767 | 8,360 | 11,099 | – | – | 34,226 | ||
Ottawa West | PC | PC | 14,889 | 44.34% | 5,063 | 15.08% | 66.10% | 14,889 | 9,826 | 8,861 | – | – | 33,576 | ||
Oxford | PC | PC | 17,776 | 50.72% | 5,181 | 14.78% | 71.77% | 17,776 | 12,595 | 4,676 | – | – | 35,047 | ||
Parry Sound | PC | PC | 8,154 | 44.56% | 966 | 5.28% | 66.77% | 8,154 | 7,188 | 2,957 | – | – | 18,299 | ||
Perth | Lib | Lib | 17,865 | 63.36% | 10,478 | 37.16% | 65.17% | 7,387 | 17,865 | 2,945 | – | – | 28,197 | ||
Peterborough | PC | NDP | 16,154 | 39.53% | 505 | 1.24% | 71.23% | 15,649 | 8,979 | 16,154 | – | 83 | 40,865 | ||
Port Arthur | NDP | NDP | 12,213 | 49.74% | 4,618 | 18.81% | 66.36% | 7,595 | 4,499 | 12,213 | – | 247 | 24,554 | ||
Prescott and Russell | PC | PC | 11,006 | 43.93% | 2,045 | 8.16% | 68.85% | 11,006 | 8,961 | 5,085 | – | – | 25,052 | ||
Prince Edward—Lennox | PC | PC | 9,628 | 44.32% | 733 | 3.37% | 74.37% | 9,628 | 8,895 | 3,200 | – | – | 21,723 | ||
Quinte | PC | Lib | 12,440 | 43.07% | 659 | 2.28% | 67.95% | 11,781 | 12,440 | 4,663 | – | – | 28,884 | ||
Rainy River | Lib | LL | 5,892 | 51.58% | 2,657 | 23.26% | 64.77% | 3,235 | 5,892 [a 3] | 2,295 | – | – | 11,422 | ||
Renfrew North | PC | Lib | 7,058 | 35.41% | 183 | 0.92% | 70.90% | 6,875 | 7,058 | 6,001 | – | – | 19,934 | ||
Renfrew South | PC | PC | 13,886 | 54.20% | 5,819 | 22.71% | 75.49% | 13,886 | 8,067 | 3,267 | – | 401 | 25,621 | ||
St. Catharines | PC | PC | 10,064 | 34.74% | 794 | 2.74% | 59.77% | 10,064 | 9,270 | 9,215 | – | 419 | 28,968 | ||
Sarnia | Lib | Lib | 16,275 | 57.69% | 7,502 | 26.59% | 63.97% | 8,773 | 16,275 | 2,957 | – | 204 | 28,209 | ||
Sault Ste. Marie | PC | PC | 14,415 | 42.46% | 945 | 2.78% | 70.91% | 14,415 | 5,835 | 13,470 | – | 232 | 33,952 | ||
Simcoe Centre | PC | PC | 13,557 | 39.52% | 1,929 | 5.62% | 69.48% | 13,557 | 9,116 | 11,628 | – | – | 34,301 | ||
Simcoe East | PC | PC | 11,622 | 39.48% | 1,140 | 3.87% | 69.35% | 11,622 | 7,334 | 10,482 | – | – | 29,438 | ||
Stormont—Dundas—Glengarry | New | PC | 10,833 | 52.54% | 3,851 | 18.68% | 68.99% | 10,833 | 6,982 | 2,804 | – | – | 20,619 | ||
Sudbury | NDP | NDP | 12,258 | 38.35% | 2,278 | 7.13% | 74.53% | 9,549 | 9,980 | 12,258 | – | 175 | 31,962 | ||
Sudbury East | NDP | NDP | 18,765 | 58.84% | 9,476 | 29.71% | 74.04% | 3,837 | 9,289 | 18,765 | – | – | 31,891 | ||
Temiskaming | PC | NDP | 8,713 | 44.07% | 1,544 | 7.81% | 68.53% | 7,169 | 3,546 | 8,713 | 175 | 170 | 19,773 | ||
Victoria—Haliburton | PC | Lib | 10,907 | 43.53% | 1,023 | 4.08% | 70.64% | 9,884 | 10,907 | 3,707 | – | 556 | 25,054 | ||
Waterloo North | Lib | Lib | 12,409 | 47.49% | 5,265 | 20.15% | 64.40% | 7,144 | 12,409 | 6,576 | – | – | 26,129 | ||
Welland | PC | NDP | 9,994 | 36.88% | 1,115 | 4.11% | 71.26% | 8,879 | 8,000 | 9,994 | – | 223 | 27,096 | ||
Wellington—Dufferin—Peel | PC | PC | 12,110 | 40.61% | 712 | 2.39% | 69.50% | 12,110 | 11,398 | 6,313 | – | – | 29,821 | ||
Wellington South | Lib | Lib | 15,654 | 50.69% | 7,886 | 25.54% | 68.36% | 7,063 | 15,654 | 7,768 | 252 | 145 | 30,882 | ||
Wentworth | NDP | NDP | 14,847 | 58.73% | 9,577 | 37.89% | 68.32% | 5,270 | 5,162 | 14,847 | – | – | 25,279 | ||
Wentworth North | PC | Lib | 13,242 | 40.56% | 1,977 | 6.06% | 72.56% | 11,265 | 13,242 | 8,140 | – | – | 32,647 | ||
Windsor—Riverside | NDP | NDP | 13,273 | 47.85% | 2,479 | 8.94% | 61.67% | 3,671 | 10,794 | 13,273 | – | – | 27,738 | ||
Windsor—Sandwich | NDP | NDP | 10,624 | 49.73% | 3,067 | 14.36% | 58.25% | 2,732 | 7,557 | 10,624 | 265 | 184 | 21,362 | ||
Windsor—Walkerville | Lib | Lib | 12,517 | 53.28% | 5,672 | 24.14% | 63.52% | 3,979 | 12,517 | 6,845 | – | 153 | 23,494 | ||
York Centre | Lib | Lib | 14,913 | 40.96% | 1,830 | 5.03% | 69.10% | 13,083 | 14,913 | 8,140 | – | 275 | 36,411 | ||
York North | PC | PC | 12,891 | 39.65% | 2,525 | 7.77% | 68.40% | 12,891 | 10,366 | 9,256 | – | – | 32,513 | ||
Armourdale | PC | Lib | 14,526 | 43.90% | 2,702 | 8.17% | 68.91% | 11,824 | 14,526 | 6,169 | – | 567 | 33,086 | ||
Beaches—Woodbine | PC | NDP | 11,462 | 45.58% | 2,886 | 11.48% | 66.65% | 8,576 | 4,914 | 11,462 | – | 195 | 25,147 | ||
Bellwoods | PC | NDP | 4,935 | 38.38% | 494 | 3.84% | 64.90% | 3,234 | 4,441 | 4,935 | – | 247 | 12,857 | ||
Don Mills | PC | PC | 14,007 | 46.59% | 5,933 | 19.74% | 60.68% | 14,007 | 7,981 | 8,074 | – | – | 30,062 | ||
Dovercourt | PC | NDP | 6,083 | 42.10% | 1,465 | 10.14% | 63.87% | 4,618 | 3,174 | 6,083 | 96 | 477 | 14,448 | ||
Downsview | Lib | NDP | 8,091 | 36.90% | 68 | 0.31% | 65.70% | 5,814 | 8,023 | 8,091 | – | – | 21,928 | ||
Eglinton | PC | PC | 16,679 | 50.97% | 5,894 | 18.01% | 68.94% | 16,679 | 10,785 | 4,706 | – | 551 | 32,721 | ||
Etobicoke | Lib | NDP | 9,016 | 37.62% | 1,256 | 5.24% | 67.04% | 7,191 | 7,760 | 9,016 | – | – | 23,967 | ||
High Park—Swansea | NDP | NDP | 10,172 | 39.84% | 1,844 | 7.22% | 68.77% | 8,328 | 6,540 | 10,172 | – | 493 | 25,533 | ||
Humber | PC | PC | 17,739 | 44.51% | 3,337 | 8.37% | 71.58% | 17,739 | 14,402 | 7,710 | – | – | 39,851 | ||
Lakeshore | NDP | NDP | 14,271 | 51.01% | 7,625 | 27.26% | 65.74% | 6,281 | 6,646 | 14,271 | 175 | 602 | 27,975 | ||
Oakwood | New | NDP | 7,388 | 39.25% | 1,418 | 7.53% | 59.66% | 4,637 | 5,970 | 7,388 | 558 | 271 | 18,824 | ||
Oriole | New | PC | 12,297 | 38.71% | 239 | 0.75% | 68.00% | 12,297 | 12,058 | 7,413 | – | – | 31,768 | ||
Parkdale | NDP | NDP | 7,158 | 41.71% | 1,559 | 9.08% | 63.23% | 3,816 | 5,599 | 7,158 | 292 | 298 | 17,163 | ||
Riverdale | NDP | NDP | 9,133 | 50.27% | 4,268 | 23.49% | 59.48% | 4,865 | 3,754 | 9,133 | 96 | 319 | 18,167 | ||
St. Andrew—St. Patrick | PC | PC | 8,054 | 36.66% | 429 | 1.95% | 62.57% | 8,054 | 5,951 | 7,625 | – | 339 | 21,969 | ||
St. David | PC | PC | 10,536 | 40.27% | 2,493 | 9.53% | 66.43% | 10,536 | 7,141 | 8,043 | – | 442 | 26,162 | ||
St. George | PC | Lib | 11,042 | 42.10% | 2,465 | 9.40% | 60.70% | 8,577 | 11,042 | 6,029 | – | 582 | 26,230 | ||
Scarborough Centre | PC | PC | 10,399 | 41.15% | 1,037 | 4.10% | 64.13% | 10,399 | 5,042 | 9,362 | – | 469 | 25,272 | ||
Scarborough East | PC | PC | 12,645 | 42.59% | 3,836 | 12.92% | 66.94% | 12,645 | 8,809 | 7,850 | – | 383 | 29,687 | ||
Scarborough—Ellesmere | New | NDP | 10,573 | 39.00% | 1,347 | 4.97% | 67.73% | 9,226 | 7,019 | 10,573 | – | 295 | 27,113 | ||
Scarborough North | PC | PC | 16,512 | 43.41% | 2,677 | 7.04% | 70.03% | 16,512 | 13,835 | 7,241 | – | 447 | 38,035 | ||
Scarborough West | NDP | NDP | 15,815 | 57.39% | 8,603 | 31.22% | 70.20% | 7,212 | 4,393 | 15,815 | – | 135 | 27,555 | ||
Wilson Heights | New | Lib | 11,379 | 42.26% | 2,640 | 9.81% | 61.95% | 8,739 | 11,379 | 6,441 | – | 366 | 26,925 | ||
York East | PC | PC | 14,487 | 47.42% | 5,496 | 17.99% | 66.05% | 14,487 | 8,991 | 5,919 | – | 1,152 | 30,549 | ||
York Mills | PC | PC | 17,365 | 46.46% | 4,075 | 10.90% | 70.81% | 17,365 | 13,290 | 6,720 | – | – | 37,375 | ||
York South | NDP | NDP | 13,282 | 48.47% | 6,218 | 22.69% | 67.30% | 7,064 | 6,445 | 13,282 | – | 609 | 27,400 | ||
York West | PC | PC | 13,871 | 38.70% | 1,356 | 3.78% | 71.33% | 13,871 | 12,515 | 9,454 | – | – | 35,840 | ||
Yorkview | NDP | NDP | 13,406 | 52.40% | 5,320 | 20.79% | 63.02% | 3,498 | 8,086 | 13,406 | – | 594 | 25,584 |
Party in 1st place | Party in 2nd place | Total | |||
---|---|---|---|---|---|
PC | Lib | NDP | |||
Progressive Conservative | 17 | 34 | 51 | ||
New Democratic | 20 | 18 | 38 | ||
Liberal | 30 | 5 | 35 | ||
Liberal–Labour | 1 | 1 | |||
Total | 51 | 22 | 52 | 125 |
Parties | 1st | 2nd | 3rd | 4th | 5th |
---|---|---|---|---|---|
█ Progressive Conservative | 51 | 51 | 23 | ||
█ New Democratic | 38 | 22 | 65 | ||
█ Liberal | 35 | 52 | 36 | ||
█ Liberal–Labour | 1 | 1 | |||
█ Communist | 26 | 7 | |||
█ Libertarian | 12 | 3 | |||
█ Social Credit | 10 | 2 | |||
█ Independent | 9 | 5 | |||
█ North American Labour | 2 | 1 |
Source | Party | |||||
---|---|---|---|---|---|---|
PC | NDP | Lib | LL | Total | ||
Seats retained | Incumbents returned | 34 | 15 | 14 | 63 | |
Open seats held | 5 | 4 | 2 | 11 | ||
Held by previous incumbent from other riding | 1 | 1 | ||||
Incumbent changed to Liberal-Labour | 1 | 1 | ||||
Seats changing hands | Incumbents defeated | 9 | 7 | 16 | ||
Open seats gained | 5 | 6 | 11 | |||
Byelection gain held | 1 | 1 | ||||
Ouster of third-party byelection gain | 1 | 1 | ||||
New ridings | New MPPs | 3 | 3 | 3 | 9 | |
Previously incumbent in other riding | 8 | 1 | 2 | 11 | ||
Total | 51 | 38 | 35 | 1 | 125 |
Party designations are as follows:
|
|
|
The Ontario New Democratic Party is a social democratic political party in Ontario, Canada. The party currently forms the Official Opposition in Ontario following the 2018 general election. It is a provincial section of the federal New Democratic Party. It was formed in October 1961 from the Co-operative Commonwealth Federation and the Ontario Federation of Labour (OFL).
Alvin Curling is a Jamaican-born Canadian politician. He was Canada's envoy to the Dominican Republic from 2005 to 2006. A former politician in Ontario, Canada, he was Speaker of the Legislative Assembly of Ontario until he resigned on August 19, 2005 to accept his diplomatic appointment. He had been a Liberal MPP for twenty years, from 1985 to 2005.
The Communist Party of Canada (Ontario) (French: Parti communiste du Canada (Ontario)) is the Ontario provincial wing of the Communist Party of Canada. Using the name Labor-Progressive Party from 1943 until 1959, the group won two seats in the Legislative Assembly of Ontario: A.A. MacLeod and J.B. Salsberg were elected in the 1943 provincial election as "Labour" candidates but took their seats as members of the Labor-Progressive Party, which the banned Communist Party launched as its public face in a convention held on August 21 and 22, 1943, shortly after both the August 4 provincial election and the August 7 election of Communist Fred Rose to the House of Commons in a Montreal by-election.
Robert Fletcher Nixon is a retired Canadian politician in the province of Ontario, Canada. The son of former Premier of Ontario Harry Nixon, he was first elected to the Legislative Assembly of Ontario in a 1962 by-election following his father's death. The younger Nixon was elected leader of the Ontario Liberal Party in 1967 and led them through three provincial elections, the first two where the Liberals retained their standing as the second-largest party and official opposition in the legislature.
The 2007 Ontario general election was held on October 10, 2007, to elect members (MPPs) of the 39th Legislative Assembly of the Province of Ontario, Canada. The Liberals under Premier Dalton McGuinty won the election with a majority government, winning 71 out of a possible 107 seats with 42.2% of the popular vote. The election saw the third-lowest voter turnout in Ontario provincial elections, setting a then record for the lowest voter turnout with 52.8% of people who were eligible voted. This broke the previous record of 54.7% in the 1923 election, but would end up being surpassed in the 2011 and 2022 elections.
The 1995 Ontario general election was held on June 8, 1995, to elect members of the 36th Legislative Assembly of the province of Ontario, Canada. The writs for the election were dropped on April 28, 1995.
The 1990 Ontario general election was held on September 6, 1990, to elect members of the 35th Legislative Assembly of the province of Ontario, Canada. The governing Ontario Liberal Party led by Premier David Peterson was unexpectedly defeated. Although the Peterson government, and Peterson himself, were very popular, he was accused of opportunism in calling an election just three years into his mandate. In a shocking upset, the New Democratic Party (NDP), led by Bob Rae, won a majority government. This marked the first time the NDP had won government east of Manitoba, and to date the only time the NDP formed the government in Ontario.
Dennis Roy Timbrell is a politician in Ontario, Canada. He was a member of Provincial Parliament (MPP) from 1971 to 1987, and was a Cabinet minister in the Progressive Conservative governments of Bill Davis and Frank Miller.
Gerry Phillips is a former politician in Ontario, Canada. He was a Liberal member of the Legislative Assembly of Ontario who represented the eastern Toronto riding of Scarborough—Agincourt from 1987 to 2011. He served as a cabinet minister in the governments of David Peterson and Dalton McGuinty.
Tony Ruprecht is a former Canadian politician. His first elected position was as an alderman in the old Toronto City Council, in the late 1970s. He became a member of the Legislative Assembly of Ontario in 1981, and served in premier David Peterson's cabinet as minister without portfolio from 1985 to 1987. Ruprecht represented Toronto's Parkdale and then Davenport constituencies for the Liberal Party of Ontario for 30 years. On 5 July 2011, he announced that he was leaving politics and would not seek re-election in the October 2011 provincial election.
Sean Conway is a former provincial politician in Ontario, Canada and a university professor. He served for 28 years as a Liberal member of the Legislative Assembly of Ontario from 1975 to 2003 and was a high-profile cabinet minister in the government of David Peterson.
Melville Carlyle "Bud" Germa was a Canadian politician, who represented the electoral district of Sudbury from 1967 to 1968 in the House of Commons of Canada, and from 1971 to 1981 in the Legislative Assembly of Ontario. He was a member of the New Democratic Party.
The 1977 Ontario general election was held on June 9, 1977, to elect the 125 members of the 31st Legislative Assembly of Ontario.
The 1963 Ontario general election was held on September 25, 1963, to elect the 108 members of the 27th Legislative Assembly of Ontario of the Province of Ontario.
The 1967 Ontario general election was held on October 17, 1967, to elect the 117 members of the 28th Legislative Assembly of Ontario of the Province of Ontario, Canada.
David William Warner is a former politician in Ontario, Canada. He was a New Democratic Party member of the Legislative Assembly of Ontario on three occasions between 1975 and 1995, and served as Speaker of the Assembly during Bob Rae's administration.
The 38th Legislative Assembly of Ontario was a legislature of the government of the Province of Ontario, Canada. It officially opened November 19, 2003, at Queen's Park in Toronto, and ended on June 5, 2007. The membership was set by the 2003 Ontario general election on October 2, 2003, and it changed only somewhat due to resignations and by-elections.
The 39th Legislative Assembly of Ontario was a legislature of the government of the Province of Ontario, Canada. It officially opened November 29, 2007, and ended on June 1, 2011. The membership was set by the 2007 Ontario general election on October 10, 2007.
The 1999 Ontario general election was held on June 3, 1999, to elect members of the 37th Legislative Assembly of the Canadian province Ontario.
The 41st Legislative Assembly of Ontario was a legislature of the government of the province of Ontario, Canada. The membership was set by the 2014 Ontario general election. The 41st parliament of Ontario was dissolved on May 8, 2018.