![]() | ||||||||||||||||||||||||||||
| ||||||||||||||||||||||||||||
94 seats in the 9th Legislative Assembly of Ontario 48 seats were needed for a majority | ||||||||||||||||||||||||||||
---|---|---|---|---|---|---|---|---|---|---|---|---|---|---|---|---|---|---|---|---|---|---|---|---|---|---|---|---|
| ||||||||||||||||||||||||||||
|
The 1898 Ontario general election was the ninth general election held in the province of Ontario, Canada. It was held on March 1, 1898, to elect the 94 Members of the 9th Legislative Assembly of Ontario ("MLAs"). [1]
The Ontario Liberal Party, led by Arthur S. Hardy, won an eighth term in office with a clear majority – the Patrons of Industry and the Protestant Protective Association held no sway in this legislature.
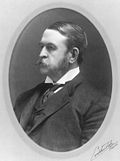
The Ontario Conservative Party, led by Sir James P. Whitney, formed the official opposition.
Ottawa had two seats, and plurality block voting was used. Elsewhere the first-past-the-post election system was used.
Political party | Party leader | MPPs | Votes | |||||||
---|---|---|---|---|---|---|---|---|---|---|
Candidates | 1894 | Dissol. | 1898 | ± | # | % | ± (pp) | |||
Liberal | Arthur S. Hardy | 91 | 45 | 51 | 6![]() | 202,332 | 47.29% | 6.30![]() | ||
Conservative | James P. Whitney | 90 | 23 | 42 | 19![]() | 204,011 | 47.69% | 19.88![]() | ||
Independent-Conservative | 1 | – | 1 | 1![]() | 1,740 | 0.41% | New | |||
Liberal-Patrons | – | 12 | – | 12![]() | Did not campaign | |||||
Conservative–P.P.A. | – | 5 | – | 5![]() | ||||||
Patrons of Industry | Joseph Longford Haycock | – | 3 | – | 3![]() | |||||
Conservative-Patrons | – | 2 | – | 2![]() | ||||||
Liberal-P.P.A. | – | 2 | – | 2![]() | ||||||
Protestant Protective Association | – | 1 | – | 1![]() | ||||||
Independent-Conservative-PPA | – | 1 | – | 1![]() | ||||||
Independent | 18 | – | – | – | 19,683 | 4.60% | 2.10![]() | |||
Labour | 1 | – | – | – | 57 | 0.01% | New | |||
Vacant | ||||||||||
Total | 201 | 94 | 94 | 94 | 427,823 | 100.00% | ||||
Blank and invalid ballots | 3,601 | |||||||||
Registered voters / turnout | 525,795 | 82.05% | 11.75![]() |
Party | Seats | Votes | Change (pp) | |||
---|---|---|---|---|---|---|
Liberal [a 1] | 51 / 94 | 6.30 | ||||
Conservative [a 1] | 42 / 94 | 19.88 | ||||
Patrons of Industry | 0 / 94 | -17.61 | ||||
Protestant Protective Association [a 2] | 0 / 94 | -11.09 | ||||
Other | 1 / 94 | 2.52 |
Riding [a 1] | Winning party | Turnout | Votes | ||||||||||||
---|---|---|---|---|---|---|---|---|---|---|---|---|---|---|---|
Name [a 2] | 1894 | Party | Votes | Share | Margin # | Margin % | Lib | Con | I-Con | Lab | Ind | Total | |||
Addington | Con | Con | 1,901 | 54.30% | 301 | 8.60% | 74.61% | 1,600 | 1,901 | – | – | – | 3,501 | ||
Algoma East | Lib | Lib | 2,833 | 52.55% | 275 | 5.10% | 45.93% | 2,833 | 2,558 | – | – | – | 5,391 | ||
Algoma West | Con | Lib | 1,723 | 54.61% | 291 | 9.22% | 51.55% | 1,723 | 1,432 | – | – | – | 3,155 | ||
Brant North | Lib | Lib | 1,167 | 52.28% | 102 | 4.57% | 83.53% | 1,167 | 1,065 | – | – | – | 2,232 | ||
Brant South | Lib | Lib | 3,038 | 54.75% | 527 | 9.50% | 84.72% | 3,038 | 2,511 | – | – | – | 5,549 | ||
Brockville | Lib | Lib | 2,232 | 52.20% | 188 | 4.40% | 78.96% | 2,232 | 2,044 | – | – | – | 4,276 | ||
Bruce Centre | L-PI | Lib | 1,850 | 53.38% | 234 | 6.75% | 68.35% | 1,850 | – | – | – | 1,616 | 3,466 | ||
Bruce North | L-PP | Lib | 2,464 | 52.84% | 265 | 5.68% | 82.09% | 2,464 | 2,199 | – | – | – | 4,663 | ||
Bruce South | Lib | Lib | acclaimed | ||||||||||||
Cardwell | C-PI | Con | 2,267 | 55.63% | 459 | 11.26% | 70.72% | 1,808 | 2,267 | – | – | – | 4,075 | ||
Carleton | C-PI | I-Con | 1,740 | 63.64% | 746 | 27.29% | 55.38% | 994 | – | 1,740 | – | – | 2,734 | ||
Dufferin | PI | Con | 2,660 | 55.99% | 569 | 11.98% | 65.78% | – | 2,660 | – | – | 2,091 | 4,751 | ||
Dundas | Con | Con | 2,354 | 51.37% | 126 | 2.75% | 86.40% | 2,228 | 2,354 | – | – | – | 4,582 | ||
Durham East | Con | Con | 1,949 | 54.26% | 306 | 8.52% | 77.55% | 1,643 | 1,949 | – | – | – | 3,592 | ||
Durham West | C-PP | Con | 1,825 | 51.69% | 119 | 3.37% | 90.22% | 1,706 | 1,825 | – | – | – | 3,531 | ||
Elgin East | Con | Con | 2,267 | 50.32% | 29 | 0.64% | 82.75% | 2,238 | 2,267 | – | – | – | 4,505 | ||
Elgin West | L-PI | Con | 3,101 | 50.01% | 1 | 0.02% | 78.62% | 3,100 | 3,101 | – | – | – | 6,201 | ||
Essex North | Lib | Lib | 2,683 | 50.15% | 95 | 1.78% | 64.37% | 2,683 | 2,588 | – | – | 79 | 5,350 | ||
Essex South | Lib | Lib | 3,138 | 56.05% | 677 | 12.09% | 84.07% | 3,138 | 2,461 | – | – | – | 5,599 | ||
Frontenac | L-PI | Con | 1,936 | 53.73% | 269 | 7.47% | 75.44% | – | 1,936 | – | – | 1,667 | 3,603 | ||
Glengarry | L-PI | Con | 1,905 | 47.35% | 466 | 11.58% | 73.81% | 679 | 1,905 | – | – | 1,439 | 4,023 | ||
Grenville | Con | Con | 2,361 | 57.43% | 611 | 14.86% | 68.35% | 1,750 | 2,361 | – | – | – | 4,111 | ||
Grey Centre | PPA | Con | 2,813 | 58.58% | 1,091 | 22.72% | 73.97% | 1,722 | 2,813 | – | – | 267 | 4,802 | ||
Grey North | Lib | Con | 2,707 | 51.30% | 137 | 2.60% | 76.33% | 2,570 | 2,707 | – | – | – | 5,277 | ||
Grey South | PI | Con | 2,249 | 47.35% | 532 | 11.20% | 75.47% | 1,717 | 2,249 | – | – | 784 | 4,750 | ||
Haldimand | Con | Lib | 1,957 | 51.34% | 102 | 2.68% | 85.14% | 1,957 | 1,855 | – | – | – | 3,812 | ||
Halton | Con | Lib | 2,531 | 51.25% | 123 | 2.49% | 84.73% | 2,531 | 2,408 | – | – | – | 4,939 | ||
Hamilton East | Lib | Con | 3,247 | 57.84% | 880 | 15.68% | 82.88% | 2,367 | 3,247 | – | – | – | 5,614 | ||
Hamilton West | Lib | Con | 2,752 | 52.66% | 278 | 5.32% | 82.51% | 2,474 | 2,752 | – | – | – | 5,226 | ||
Hastings East | L-PI | Lib | 2,011 | 51.64% | 128 | 3.29% | 83.94% | 2,011 | 1,883 | – | – | – | 3,894 | ||
Hastings North | PI | Con | 2,374 | 52.80% | 252 | 5.60% | 99.91% | 2,122 | 2,374 | – | – | – | 4,496 | ||
Hastings West | Lib | Con | 1,985 | 52.67% | 201 | 5.33% | 67.44% | 1,784 | 1,985 | – | – | – | 3,769 | ||
Huron East | Lib | Lib | 2,417 | 55.74% | 498 | 11.49% | 74.69% | 2,417 | 1,919 | – | – | – | 4,336 | ||
Huron South | Lib | Con | 2,775 | 51.47% | 159 | 2.95% | 86.14% | 2,616 | 2,775 | – | – | – | 5,391 | ||
Huron West | Lib | Lib | 2,465 | 50.01% | 1 | 0.02% | 73.71% | 2,465 | 2,464 | – | – | – | 4,929 | ||
Kent East | Lib | Lib | 2,869 | 55.32% | 552 | 10.64% | 68.47% | 2,869 | 2,317 | – | – | – | 5,186 | ||
Kent West | L-PI | Lib | 3,689 | 51.99% | 283 | 3.99% | 78.63% | 3,689 | 3,406 | – | – | – | 7,095 | ||
Kingston | Con | Lib | 2,125 | 53.66% | 290 | 7.32% | 84.35% | 2,125 | 1,835 | – | – | – | 3,960 | ||
Lambton East | IC-PP | Lib | 2,361 | 49.21% | 40 | 0.83% | 78.40% | 2,361 | 116 | – | – | 2,321 | 4,798 | ||
Lambton West | C-PP | Lib | 3,600 | 53.73% | 500 | 7.46% | 68.13% | 3,600 | 3,100 | – | – | – | 6,700 | ||
Lanark North | Con | Lib | 1,989 | 52.38% | 181 | 4.77% | 82.92% | 1,989 | 1,808 | – | – | – | 3,797 | ||
Lanark South | Con | Con | 2,195 | 61.09% | 797 | 22.18% | 67.71% | 1,398 | 2,195 | – | – | – | 3,593 | ||
Leeds | Con | Con | 2,200 | 55.81% | 458 | 11.62% | 67.37% | 1,742 | 2,200 | – | – | – | 3,942 | ||
Lennox | Con | Lib | 1,677 | 50.65% | 43 | 1.30% | 78.74% | 1,677 | 1,634 | – | – | – | 3,311 | ||
Lincoln | Con | Con | 2,974 | 53.15% | 353 | 6.31% | 83.14% | – | 5,595 | – | – | – | 5,595 | ||
London | Con | Lib | 3,994 | 50.75% | 301 | 3.82% | 85.94% | 3,994 | 3,693 | – | 57 | 126 | 7,870 | ||
Middlesex East | L-PP | Con | 2,463 | 50.98% | 95 | 1.97% | 77.57% | 2,368 | 2,463 | – | – | – | 4,831 | ||
Middlesex North | L-PI | Lib | 2,195 | 51.07% | 92 | 2.14% | 79.80% | 2,195 | 2,103 | – | – | – | 4,298 | ||
Middlesex West | Lib | Lib | 2,262 | 51.73% | 151 | 3.45% | 84.79% | 2,262 | 2,111 | – | – | – | 4,373 | ||
Monck | Lib | Lib | 1,985 | 54.50% | 328 | 9.01% | 84.46% | 1,985 | 1,657 | – | – | – | 3,642 | ||
Muskoka | C-PP | Lib | 1,938 | 50.97% | 74 | 1.95% | 70.35% | 1,938 | 1,864 | – | – | – | 3,802 | ||
Nipissing | Lib | Lib | 1,590 | 50.98% | 61 | 1.96% | 97.47% | 1,590 | 1,529 | – | – | – | 3,119 | ||
Norfolk North | Lib | Lib | 1,885 | 53.55% | 250 | 7.10% | 81.09% | 1,885 | 1,635 | – | – | – | 3,520 | ||
Norfolk South | Lib | Lib | 1,723 | 50.50% | 34 | 1.00% | 84.02% | 1,723 | 1,689 | – | – | – | 3,412 | ||
Northumberland East | Con | Lib | 2,814 | 53.95% | 412 | 7.90% | 83.44% | 2,814 | 2,402 | – | – | – | 5,216 | ||
Northumberland West | Lib | Lib | 1,654 | 52.11% | 134 | 4.22% | 84.95% | 1,654 | 1,520 | – | – | – | 3,174 | ||
Ontario North | Lib | Con | 2,326 | 55.11% | 431 | 10.21% | 95.93% | 1,895 | 2,326 | – | – | – | 4,221 | ||
Ontario South | Lib | Con | 2,781 | 50.88% | 96 | 1.76% | 97.89% | 2,685 | 2,781 | – | – | – | 5,466 | ||
Oxford North | Lib | Lib | 2,838 | 53.99% | 1,023 | 19.46% | 76.32% | 2,838 | 604 | – | – | 1,815 | 5,257 | ||
Oxford South | Lib | Lib | 2,343 | 58.40% | 674 | 16.80% | 62.53% | 2,343 | 1,669 | – | – | – | 4,012 | ||
Parry Sound | L-PI | Lib | 2,332 | 65.52% | 1,105 | 31.05% | 90.05% | 2,332 | – | – | – | 1,227 | 3,559 | ||
Peel | Lib | Lib | 2,343 | 53.32% | 292 | 6.65% | 81.10% | 2,343 | 2,051 | – | – | – | 4,394 | ||
Perth North | Con | Lib | 3,396 | 51.21% | 160 | 2.41% | 87.03% | 3,396 | 3,236 | – | – | – | 6,632 | ||
Perth South | L-PI | Lib | 2,357 | 49.12% | 4 | 0.08% | 82.08% | 2,357 | 2,353 | – | – | 88 | 4,798 | ||
Peterborough East | Lib | Lib | 1,771 | 53.25% | 216 | 6.49% | 70.55% | 1,771 | 1,555 | – | – | – | 3,326 | ||
Peterborough West | Lib | Lib | 2,742 | 61.14% | 999 | 22.27% | 82.06% | 2,742 | 1,743 | – | – | – | 4,485 | ||
Prescott | Lib | Lib | acclaimed | ||||||||||||
Prince Edward | L-PI | Con | 2,387 | 53.96% | 357 | 8.07% | 78.17% | 7 | 2,387 | – | – | 2,030 | 4,424 | ||
Renfrew North | Lib | Con | 2,321 | 51.70% | 153 | 3.41% | 82.63% | 2,168 | 2,321 | – | – | – | 4,489 | ||
Renfrew South | Lib | Lib | 2,455 | 55.21% | 1,441 | 32.40% | 72.25% | 2,455 | 978 | – | – | 1,014 | 4,447 | ||
Russell | Lib | Lib | 2,738 | 58.26% | 776 | 16.51% | 70.52% | 2,738 | 1,962 | – | – | – | 4,700 | ||
Simcoe Centre | Lib | Con | 1,761 | 43.65% | 57 | 1.41% | 77.32% | 1,704 | 1,761 | – | – | 569 | 4,034 | ||
Simcoe East | Con | Con | 2,593 | 50.67% | 69 | 1.35% | 99.96% | 2,524 | 2,593 | – | – | – | 5,117 | ||
Simcoe West | L-PI | Con | 2,015 | 56.05% | 435 | 12.10% | 65.83% | 1,580 | 2,015 | – | – | – | 3,595 | ||
Stormont | L-PI | Con | 2,125 | 43.16% | 182 | 3.70% | 71.01% | 1,943 | 2,125 | – | – | 855 | 4,923 | ||
Toronto East | C-PP | Con | 3,103 | 67.78% | 1,628 | 35.56% | 67.37% | 1,475 | 3,103 | – | – | – | 4,578 | ||
Toronto North | Con | Con | 3,513 | 50.24% | 34 | 0.49% | 97.76% | 3,479 | 3,513 | – | – | – | 6,992 | ||
Toronto South | Con | Con | 4,464 | 52.38% | 405 | 4.75% | 67.83% | 4,059 | 4,464 | – | – | – | 8,523 | ||
Toronto West | Con | Con | 3,698 | 55.73% | 760 | 11.45% | 95.31% | 2,938 | 3,698 | – | – | – | 6,636 | ||
Victoria East | Con | Con | 2,289 | 55.29% | 438 | 10.58% | 69.88% | 1,851 | 2,289 | – | – | – | 4,140 | ||
Victoria West | Lib | Con | 2,163 | 50.82% | 70 | 1.64% | 74.02% | 2,093 | 2,163 | – | – | – | 4,256 | ||
Waterloo North | Lib | Con | 2,701 | 50.61% | 65 | 1.22% | 75.18% | 2,636 | 2,701 | – | – | – | 5,337 | ||
Waterloo South | Lib | Con | 2,532 | 51.10% | 109 | 2.20% | 75.81% | 2,423 | 2,532 | – | – | – | 4,955 | ||
Welland | Lib | Lib | 3,125 | 56.11% | 681 | 12.23% | 92.26% | 3,125 | 2,444 | – | – | – | 5,569 | ||
Wellington East | Lib | Lib | 1,476 | 36.85% | 188 | 4.69% | 75.97% | 1,476 | 1,241 | – | – | 1,288 | 4,005 | ||
Wellington South | Lib | Lib | 2,341 | 49.88% | 396 | 8.44% | 90.53% | 2,341 | 1,945 | – | – | 407 | 4,693 | ||
Wellington West | C-PP | Con | 1,912 | 53.18% | 229 | 6.37% | 76.73% | 1,683 | 1,912 | – | – | – | 3,595 | ||
Wentworth North | Lib | Con | 1,700 | 55.43% | 333 | 10.86% | 79.58% | 1,367 | 1,700 | – | – | – | 3,067 | ||
Wentworth South | Lib | Lib | 1,649 | 52.78% | 174 | 5.57% | 83.62% | 1,649 | 1,475 | – | – | – | 3,124 | ||
York East | Lib | Lib | 2,091 | 55.63% | 423 | 11.25% | 69.47% | 2,091 | 1,668 | – | – | – | 3,759 | ||
York North | Lib | Lib | 2,543 | 55.08% | 469 | 10.16% | 80.61% | 2,543 | 2,074 | – | – | – | 4,617 | ||
York West | Con | Lib | 2,465 | 50.36% | 35 | 0.72% | 83.12% | 2,465 | 2,430 | – | – | – | 4,895 |
Political party | Candidate | Votes | % | Elected | Incumbent | |
---|---|---|---|---|---|---|
Liberal | Alexander Lumsden | 4,793 | 26.86 | ![]() | ||
Conservative | Charles Berkeley Powell | 4,548 | 25.49 | ![]() | ||
Liberal | George O. O'Keefe | 4,539 | 25.44 | ![]() | ![]() | |
Conservative | B. Slattery | 3,964 | 22.21 | |||
Majority [a 1] | 9 | 0.05 |
Party in 1st place | Party in 2nd place | Total | ||||
---|---|---|---|---|---|---|
Accl | Lib | Con | Ind | |||
Liberal | 2 | 42 | 6 | 50 | ||
Conservative | 36 | 1 | 4 | 41 | ||
Independent Conservative | 1 | 1 | ||||
Total | 2 | 37 | 43 | 10 | 92 |
Parties | Accl | 1st | 2nd | 3rd | 4th |
---|---|---|---|---|---|
█ Liberal | 2 | 49 | 37 | 3 | |
█ Conservative | 41 | 44 | 4 | 1 | |
█ Independent Conservative | 1 | ||||
█ Independent | 10 | 8 | |||
█ Labour | 1 |
Source | Party | ||||
---|---|---|---|---|---|
Lib | Con | I-Con | Total | ||
Seats retained | Incumbents returned | 22 | 10 | 32 | |
Returned by acclamation | 2 | 2 | |||
Open seats held | 6 | 3 | 9 | ||
Seats changing hands | Incumbents defeated | 10 | 15 | 25 | |
Open seats gained | 5 | 10 | 15 | ||
Byelection gains held | 2 | 1 | 3 | ||
Incumbent changed allegiance | 3 | 2 | 1 | 6 | |
Ottawa seats | New MLAs | 1 | 1 | ||
Total | 51 | 42 | 1 | 94 |
Party designations are as follows:
Northern Ontario Ottawa Valley Saint Lawrence Valley Central Ontario | Georgian Bay Wentworth/Halton/Niagara Midwestern Ontario | Southwestern Ontario Peel/York/Ontario |
Party | 1894 | Gain from (loss to) | 1898 | ||||||||||||||||||||
---|---|---|---|---|---|---|---|---|---|---|---|---|---|---|---|---|---|---|---|---|---|---|---|
Lib | Con | Ind-C | Lib-P | C-PPA | POI | Con-P | L-PPA | PPA | ICP | ||||||||||||||
Liberal | 45 | 10 | (14) | 6 | 2 | 1 | 1 | 51 | |||||||||||||||
Conservative | 23 | 14 | (10) | 6 | 3 | 3 | 1 | 1 | 1 | 42 | |||||||||||||
Independent-Conservative | – | 1 | 1 | ||||||||||||||||||||
Liberal-Patrons | 12 | (6) | (6) | – | |||||||||||||||||||
Conservative–P.P.A. | 5 | (2) | (3) | – | |||||||||||||||||||
Patrons of Industry | 3 | (3) | – | ||||||||||||||||||||
Conservative-Patrons | 2 | (1) | (1) | – | |||||||||||||||||||
Liberal-P.P.A. | 2 | (1) | (1) | – | |||||||||||||||||||
Protestant Protective Association | 1 | (1) | – | ||||||||||||||||||||
Independent-Conservative-PPA | 1 | (1) | – | ||||||||||||||||||||
Total | 94 | 14 | (20) | 10 | (29) | – | (1) | 12 | – | 5 | – | 3 | – | 2 | – | 2 | – | 1 | – | 1 | – | 94 |
There were 50 seats that changed allegiance in the election:
Conservative to Liberal
Liberal/Patrons of Industry to Liberal Conservative/PPA to Liberal Liberal/PPA to Liberal Independent-Conservative/PPA to Liberal | Liberal to Conservative
Liberal/Patrons of Industry to Conservative Conservative/PPA to Conservative Patrons of Industry to Conservative Conservative/Patrons of Industry to Conservative Liberal/PPA to Conservative PPA to Conservative Conservative/Patrons of Industry to Independent-Conservative |
Six members changed their principal affiliation from the previous election:
Riding | MLA | 1894 | 1898 |
---|---|---|---|
Kent West | Thomas Letson Pardo | █ Patrons of Industry | █ Liberal |
Middlesex North | William Henry Taylor | █ Patrons of Industry | █ Liberal |
Parry Sound | William Rabb Beatty | █ Patrons of Industry | █ Liberal |
Durham West | William Henry Reid | █ Protestant Protective Association | █ Conservative |
Cardwell | Edward Alfred Little | █ Patrons of Industry | █ Conservative |
Carleton | George Nelson Kidd | █ Patrons of Industry | █ Independent-Conservative |