Niagara Falls (provincial electoral district)

Last updated
Niagara Falls
Flag of Ontario.svg Ontario electoral district
Niagara Falls, riding.png
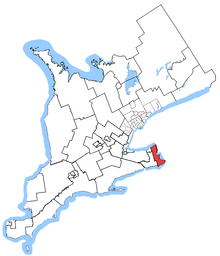
Niagara Falls in relation to southern Ontario ridings
Provincial electoral district
Legislature Legislative Assembly of Ontario
MPP


Wayne Gates
New Democratic
District created1914
First contested 1914
Last contested 2025
Demographics
Population (2016)136,290
Electors (2018)110,035
Area (km²)680
Pop. density (per km²)200.4
Census division(s) Niagara
Census subdivision(s) Niagara Falls, Fort Erie, Niagara-on-the-Lake

Niagara Falls is a provincial electoral division in Ontario, Canada. It was created prior to the 1914 provincial election, and has existed continuously since then.

Contents

Its boundaries were significantly redrawn in 1999, when Ontario adjusted all of its provincial electoral divisions to match those at the federal level.

List of representatives

Niagara Falls
AssemblyYearsMemberParty
Riding created
14th  1914–1919   George Musgrove Conservative
15th  1919–1923   Charles Swayze Labour
16th  1923–1926   William Gore Willson Conservative
17th  1926–1929
18th  1929–1934
19th  1934–1937   William Houck Liberal
20th  1937–1943
21st  1943–1945   Cyril Overall Co-operative Commonwealth
22nd  1945–1948   Carl Hanniwell Progressive Conservative
23rd  1948–1951   William Houck Liberal
24th  1951–1953
 1951–1953   Arthur Jolley Progressive Conservative
25th  1955–1959
26th  1959–1963   George Bukator Liberal
27th  1963–1967
28th  1967–1971
29th  1971–1975   John Clement Progressive Conservative
30th  1975–1977   Vince Kerrio Liberal
31st  1977–1981
32nd  1981–1985
33rd  1985–1987
34th  1987–1990
35th  1990–1995   Margaret Harrington New Democratic
36th  1995–1999   Bart Maves Progressive Conservative
37th  1999–2003
38th  2003–2007   Kim Craitor Liberal
39th  2007–2011
40th  2011–2013
 2014–2014   Wayne Gates New Democratic
41st  2014–2018
42nd  2018–2022
43rd  2022–2025
44th  2025–present

Election results

2025 Ontario general election
** Preliminary results — Not yet official **
PartyCandidateVotes%±%Expenditures
New Democratic Wayne Gates 29,54955.0+6.9
Progressive Conservative Ruth-Ann Nieuwesteeg18,56934.5–1.9
Liberal Shafoli Kapur3,3986.3–2.1
New Blue Gary Dumelie8701.6–1.2
Green Celia Taylor8371.6–1.1
Ontario Party Andrew Soifert2850.5–0.8
Independent Joedy Burdett2630.5N/A
Total valid votes/expense limit
Total rejected, unmarked, and declined ballots
Turnout44.9+1.3
Eligible voters119,693
New Democratic hold Swing +4.4
Source: Elections Ontario [1]
2022 Ontario general election
PartyCandidateVotes%±%
New Democratic Wayne Gates 24,20748.082.71
Progressive Conservative Bob Gale18,34236.43+0.86
Liberal Ashley Waters4,2398.420.93
New Blue Christine Lewis-Napolitano1,4092.80 
Green Tommy Ward1,3562.690.77
Ontario Party Wesley Kavanagh6561.30 
None of the Above Devon St. Denis-Richard1350.27 
Total valid votes50,344100.0  
Total rejected, unmarked, and declined ballots309
Turnout50,65343.60
Eligible voters115,083
New Democratic hold Swing 1.78
Source(s)
  • "Summary of Valid Votes Cast for Each Candidate" (PDF). Elections Ontario. 2022. Archived from the original on 2023-05-18.
  • "Statistical Summary by Electoral District" (PDF). Elections Ontario. 2022. Archived from the original on 2023-05-21.
2018 Ontario general election
PartyCandidateVotes%±%
New Democratic Wayne Gates 30,16150.79+3.40
Progressive Conservative Chuck McShane21,12635.58+2.76
Liberal Dean Demizio5,5549.95−5.06
Green Karen Fraser2,0573.46+0.03
Libertarian Shaun Somers3140.53−0.54
Moderate Goran Zubic1690.28
Total valid votes59,381100.0  
New Democratic hold Swing
Source: Elections Ontario [2]
2014 Ontario general election
PartyCandidateVotes%±%
New Democratic Wayne Gates24,13147.39+7.84
Progressive Conservative Bart Maves 16,70232.80-3.96
Liberal Lionel Tupman7,32914.39-5.00
Green Clarke Bitter1,7243.39+0.65
Libertarian Ralph Panucci5591.10+0.67
None of the Above John Ringo Beam4780.94
Total valid votes50,923100.0  
Total rejected, unmarked and declined ballots6401.26
Turnout51,56351.21
Eligible voters100,698
New Democratic hold Swing +5.90
Source: Elections Ontario [3]
Ontario provincial by-election, February 13, 2014
Resignation of Kim Craitor
PartyCandidateVotes%±%
New Democratic Wayne Gates14,58939.54+13.24
Progressive Conservative Bart Maves13,56436.76+1.93
Liberal Joyce Morocco7,14419.36-16.53
Green Clarke Bitter1,0112.74+1.12
Independent Tim Tredwell2260.61+0.24
Libertarian Stefanos Karatopis1590.43-0.03
People's Political Party Troy Young1070.29
Freedom Andrew Brannan1010.27
Total valid votes 36,901 100.00
Total rejected, unmarked and declined ballots3240.87
Turnout37,22537.59
Eligible voters99,024
New Democratic gain from Liberal Swing +5.66
Source: Elections Ontario [4]
2011 Ontario general election
PartyCandidateVotes%±%
Liberal Kim Craitor 16,79435.89-11.62
Progressive Conservative George Lepp16,29634.83+3.61
New Democratic Wayne Redekop12,30426.30+16.46
Green Byrne Smith7591.62-9.81
Libertarian Adam Hyde2170.46 
Family Coalition John Jankovic1910.41 
Independent Jeannette Tossounian1190.25 
Independent Tim Tredwell1120.24 
Total valid votes46,792100.00
Total rejected, unmarked and declined ballots3080.65
Turnout47,10049.44
Eligible voters95,266
Liberal hold Swing -7.62
Source: Elections Ontario [5]
2007 Ontario general election
PartyCandidateVotes%±%
Liberal Kim Craitor22,21047.53+0.64
Progressive Conservative Bart Maves14,54031.12-6.86
Green Melanie Mullen5,37311.50+8.61
New Democratic Mike Piché4,6059.85-2.50
Total rejected, unmarked and declined ballots3810.82
Turnout47,10951.08
Eligible voters92,225
Total valid votes 46,728 100.00
2003 Ontario general election
PartyCandidateVotes%±%
Liberal Kim Craitor18,90446.86+4.66
Progressive Conservative Bart Maves15,35338.06-7.64
New Democratic Claude Sonier4,96212.30+2.45
Green Ryan McLaughlin1,1242.79+2.05
Total valid votes 40,343 100.00
1999 Ontario general election
PartyCandidateVotes%±%Expenditures
Progressive Conservative Bart Maves 18,49745.70+2.37$57,730.70
Liberal Selina Volpatti17,08042.20+12.6$49,687.00
New Democratic Claude Sonier3,9859.85−15.27$14,873.79
Natural Law Bill Amos3170.78−0.49$0.00
Green Clara Tarnoy3000.74 not listed
Independent Darren Wood2980.74 $330.00
Total valid votes40,477 100.00
Rejected, unmarked and declined ballots335 0.82
Turnout40,812 59.39
Electors on the lists68,725
1995 Ontario general election
PartyCandidateVotes%±%Expenditures
Progressive Conservative Bart Maves 12,13243.33+30.4$37,908.69
Liberal Marg Germano8,28929.60+2.93$40,823.66
New Democratic Margaret Harrington 7,03425.12−21.12$15,733.37
Natural Law Bill Amos3551.27 $0.00
Independent Melania Gural1890.68 not listed
Total valid votes27,999 100.00
Rejected, unmarked and declined ballots388 1.37
Turnout28,387 59.48
Electors on the lists47,729
1990 Ontario general election
PartyCandidateVotes%
New Democratic Margaret Harrington 13,88446.24
Liberal Wayne Campbell7,97926.67
Progressive Conservative Norm Puttick3,86912.93
Confederation of Regions Ted Wiwchar3,14110.50
Family Coalition Art Klassen6742.25
Green Donald MacDonald-Ross3651.22
Total valid votes29,912 100.00

2007 electoral reform referendum

2007 Ontario electoral reform referendum
SideVotes%
First Past the Post29,25964.6
Mixed member proportional16,01335.4
Total valid votes45,272100.0

Sources

  1. "Niagara Falls Unofficial Election Results". Elections Ontario. 28 February 2025. Retrieved 28 February 2025.
  2. "Summary of Valid Votes Cast for each Candidate" (PDF). Elections Ontario. p. 7. Archived from the original (PDF) on 28 December 2018. Retrieved 20 January 2019.
  3. "General Election Results by District, 054 Niagara Falls". Elections Ontario. 2014. Archived from the original on 17 June 2014. Retrieved 17 June 2014.
  4. Elections Ontario (2014). "Official return from the records / Rapport des registres officiels - Niagara Falls by-election" (PDF). Archived from the original (PDF) on 6 June 2014. Retrieved 4 June 2014.
  5. Elections Ontario (2011). "Official report from the records / Rapport des registres officiels - Niagara Falls" (PDF). Retrieved 4 June 2014.[ permanent dead link ]

43°03′36″N79°07′41″W / 43.06°N 79.1281°W / 43.06; -79.1281