Niagara Falls (federal electoral district)

Last updated

Niagara Falls
Flag of Ontario.svg Ontario electoral district
Niagara Falls, riding.png
Niagara Falls in relation to southern Ontario ridings
Federal electoral district
Legislature House of Commons
MP


Tony Baldinelli
Conservative
District created1952
First contested 1953
Last contested 2021
District webpage profile, map
Demographics
Population (2011) [1] 128,357
Electors (2015)101,505
Area (km²) [2] 579
Pop. density (per km²)221.7
Census division(s) Niagara
Census subdivision(s) Niagara Falls, Fort Erie, Niagara-on-the-Lake

Niagara Falls is a federal electoral district in Ontario, Canada, that has been represented in the House of Commons of Canada since 1953.

Contents

It consists of the city of Niagara Falls and the towns of Niagara-on-the-Lake and Fort Erie.

Under the 2022 Canadian federal electoral redistribution the riding will be renamed Niagara Falls—Niagara-on-the-Lake. [3]

History

The riding was created in 1952 from parts of Erie—Lincoln and Welland ridings. It consisted initially of the townships of Stamford, Willoughby and Bertie, the city of Niagara Falls, and the towns of Fort Erie, Chippawa and Crystal Beach in the county of Welland. In 1966, the towns of Fort Erie, Chippawa and Crystal Beach and the township of Stamford were excluded from the riding.

In 1976, the riding was redefined to consist of the City of Niagara Falls and the Town of Niagara-on-the-Lake. In 1996, the riding was expanded to include the part of the City of Thorold lying east of the Welland Canal. In 2004 the western boundary of the riding was moved east from the Welland Canal to the Thorold town line, while the southern boundary was extended south to Lake Erie. This change excluded the town of Thorold and included all of the town of Fort Erie.

This riding was left unchanged during the 2012 electoral redistribution.

Demographics

According to the 2021 Canadian census [4]

Ethnic groups: 79.2% White, 4.6% South Asian, 3.9% Indigenous, 2.6% Black, 2.2% Chinese, 2.3% Filipino, 1.6% Latin American
Languages: 77.7% English, 2.6% Italian, 1.6% French, 1.4% Spanish, 1.1% Tagalog, 1.1% German, 1.0% Mandarin
Religions: 60.9% Christian (30.6% Catholic, 5.8% Anglican, 4.0% United Church, 2.0% Presbyterian, 2.0% Christian Orthodox, 1.5% Lutheran, 1.1% Baptist, 1.0% Pentecostal, 1.0% Anabaptist, 11.9% Other), 2.9% Muslim, 1.5% Hindu, 32.2% None.
Median income: $36,800 (2020)
Average income: $47,720 (2020)

Federal riding associations

Riding associations are the local branches of the national political parties:

PartyAssociation nameCEOHQ address HQ city
  Christian Heritage Party of Canada CHP Niagara FallsAndy Langendoen3562 Garner Road Niagara Falls
  Conservative Party of Canada Niagara Falls Conservative AssociationBarbara Ruth Greenwood4322 Kilman Place Niagara Falls
Green Niagara Falls Federal Green Party AssociationKathryn Waugh Niagara Falls
  Liberal Party of Canada Niagara Falls Federal Liberal AssociationCorinna Taylor Niagara Falls
  New Democratic Party Niagara Falls Federal NDP Riding Association Niagara Falls

Members of Parliament

This riding has elected the following members of Parliament:

ParliamentYearsMemberParty
Niagara Falls
Riding created from Erie—Lincoln and Welland
22nd  1953–1957   William Houck Liberal
23rd  1957–1958
24th  1958–1960
 1960–1962 Judy LaMarsh
25th  1962–1963
26th  1963–1965
27th  1965–1968
28th  1968–1972 Joe Greene
29th  1972–1974   Joe Hueglin Progressive Conservative
30th  1974–1979   Roger Young Liberal
31st  1979–1980   Jake Froese Progressive Conservative
32nd  1980–1984   Al MacBain Liberal
33rd  1984–1988   Rob Nicholson Progressive Conservative
34th  1988–1993
35th  1993–1997   Gary Pillitteri Liberal
36th  1997–2000
37th  2000–2004
38th  2004–2006   Rob Nicholson Conservative
39th  2006–2008
40th  2008–2011
41st  2011–2015
42nd  2015–2019
43rd  2019–2021 Tony Baldinelli
44th  2021–present

Election results

Graph of election results in Niagara Falls (parties that never received 2% of the vote are omitted)
2021 Canadian federal election
PartyCandidateVotes%±%Expenditures
Conservative Tony Baldinelli 26,81037.9+2.4$111,535.19
Liberal Andrea Kaiser23,65033.5+1.0$114,330.02
New Democratic Brian Barker12,87118.2+0.2$22,072.98
People's Peter Taras5,9488.4+7.0$43,091.46
Green Melanie Holm1,3701.9-3.0$1,799.97
Total valid votes70,64999.1
Total rejected ballots6460.9
Turnout71,29562.2
Eligible voters114,698
Conservative hold Swing +0.7
Source: Elections Canada [5]
2021 federal election redistributed results [6]
PartyVote %
  Conservative 20,17337.42
  Liberal 18,97235.19
  New Democratic 9,62517.85
  People's 4,0887.58
  Green 1,0501.95
2019 Canadian federal election
PartyCandidateVotes%±%Expenditures
Conservative Tony Baldinelli 24,75135.49-6.59$99,463.10
Liberal Andrea Kaiser22,69032.54-1.95$88,011.69
New Democratic Brian Barker12,56618.02-2.88$17,190.50
Independent Mike Strange 4,9977.17-none listed
Green Sandra O'Connor3,4044.88+2.36$7,271.20
People's Alexander Taylor9681.39-none listed
Christian Heritage Tricia O'Connor3580.51-none listed
Total valid votes/expense limit69,73499.10
Total rejected ballots6360.90+0.36
Turnout70,37062.15-0.84
Eligible voters113,232
Conservative hold Swing -2.32
Source: Elections Canada [7] [8]
2015 Canadian federal election
PartyCandidateVotes%±%Expenditures
Conservative Rob Nicholson 27,23542.09-11.17$154,867.12
Liberal Ron Planche22,31834.49+15.58$63,639.74
New Democratic Carolynn Ioannoni13,52520.90-2.59$31,267.04
Green Steven Soos1,6332.52-1.34$3,055.92
Total valid votes/Expense limit64,71199.46 $251,076.96
Total rejected ballots3530.54
Turnout65,06462.99
Eligible voters103,291
Conservative hold Swing -13.38
Source: Elections Canada [9] [10]
2011 Canadian federal election
PartyCandidateVotes%±%Expenditures
Conservative Rob Nicholson 28,74853.26+6.56
New Democratic Heather Kelley12,68123.49+5.63
Liberal Bev Hodgson10,20618.91-8.00
Green Shawn Willick2,0863.86-4.61
Christian Heritage Harold Jonker2590.5%+0.48
Total valid votes53,980100.00
Total rejected ballots 2640.49 -0.01
Turnout54,244 56.90+2.30
Eligible voters95,326
2008 Canadian federal election
PartyCandidateVotes%±%Expenditures
Conservative Rob Nicholson 24,01646.70%+6.3%$77,050
Liberal Joyce Morocco13,86726.96%-7.5%$89,565
New Democratic Eric Gillespie9,18617.86%-3.1%$18,513
Green Shawn Willick4,3568.47%+4.4%$7,974
Total valid votes/Expense limit51,42599.5%$94,533
Total rejected ballots2640.5%
Turnout51,68954.60%
2006 Canadian federal election
PartyCandidateVotes%±%
Conservative Rob Nicholson 23,48940.4%+1.7%
Liberal Gary Burroughs20,09934.5%-2.0%
New Democratic Wayne Gates 12,21421.0%+0.2%
Green Kay Green2,4024.1%+0.1%
Total valid votes58,204 100.0%
2004 Canadian federal election
PartyCandidateVotes%±%
Conservative Rob Nicholson 19,88238.7%-7.7%
Liberal Victor Pietrangelo18,74536.5%-9.4%
New Democratic Wayne Gates 10,68020.8%+14.7%
Green Ted Mousseau2,0714.0%+2.7%
Total valid votes51,378100.0%

Note: Conservative vote is compared to the total of the Canadian Alliance vote and Progressive Conservative vote in 2000 election.

2000 Canadian federal election
PartyCandidateVotes%±%
Liberal Gary Pillitteri 17,90745.9%+7.6%
Alliance Mel Grunstein11,99930.8%+4.2%
Progressive Conservative Tony Baldinelli 6,07715.6%-8.4%
New Democratic Ed Booker2,3566.0%-3.8%
Green Clara Tarnoy5011.3%+0.4%
Natural Law Bill Amos1550.4%0.0%
Total valid votes 38,995100.0%

Note: Canadian Alliance vote is compared to the Reform vote in 1997 election.

1997 Canadian federal election
PartyCandidateVotes%±%
Liberal Gary Pillitteri 15,86838.4%-8.7%
Reform Mel Grunstein10,98626.6%+1.6%
Progressive Conservative Rob Nicholson 9,93524.0%+1.7%
New Democratic John Cowan4,0529.8%+6.4%
Green Alexander Rados3740.9%+0.3%
Natural Law Bill Amos1540.4%0.0%
Total valid votes 41,369100.0%
1993 Canadian federal election
PartyCandidateVotes%±%
Liberal Gary Pillitteri 20,54247.1%+12.1%
Reform Mel Grunstein10,89025.0%
Progressive Conservative Rob Nicholson 9,71922.3%-17.2%
New Democratic Steve Leonard1,4703.4%-18.0%
National John Cowan5131.2%
Green John Bruce McBurney2580.6%
Natural Law Bill Amos1660.4%
Abolitionist Ted Wiwchar820.2%
Total valid votes43,640100.0%
1988 Canadian federal election
PartyCandidateVotes%±%
Progressive Conservative Rob Nicholson 17,07739.5%-15.6%
Liberal Gary Pillitteri 15,13735.0%+15.2%
New Democratic Dick Harrington9,23221.3%-2.4%
Christian Heritage Bill Andres 1,7134.0%
Commonwealth of Canada Jean-Claude Souvray970.2%
Total valid votes43,256 100.0%
1984 Canadian federal election
PartyCandidateVotes%±%
Progressive Conservative Rob Nicholson 22,85255.1%+18.2%
New Democratic Richard Harrington9,86323.8%+2.6%
Liberal Al MacBain 8,21919.8%-21.3%
Green Robert G. Scott3520.8%
Social Credit Earl G. Erb1770.4%-0.1%
Total valid votes 41,463100.0%
1980 Canadian federal election
PartyCandidateVotes%±%
Liberal Al MacBain 15,87141.1%+2.6%
Progressive Conservative Jake Froese14,25136.9%-5.0%
New Democratic John A. Dawson8,16721.2%+2.0%
Social Credit Bruce Arnold2210.6%
Marxist–Leninist David Wiwcharyk610.2%-0.2%
Total valid votes38,571 100.0%
1979 Canadian federal election
PartyCandidateVotes%±%
Progressive Conservative Jake Froese 16,91641.9%+10.3%
Liberal Roger Carl Young15,54538.5%-14.7%
New Democratic John Dawson7,75719.2%+4.7%
Marxist–Leninist David Wiwcharyk1350.3%
Total valid votes 40,353100.0%
1974 Canadian federal election
PartyCandidateVotes%±%
Liberal Roger Young 20,61853.3%14.5%
Progressive Conservative Joe Hueglin12,22531.6%-9.0%
New Democratic Pat Piccirillo5,60714.5%-5.4%
Social Credit George Olesevich2540.7%0.0%
Total valid votes38,704 100.0%
1972 Canadian federal election
PartyCandidateVotes%±%
Progressive Conservative Joe Hueglin 15,70140.6%+8.7%
Liberal Tom Jamieson14,97838.7%-12.0%
New Democratic Ray Wilson7,70519.9%+2.6%
Social Credit George Olesevich2700.7%
Total valid votes38,654 100.0%
1968 Canadian federal election
PartyCandidateVotes%±%
Liberal John James Greene 17,18350.7%-9.4%
Progressive Conservative Bob Rolls10,82532.0%+6.8%
New Democratic Ray Wilson5,86117.3%+6.0%
Total valid votes 33,869100.0%
1965 Canadian federal election
PartyCandidateVotes%±%
Liberal Judy LaMarsh 17,79460.1%+0.0%
Progressive Conservative Jean Douglas7,44225.1%-3.3%
New Democratic Ronald C. Seebach3,36111.4%-0.1%
Independent PCJohn G. Graaskamp6572.2%
Social Credit Arthur David Brooker3461.2%
Total valid votes29,600100.0%
1963 Canadian federal election
PartyCandidateVotes%±%
Liberal Judy LaMarsh 18,74960.2%+0.5%
Progressive Conservative Jean Douglas8,86328.4%+3.3%
New Democratic Bill Johnson3,55511.4%-0.6%
Total valid votes 31,167100.0%
1962 Canadian federal election
PartyCandidateVotes%±%
Liberal Judy LaMarsh 18,50059.7%+12.3%
Progressive Conservative Jean Douglas7,79525.2%-4.1%
New Democratic Bill Johnson3,71312.0%-11.4%
Social Credit Vito Antonio9853.2%
Total valid votes30,993 100.0%
Canadian federal by-election, 31 October 1960
On Mr. Houck's death (5 May 1960)
PartyCandidateVotes%±%
Liberal Judy LaMarsh 13,42847.3%+1.6%
Progressive Conservative Keith Lougheed8,30929.3%-14.8%
New Democratic Edward E. Mitchelson (as New Party)6,62723.4%+13.2%
Total valid votes28,364100.0%

Note: NDP vote is compared to CCF vote in 1958 election.

1958 Canadian federal election
PartyCandidateVotes%±%
Liberal William Houck 14,02545.8%-8.2%
Progressive Conservative Robert H. Hamilton13,50444.1%-2.0%
Co-operative Commonwealth Edward F. Twocock3,11510.2%
Total valid votes30,644100.0%
1957 Canadian federal election
PartyCandidateVotes%±%
Liberal William Houck 12,70654.0%-5.8%
Progressive Conservative Robert H. Hamilton10,84546.0%+18.1%
Total valid votes 23,551100.0%
1953 Canadian federal election
PartyCandidateVotes%
Liberal William Houck 13,40059.7%
Progressive Conservative Winnifred Margaret Stokes6,26427.9%
Co-operative Commonwealth Joseph Bacon2,60511.6%
Independent Henry Speakman1670.7%
Total valid votes22,436 100.0%

See also

Related Research Articles

<span class="mw-page-title-main">Niagara Peninsula</span> Peninsula in Ontario, Canada

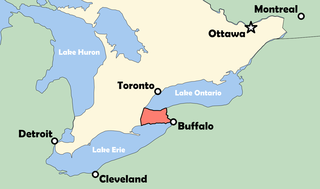
The Niagara Peninsula is an area of land lying between the southwestern shore of Lake Ontario and the northeastern shore of Lake Erie, in Ontario, Canada. Technically an isthmus rather than a peninsula, it stretches from the Niagara River in the east to Hamilton, Ontario, in the west. The peninsula is located in the Golden Horseshoe region of Southern Ontario, and has a population of roughly 1,000,000 residents. The region directly across the Niagara River and Lake Erie in New York State is known as the Niagara Frontier.

<span class="mw-page-title-main">Regional Municipality of Niagara</span> Regional municipality in Ontario, Canada

The Regional Municipality of Niagara, also colloquially known as the Niagara Region or Region of Niagara, is a regional municipality comprising twelve municipalities of Southern Ontario, Canada. The regional seat is in Thorold. It is the southern end of the Golden Horseshoe, the largest megalopolis in Canada.

Chippawa is a community located within the city of Niagara Falls, Ontario.

<span class="mw-page-title-main">Welland County</span> Historic county in Ontario, Canada

Welland County is a historic county in the Canadian province of Ontario.

<span class="mw-page-title-main">Leeds—Grenville—Thousand Islands and Rideau Lakes (federal electoral district)</span> Federal electoral district in Ontario, Canada

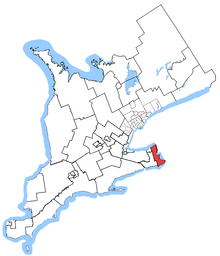
Leeds—Grenville—Thousand Islands and Rideau Lakes is a federal electoral district in Ontario, Canada, that has been represented in the House of Commons since 1979. Prior to the 2015 election, the riding was known as Leeds—Grenville.
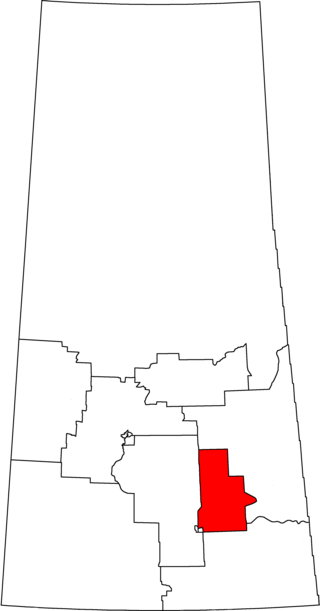
Lincoln was a federal electoral district represented in the House of Commons of Canada from 1867 to 1883 and from 1904 to 1997. It was on the Niagara Peninsula in the Canadian province of Ontario. At various times, there was also an electoral district of the same name used in provincial elections.

<span class="mw-page-title-main">Hamilton Mountain (federal electoral district)</span> Federal electoral district in Ontario, Canada

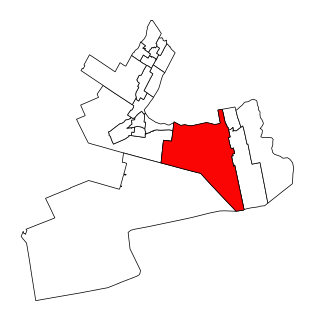
Hamilton Mountain is a federal electoral district in Ontario, Canada, that has been represented in the House of Commons of Canada since 1968. The riding is located in the Hamilton region.

<span class="mw-page-title-main">Hamilton Centre (federal electoral district)</span> Federal electoral district in Ontario, Canada

Hamilton Centre is a federal electoral district in Hamilton, Ontario, Canada, that has been represented in the House of Commons of Canada since 2004.

<span class="mw-page-title-main">Haldimand—Norfolk (federal electoral district)</span> Federal electoral district in Ontario, Canada

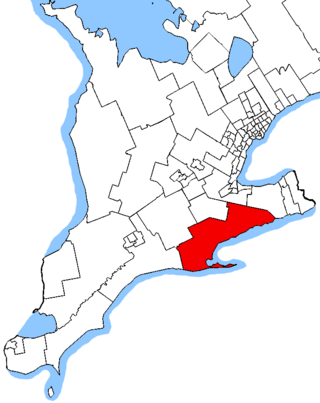
Haldimand—Norfolk is a federal electoral district in Ontario, Canada, that has been represented in the House of Commons of Canada from 1979 to 1997, and since 2004. The current Member of Parliament (MP) is Conservative Leslyn Lewis.

<span class="mw-page-title-main">Hamilton East—Stoney Creek (federal electoral district)</span> Federal electoral district in Ontario, Canada

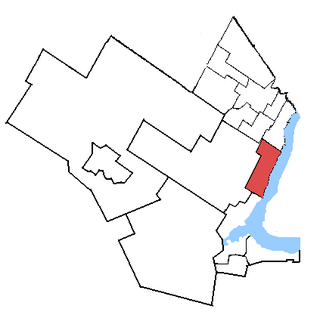
Hamilton East—Stoney Creek is a federal electoral district in Ontario, Canada, that has been represented in the House of Commons of Canada since 2004.

<span class="mw-page-title-main">Niagara West—Glanbrook</span> Federal electoral district in Ontario, Canada

Niagara West—Glanbrook was a federal electoral district in Ontario, Canada, that existed from 2004 to 2015.

<span class="mw-page-title-main">St. Catharines (federal electoral district)</span> Federal electoral district in Ontario, Canada

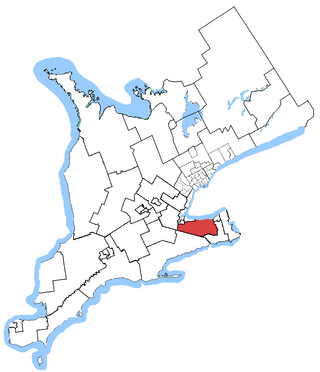
St. Catharines is a federal electoral district in the Niagara Region of Ontario, Canada, that has been represented in the House of Commons of Canada since 1968.

Erie was a federal electoral district represented in the House of Commons of Canada from 1979 to 1997. It was located in the province of Ontario. This riding was created in 1976 from parts of Lincoln and Welland ridings.

Erie—Lincoln was a federal electoral district in Ontario, Canada, that was represented in the House of Commons of Canada from 1997 to 2004, and was a provincial electoral district represented in the Legislative Assembly of Ontario from 1999 to 2007. This riding was created in 1996 from parts of Erie, Haldimand—Norfolk and Lincoln ridings.

<span class="mw-page-title-main">Niagara Centre (federal electoral district)</span> Federal electoral district in Ontario, Canada

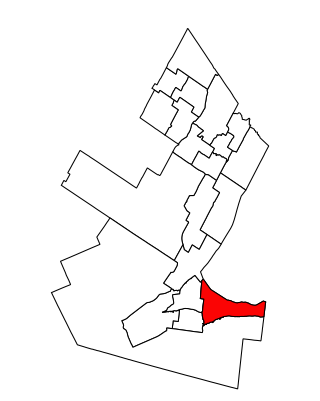
Niagara Centre is a federal electoral district in the Niagara Region of Ontario that has been represented in the House of Commons of Canada from 1867 to 1988 and since 1997.

<span class="mw-page-title-main">Niagara Centre (provincial electoral district)</span> Provincial electoral district in Ontario, Canada

Niagara Centre is a provincial electoral district in Ontario, Canada, represented from 1867 until 1977 and again since 2007 in the Legislative Assembly of Ontario. Its population in 2006 was 112,875.

<span class="mw-page-title-main">Niagara West (federal electoral district)</span> Federal electoral district in Ontario, Canada

Niagara West is a federal electoral district in Ontario. It encompasses a portion of Ontario formerly included in the electoral districts of Niagara West—Glanbrook, Welland and St. Catharines. It is currently represented by Dean Allison.

<span class="mw-page-title-main">Lanark—Frontenac—Kingston (federal electoral district)</span> Federal electoral district in Ontario, Canada

Lanark—Frontenac—Kingston is a federal electoral district in Eastern Ontario, Canada.

Lincoln South was an electoral district of the Legislative Assembly of the Parliament of the Province of Canada, in Canada West. It was created in 1841, upon the establishment of the Province of Canada by the union of Upper Canada and Lower Canada. Lincoln South was represented by one member in the Legislative Assembly. It was amalgamated prior to the election of 1848.

References

Notes

43°03′36″N79°07′41″W / 43.06°N 79.1281°W / 43.06; -79.1281