York Centre (federal electoral district)

Last updated

York Centre
Flag of Ontario.svg Ontario electoral district
Ontario 2018 York Centre.svg
York Centre in relation to the other Toronto ridings (2015 boundaries)
Federal electoral district
Legislature House of Commons
MP


Ya'ara Saks
Liberal
District created1952
First contested 1953
Last contested 2021
District webpage profile, map
Demographics
Population (2021) [1] 108,307
Electors (2015)63,682
Area (km²) [2] 37
Pop. density (per km²)2,927.2
Census division(s) Toronto
Census subdivision(s) Toronto
Map of York Centre York Centre Elections Canada map 35118 (2015 boundaries).gif
Map of York Centre

York Centre (French : York-Centre) is a federal electoral district in Ontario, Canada, that has been represented in the House of Commons of Canada from 1904 to 1917 and since 1953.

Contents

As per the 2016 Census, 17.0% of York Centre residents are of Filipino ethnic origin and 16.0% belong to the Filipino visible minority, which are the highest such figures among all City of Toronto ridings. At the same time, the York Centre riding has the highest percentage of residents of Russian (9.5%) and Jewish (5.6%) ethnic origins (in the 2011 National Household Survey, 13.6% of York Centre residents had entered a Jewish ethnic origin). The riding has a large Jewish population, currently the fourth-largest in Canada at 14 percent behind Thornhill, Mount Royal and Eglinton—Lawrence. [3]

The riding was previously considered one of the safest Liberal Party seats in Canada; however, this changed as the Conservative Party gained ground in the 2000s, and its candidate Mark Adler won the seat in 2011. However, the Liberal Party regained the seat in 2015 with its candidate Michael Levitt. Levitt was re-elected in 2019, and resigned as of September 1, 2020, to become the CEO of the Friends of Simon Wiesenthal Center for Holocaust Studies. [4] A by-election to fill the vacancy took place on October 26, 2020, which was won by Liberal Ya'ara Saks. [5] [6]

Demographics

According to the 2021 Canadian census [7]

Ethnic groups: 46.9% White, 19.3% Filipino, 8.0% Black, 5.4% Latin American, 4.1% South Asian, 3.7% Southeast Asian, 3.3% Chinese, 2.5% West Asian, 1.6% Korean
Languages: 42.0% English, 9.5% Tagalog, 6.3% Russian, 5.2% Italian, 5.1% Spanish, 2.1% Vietnamese, 1.6% Portuguese, 1.5% Ilocano, 1.4% Korean, 1.3% Mandarin, 1.1% Cantonese, 1.1% Turkish, 1.1% Persian
Religions: 57.3% Christian (36.0% Catholic, 4.4% Christian Orthodox, 1.7% Pentecostal, 15.2% other), 14.3% Jewish, 5.0% Muslim, 2.5% Buddhist, 2.1% Hindu, 18.3% none
Median income: $36,400 (2020)
Average income: $50,440 (2020)

Geography

York Centre consists of the part of the City of Toronto bounded on the north by the northern city limit, and on the east, south and west by a line drawn from the city limit south along Bathurst Street, southeast along the Don River West Branch, southwest and west along Highway 401, north along Jane Street, east along Sheppard Avenue West, northwest along Black Creek, east along Grandravine Drive, and north along Keele Street to the city limit.

It contains the neighbourhoods of Westminster–Branson, Bathurst Manor, Wilson Heights, Downsview, and York University Heights (a small section south of Grandravine Drive, east of Black Creek).

At the approximate centre of the district is Downsview Park, an urban park controlled by the federal government, on former grounds of Canadian Forces Base Toronto.

History

York Centre was originally created in 1903 from parts of York East and York West ridings. It was created when the county of York (excluding the city of Toronto) was divided into three ridings: York Centre, York North and York South. The centre riding consisted of the townships of Etobicoke, Markham, Scarborough and Vaughan, and the villages of Markham, Richmond Hill, Weston and Woodbridge. The electoral district was abolished in 1914 when it was redistributed between York East, York South and York West. In 1952, York Centre was re-established with parts of Eglinton—Lawrence, Willowdale, York North and York West ridings.

The new riding consisted initially of the part of the township of North York west of Yonge Street, the part of the township of Vaughan south of Highway Number 7, and the town of Woodbridge.

In 1966, it was redefined to consist of the part of Metropolitan Toronto bounded on the north by the northern limit, and on the west, south and east by a line drawn from that borough limit south along Highway 400, east along Sheppard Avenue West, south along Jane Street, southeast along Exbury Road, east along Calvington Drive, south along Keele Street, east along Highway 401, south along the Canadian National Railway line, east along Lawrence Avenue West, north along the Spadina Expressway, northeast along Highway 401, north along Bathurst Street, east along Sheppard Avenue West, south along Easton Street, east along Cameron Avenue, and north along Yonge Street to the Metro Toronto limit. It is unclear why the name York Centre was retained as the district was now predominantly in the Borough of North York rather than in the Region of York.

In 1976, it was redefined to consist of the part of the Borough of North York bounded on the north by the borough limit, and on the west, south and east by a line drawn from the borough limit south along Highway 400, east along Sheppard Avenue West, south along Keele Street, east along Highway 401, north along Bathurst Street, and northwest along the West Branch of the Don River to the borough limit.

In 1987, it was redefined to consist of the part of the City of North York bounded on the north by the city limit, and on the east, south and west by a line drawn from the city limit southeast along the Don River West Branch, west along Highway 401, north along Jane Street, east along Grandravine Drive, and north along Black Creek to the northern city limit.

In 1996, it was redefined to consist of the part of the City of North York bounded on the north by the city limit, and on the east, south and west by a line drawn from the city limit south along Dufferin Street, west along Sheppard Avenue West, north along Keele Street, west along Grandravine Drive, south along Jane Street, east along Highway 401, northwest along the Don River West Branch, north along Bathurst Street, east along Drewry Avenue, north along Chelmsford Avenue, west along Greenwin Village Road, and north along Village Gate to the city limit.

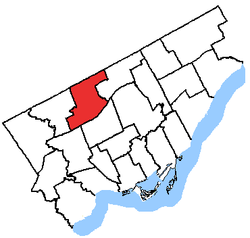
In 2003, it was given its current boundaries as described above.

This riding lost territory to Willowdale and a small piece to Thornhill during the 2012 electoral redistribution.

The riding did not undergo any boundary changes following the 2022 Canadian federal electoral redistribution.

Former boundaries

Members of Parliament

This riding has elected the following members of Parliament:

ParliamentYearsMemberParty
York Centre
Riding created from York East and York West
10th  1904–1907   Archibald Campbell Liberal
 1907–1908 Peter Douglas McLean
11th  1908–1911   Thomas George Wallace Conservative
12th  1911–1917
Riding dissolved into York East and York South
Riding re-created from Eglinton—Lawrence, Willowdale,
York North and York West
22nd  1953–1957   Al Hollingworth Liberal
23rd  1957–1958   Fred C. Stinson Progressive Conservative
24th  1958–1962
25th  1962–1963   James Edgar Walker Liberal
26th  1963–1965
27th  1965–1968
28th  1968–1972
29th  1972–1974
30th  1974–1979 Bob Kaplan
31st  1979–1980
32nd  1980–1984
33rd  1984–1988
34th  1988–1993
35th  1993–1997 Art Eggleton
36th  1997–2000
37th  2000–2004
38th  2004–2006 Ken Dryden
39th  2006–2008
40th  2008–2011
41st  2011–2015   Mark Adler Conservative
42nd  2015–2019   Michael Levitt Liberal
43rd  2019–2020
 2020–2021 Ya'ara Saks
44th  2021–present

Election results

Graph of election results in York Centre (1953–, minor parties that never got 2% of the vote or didn't run consistently are omitted)

2020–present

2025 Canadian federal election
PartyCandidateVotes%±%Expenditures
Liberal Ya'ara Saks
Conservative Roman Baber
New Democratic Sinan Ulukanligil
Total valid votes/Expense limit
Total rejected ballots
Turnout
Eligible voters
2021 Canadian federal election
PartyCandidateVotes%±%Expenditures
Liberal Ya'ara Saks 17,43047.3+1.6$106,060.49
Conservative Joel Yakov Etienne13,94937.8-4.0$98,838.17
New Democratic Kemal Ahmed3,75310.2+4.4$5,586.43
People's Nixon Nguyen1,7264.7+1.1$1,816.68
Total valid votes/Expense limit36,85898.6$106,565.66
Total rejected ballots5071.4
Turnout37,36553.4
Eligible voters69,971
Liberal hold Swing +2.8
Source: Elections Canada [8]
Canadian federal by-election, October 26, 2020: York Centre
Resignation of Michael Levitt
PartyCandidateVotes%±%Expenditures
Liberal Ya'ara Saks 8,25345.70−4.50$96.612.31
Conservative Julius Tiangson7,55241.82+5.11
New Democratic Andrea Vásquez Jiménez1,0465.79−4.05$2,462.86
People's Max Bernier 6423.56$27,917.42
Green Sasha Zavarella4612.55−0.70$463.46
Independent John The Engineer Turmel 1040.58
Total valid votes/expense limit 18,05899.09 $105,734.74
Total rejected ballots 166 0.91 −0.61
Turnout18,224 25.83 −35.84
Eligible voters 71,100
Liberal hold Swing −4.81
[9] [10]

1953–2019

2019 Canadian federal election
PartyCandidateVotes%±%Expenditures
Liberal Michael Levitt 21,68050.20+3.32$93,151.84
Conservative Rachel Willson15,85236.71−7.29$89,344.00
New Democratic Andrea Vásquez Jiménez4,2519.84+2.51none listed
Green Rebecca Wood1,4033.25+1.45$0.00
Total valid votes/expense limit43,18698.48
Total rejected ballots6651.52+0.78
Turnout43,85161.76-3.96
Eligible voters71,000
Liberal hold Swing +5.31
Source: Elections Canada [11] [12]
2015 Canadian federal election
PartyCandidateVotes%±%Expenditures
Liberal Michael Levitt 20,13146.88+13.64$108,171.17
Conservative Mark Adler 18,89343.994.54$139,711.85
New Democratic Hal Berman3,1487.338.56$9,236.24
Green Constantine Kritsonis 7721.800.54$2,969.38
Total valid votes/expense limit42,94499.26 $198,977.91
Total rejected ballots3190.74
Turnout43,26365.72
Eligible voters65,832
Liberal gain from Conservative Swing +9.09
Source: Elections Canada [13] [14] [15] [16]
2011 federal election redistributed results [17]
PartyVote %
  Conservative 17,24948.53
  Liberal 11,81433.24
  New Democratic 5,64915.89
  Green 8312.34
2011 Canadian federal election
PartyCandidateVotes%±%Expenditures
Conservative Mark Adler 20,35648.5+10.5$79,794.56
Liberal Ken Dryden 13,97933.310.2$73,675.98
New Democratic Nick Brownlee6,65615.9+3.8$409.63
Green Rosemary Frei9792.34.1$342.41
Total valid votes/expense limit41,970 100.0$83,892.08
Total rejected ballots350 0.1
Turnout42,320 60.3 +7.6
Eligible voters 70,216
Conservative gain from Liberal Swing +10.35
2008 Canadian federal election
PartyCandidateVotes%±%Expenditures
Liberal Ken Dryden 16,16443.59.2$70,386
Conservative Rochelle Wilner14,13238.0+7.9$78,946
New Democratic Kurtis Baily4,50312.11.7
Green Rosemary Frei2,3906.4+3.8$3,440
Total valid votes/expense limit37,189100.0$81,864
Total rejected ballots
Turnout52.7
2006 Canadian federal election
PartyCandidateVotes%±%Expenditures
Liberal Ken Dryden 22,43952.72.1$74,395.87
Conservative Michael Mostyn12,75830.0+3.7$69,571.51
New Democratic Marco Iacampo5,83413.70$13,721.44
Green Constantine Kritsonis 1,5583.7+0.5$1,644.87
Total valid votes42,589
2004 Canadian federal election
PartyCandidateVotes%±%Expenditures
Liberal Ken Dryden 21,52054.816.3$64,620
Conservative Michael Mostyn10,31826.3+5.8$72,837
New Democratic Peter Flaherty5,37613.7+7.7$10,017
Green Constantine Kritsonis 1,2403.2+1.7
Independent Max Royz8242.1$23,589
Total valid votes39,278
2000 Canadian federal election
PartyCandidateVotes%±%Expenditures
Liberal Art Eggleton 24,79371.11.0$56,516
Alliance Jeffrey Dorfman4,63013.3$19,703
Progressive Conservative Mark Tweyman2,5187.21.4$1,280
New Democratic Maurice Coulter2,1046.03.4$8,831
Green Constantine Kritsonis 5321.5+0.5$2,401
Communist Christopher Black1630.5$202
Marxist–Leninist Diane Johnston1420.40$8
Total valid votes34,882
1997 Canadian federal election
PartyCandidateVotes%±%
Liberal Art Eggleton 27,86472.1+2.4
New Democratic Mark Berardo3,6189.4+5.4
Progressive Conservative Anthony Figliano3,3238.6+1.7
Reform Anthony Chol2,8767.4+1.9
Green Constantine Kritsonis 3891.0+0.4
Natural Law Mike Dubinsky2420.60
Canadian Action Jozef Izsak1860.5
Marxist–Leninist Diane Johnston1680.4+0.2
Total valid votes38,666
1993 Canadian federal election
PartyCandidateVotes%±%
Liberal Art Eggleton 27,15069.7+9.2
Independent Peter Li Preti 3,91810.1
Progressive Conservative George Tsiolis2,6886.915.5
Reform John Beck2,1415.5
New Democratic Israel Ellis1,5574.011.4
National Kurt Loeb7341.9
Natural Law Linda Dubé2530.6
Green Alan Jones2160.6
Libertarian Douglas Quinn1740.41.3
Marxist–Leninist Diane Johnston830.2
Abolitionist Randy Armour600.2
Total valid votes38,974
1988 Canadian federal election
PartyCandidateVotes%±%
Liberal Bob Kaplan 24,96260.5+9.3
Progressive Conservative Rocco Sebastiano9,24822.45.0
New Democratic Cathy Mele6,35015.44.4
Libertarian David Kenny6831.7+1.1
Total valid votes41,243
1984 Canadian federal election
PartyCandidateVotes%±%
Liberal Bob Kaplan 20,81051.2-9.8
Progressive Conservative Mike Cohen11,13827.4+9.6
New Democratic Van Newell8,03719.80.5
Libertarian Simon Srdarev2440.60.1
Independent Sol Roter2260.6
Independent Bonnie J. Geddes2030.5
Total valid votes40,658
1980 Canadian federal election
PartyCandidateVotes%±%
Liberal Bob Kaplan 23,11661.0+9.7
New Democratic Cris Liscio7,69620.35.4
Progressive Conservative Anne Silverman6,73617.84.0
Libertarian Sheldon Gold2840.7+0.1
Marxist–Leninist Jeffery Forest860.20
Total valid votes37,918
1979 Canadian federal election
PartyCandidateVotes%±%
Liberal Bob Kaplan 20,85951.3+0.6
New Democratic Vince Del Buono10,46425.7+2.2
Progressive Conservative Bill Schiavono8,85621.83.1
Libertarian Shannon Vale2290.6
Independent Victor Heyn970.2
Marxist–Leninist Jeffery Forest810.20
Communist Gerrit van Houten630.20
Total valid votes40,649
1974 Canadian federal election
PartyCandidateVotes%±%
Liberal Bob Kaplan 32,40250.7+8.8
Progressive Conservative Barry Swadron15,87724.94.9
New Democratic Michael Copeland14,99223.54.3
Independent John J. de Niet1910.3
Social Credit Roger Drouin1690.3
Marxist–Leninist Rick Hundal1290.2
Communist Tom Morris1230.2
Total valid votes63,883
1972 Canadian federal election
PartyCandidateVotes%±%
Liberal James E. Walker 26,91241.914.7
Progressive Conservative Barry Swadron19,09729.8+17.5
New Democratic Michael Copeland17,83727.8-3.3
Independent Harold Sparks1890.3
Independent George Paxton1530.2
Total valid votes64,188
1968 Canadian federal election
PartyCandidateVotes%±%
Liberal James E. Walker 26,75856.6+10.2
New Democratic Douglas Fisher 14,71431.15.0
Progressive Conservative Donald Stirling5,80412.34.8
Total valid votes47,276
1965 Canadian federal election
PartyCandidateVotes%±%
Liberal James E. Walker 41,55346.43.7
New Democratic Val Scott32,35236.1+1.7
Progressive Conservative Fred C. Stinson 15,30117.1+1.6
Independent Malcolm Cairnduff3020.3
Total valid votes89,508
1963 Canadian federal election
PartyCandidateVotes%±%
Liberal James E. Walker 41,48550.1+12.0
New Democratic Val Scott28,50534.4+0.1
Progressive Conservative Bill Durovic12,80715.511.2
Total valid votes82,797
1962 Canadian federal election
PartyCandidateVotes%±%
Liberal James E. Walker 30,43238.1+5.1
New Democratic Val Scott27,36934.3+20.6
Progressive Conservative Fred C. Stinson 21,34326.726.6
Social Credit David H. Horwood7460.9
Total valid votes79,890
1958 Canadian federal election
PartyCandidateVotes%±%
Progressive Conservative Fred C. Stinson 30,76453.3+5.9
Liberal Al Hollingworth 19,06533.01.4
Co-operative Commonwealth Larry Sheffe7,88813.72.9
Total valid votes57,717
1957 Canadian federal election
PartyCandidateVotes%±%
Progressive Conservative Fred C. Stinson 23,29547.4+11.9
Liberal Al Hollingworth 16,92534.49.7
Co-operative Commonwealth Roy Begley8,16416.62.3
Social Credit Rod Gorrill7771.6
Total valid votes49,161
1953 Canadian federal election
PartyCandidateVotes%±%
Liberal Al Hollingworth 13,90344.1
Progressive Conservative Roy Thomson 11,18035.5
Co-operative Commonwealth William Newcombe5,96018.9
Labor–Progressive David Kashtan4831.5
Total valid votes31,526

1904-1917

Graph of election results in York Centre (1903–1914, minor parties that never got 2% of the vote or didn't run consistently are omitted)
1911 Canadian federal election
PartyCandidateVotes%±%
Conservative Thomas George Wallace 2,83854.9+4.5
Liberal Herbert Hartly Dewart 2,32845.1-4.5
Total valid votes5,166 100.0
1908 Canadian federal election
PartyCandidateVotes%±%
Conservative Thomas George Wallace 2,61450.4+0.7
Liberal Peter Douglas McLean 2,56949.6-0.7
Total valid votes 5,183100.0
Canadian federal by-election, 23 December 1907
PartyCandidateVotes%±%
On Mr. Campbell being called to the Senate, 22 November 1907
Liberal Peter Douglas McLean 2,28250.3-0.6
Conservative T.G. Wallace2,25649.7+0.6
Total valid votes4,538 100.0
1904 Canadian federal election
PartyCandidateVotes%
Liberal Archibald Campbell 2,22250.9
Conservative W.H. Pugsley2,14649.1
Total valid votes4,368 100.0

See also

Notes

References

  1. "Census Profile, 2021 Census". Ottawa: Statistics Canada. 2022. Retrieved February 9, 2022.
  2. Statistics Canada: 2011
  3. "Statistics Canada: Estimation of the Jewish Population". Elections Canada. 2019. Retrieved November 19, 2024.
  4. Lim, Jolson (August 4, 2020). "Toronto-area MP Michael Levitt to resign to head Jewish human rights organization". iPolitics. Retrieved September 2, 2020.
  5. "Byelections called for Toronto Centre, York Centre on Oct. 26". CBC News . September 18, 2020. Retrieved September 18, 2020.
  6. "Federal Liberals hold onto Toronto Centre, York Centre in byelections | CBC News". CBC. Retrieved October 27, 2020.
  7. Government of Canada, Statistics Canada (February 9, 2022). "Profile table, Census Profile, 2021 Census of Population - York Centre [Federal electoral district (2013 Representation Order)], Ontario". www12.statcan.gc.ca. Retrieved March 7, 2023.
  8. "List of confirmed candidates – September 20, 2021 Federal Election". Elections Canada . Retrieved September 2, 2021.
  9. Elections Canada. "Official Voting Results" . Retrieved August 7, 2021.
  10. Canada, Elections. "Final Election Expenses Limit for Candidates – York Centre (Ontario)". www.elections.ca. Retrieved February 10, 2021.
  11. "List of confirmed candidates". Elections Canada. Retrieved October 4, 2019.
  12. "Official Voting Results". Elections Canada. Retrieved September 18, 2020.
  13. Canada, Elections. "Voter Information Service - Find your electoral district". www.elections.ca.
  14. "Elections Canada – Preliminary Election Expenses Limits for Candidates". Archived from the original on August 15, 2015. Retrieved December 27, 2018.
  15. Canada, Elections. "Résultats du soir d'élection - Circonscriptions". enr.elections.ca.
  16. "Official Voting Results". Elections Canada. Retrieved September 18, 2020.
  17. Pundits' Guide to Canadian Elections
North: Thornhill
West: York West York CentreEast: Willowdale
South: Eglinton—Lawrence, York South—Weston

43°45′46″N79°26′44″W / 43.7627°N 79.4456°W / 43.7627; -79.4456