Niagara Centre (federal electoral district)

Last updated

Niagara Centre
Flag of Ontario.svg Ontario electoral district
Niagara Centre 2015.svg
Niagara Centre in relation to nearby electoral districts
Federal electoral district
Legislature House of Commons
MP


Vance Badawey
Liberal
District created1996
First contested 1997
Last contested 2021
District webpage profile, map
Demographics
Population (2016) [1] 109,067
Electors (2019)90,698
Area (km²) [1] 301.26
Pop. density (per km²)362
Census division(s) Niagara
Census subdivision(s) Welland, Thorold, Port Colborne, St. Catharines

Niagara Centre (French : Niagara-Centre; formerly Welland) is a federal electoral district in the Niagara Region of Ontario that has been represented in the House of Commons of Canada from 1867 to 1988 and since 1997.

Contents

Under the 2022 Canadian federal electoral redistribution the riding will be renamed Niagara South. [2]

Demographics

According to the 2021 Canadian census [3]

Ethnic groups: 83.0% White, 5.1% Indigenous, 3.1% Black, 2.5% South Asian, 1.3% Chinese, 1.2% Latin American, 1.0% Filipino
Languages: 81.0% English, 4.5% French, 2.2% Italian, 1.1% Spanish
Religions: 60.5% Christian (32.7% Catholic, 5.3% Anglican, 3.5% United Church, 1.8% Presbyterian, 1.3% Baptist, 1.2% Lutheran, 1.1% Pentecostal, 13.6% Other), 2.1% Muslim, 35.2% None
Median income: $37,600 (2020)
Average income: $46,040 (2020)

Geography

Niagara Centre consists of the cities of Welland, Thorold, and Port Colborne, and the part of the City of St. Catharines lying south of a line drawn from the southern city limit north along First Louth St, east along St. Paul Street West, northeast along St. Paul Crescent, east and south along Twelve Mile Creek, and east along Glendale Avenue to the eastern city limit. [4]

History

Welland was originally created in 1867 by the British North America Act. It consisted initially of the Townships of Bertie, Crowland, Humberstone, Stamford, Thorold, and Willoughby, and the Villages of Chippawa, Clifton, Fort Erie, Thorold and Welland.

In 1892, the riding was redefined to exclude reference to the Village of Clifton, and include the villages of Niagara Falls and Port Colborne, and the town of Niagara Falls. In 1903, it was redefined to consist of the county of Welland.

In 1952, it was redefined to consist of the townships of Pelham, Thorold, Crowland, Humberstone and Wainfleet, including the city of Welland and the towns of Port Colborne, Thorold, Fonthill and Humberstone.

In 1966, it was redefined to consist of:

In 1976, it was redefined to consist of the City of Welland, the Town of Thorold, and the part of the City of St. Catharines lying south of the Canadian National Railway.

The electoral district was abolished in 1987 when it was redistributed between Welland—St. Catharines—Thorold, St. Catharines and Erie ridings.

A new riding, named Niagara Centre was created in 1996 from parts of Erie and Welland—St. Catharines—Thorold ridings. It existed only for the 1997 and 2000 elections.

It consisted of the Town of Pelham, the City of Welland, the southern part of the City of St. Catharines, and the part of the City of Thorold lying west of the Welland Canal.

The electoral district was abolished in 2003 when it was redistributed between Niagara West—Glanbrook, St. Catharines and Welland ridings.

In 2003, a new Welland riding was created from parts of Erie—Lincoln, Niagara Centre, Niagara Falls and St. Catharines ridings.

Welland was abolished in 2013, and was largely replaced by a new riding named Niagara Centre. The riding lost Wainfleet and the rural southwestern corner of St. Catharines.

Members of Parliament

This riding has elected the following members of Parliament:

ParliamentYearsMemberParty
Welland
1st  1867–1872   Thomas Clark Street Conservative
2nd  1872–1872
 1872–1874   William Alexander Thomson Liberal
3rd  1874–1878
4th  1878–1882   Christopher William Bunting Conservative
5th  1882–1887 John Ferguson
6th  1887–1891
7th  1891–1892   William Manley German Liberal
 1892–1896 James A. Lowell
8th  1896–1900   William McCleary Conservative
9th  1900–1904   William Manley German Liberal
10th  1903–1908
11th  1908–1911
12th  1911–1917
13th  1917–1921   Evan Eugene Fraser Government (Unionist)
14th  1921–1925   William Manley German Liberal
15th  1925–1926   George Hamilton Pettit Conservative
16th  1926–1930
17th  1930–1935
18th  1935–1940   Arthur Damude Liberal
19th  1940–1941
 1942–1945 Humphrey Mitchell
20th  1945–1949
21st  1949–1950
 1950–1953 William Hector McMillan
22nd  1953–1957
23rd  1957–1958
24th  1958–1962
25th  1962–1963
26th  1963–1965
27th  1965–1968 Donald Tolmie
28th  1968–1972
29th  1972–1974 Victor Railton
30th  1974–1979
31st  1979–1980 Gilbert Parent
32nd  1980–1984
33rd  1984–1988   Allan Pietz Progressive Conservative
Riding dissolved into Welland—St. Catharines—Thorold,
St. Catharines and Erie
Niagara Centre
Riding created from Erie and Welland—St. Catharines—Thorold
36th  1997–2000   Gilbert Parent Liberal
37th  2000–2004 Tony Tirabassi
Welland
38th  2004–2006   John David Maloney Liberal
39th  2006–2008
40th  2008–2011   Malcolm Allen New Democratic
41st  2011–2015
Niagara Centre
42nd  2015–2019   Vance Badawey Liberal
43rd  2019–2021
44th  2021–present

Election results

Graph of election results in Niagara Centre/Welland (1997-, parties that never received 2% of the vote are omitted)

Niagara Centre, 2015–present

2021 Canadian federal election
PartyCandidateVotes%±%Expenditures
Liberal Vance Badawey 20,57635.0±0.0$110,313.54
Conservative Graham Speck18,32431.2+0.2$47,554.12
New Democratic Melissa McGlashan14,08624.0-2.7$35,052.11
People's Michael Kimmons4,6707.9+6.6$9,696.81
Green Kurtis McCartney1,1231.9-3.4$1,496.71
Total valid votes58,77999.3
Total rejected ballots4370.7
Turnout59,21663.5
Eligible voters93,264
Liberal hold Swing -0.1
Source: Elections Canada [5]
2021 federal election redistributed results [6]
PartyVote %
  Conservative 21,92033.41
  Liberal 21,62232.96
  New Democratic 14,95222.79
  People's 5,8698.95
  Green 1,2471.90
2019 Canadian federal election : Niagara Centre
PartyCandidateVotes%±%Expenditures
Liberal Vance Badawey 20,29235.01-0.68$78,098.76
Conservative April Jeffs17,98731.03+1.32none listed
New Democratic Malcolm Allen 15,46926.69-4.80none listed
Green Michael Tomaino3,0545.27+2.86$2,561.88
People's Andrew Sainz-Nieto7761.34none listed
Christian Heritage Nic Bylsma3080.53none listed
Marxist–Leninist Robert Walker770.13-0.04none listed
Total valid votes/expense limit57,96399.08
Total rejected ballots5390.92+0.33
Turnout58,50264.31-1.33
Eligible voters90,698
Liberal hold Swing -1.00
Source: Elections Canada [7] [8]
2015 Canadian federal election
PartyCandidateVotes%±%Expenditures
Liberal Vance Badawey 19,51335.68+21.32$68,715.34
New Democratic Malcolm Allen 17,21831.49-11.68$112,516.69
Conservative Leanna Villella16,24829.71-9.36$53,250.55
Green David Clow1,3162.41-0.07-
Animal Alliance Jody Di Bartolomeo2910.53$118.73
Marxist–Leninist Ron J. Walker960.18
Total valid votes/Expense limit54,68299.41-$218,835.14
Total rejected ballots3230.59
Turnout55,00565.64
Eligible voters83,799
Liberal gain from New Democratic Swing +16.50
Source: Elections Canada [9] [10]

Welland, 2003–2015

2011 Canadian federal election
PartyCandidateVotes%±%Expenditures
New Democratic Malcolm Allen 21,91742.2+9.3
Conservative Leanna Villella20,89540.2+7.9
Liberal John Maloney 7,27614-13.9
Green Robin Williamson1,2972.5-3
Christian Heritage David Vangoolen2990.6
Independent Ray Game1690.3
Marxist–Leninist Ron Walker710.1-0.1
Total valid votes/Expense limit51,924100.00
Total rejected ballots 293 0.6
Turnout52,217 61.8
Eligible voters 84,434
2008 Canadian federal election
PartyCandidateVotes%±%Expenditures
New Democratic Malcolm Allen 16,84232.9+2.3$67,119
Conservative Alf Kiers16,54232.3+2.8$84,414
Liberal John Maloney 14,29527.9-7.6$84,267
Green Jennifer Mooradian2,8165.5+2.1
Independent Jody Di Bartolomeo5691.1
Marxist–Leninist Ron Walker1140.2
Total valid votes/Expense limit51,178100.0$88,895
2006 Canadian federal election
PartyCandidateVotes%±%
Liberal John Maloney 20,23835.6-4.0
New Democratic Jody Di Bartolomeo17,48430.7+1.2
Conservative Mel Grunstein16,66529.3+3.1
Green Brian Simpson1,9603.4+0.5
Christian Heritage Irma D. Ruiter5360.9-0.6
Total valid votes56,883100.0
2004 Canadian federal election
PartyCandidateVotes%
Liberal John Maloney 19,64239.6
New Democratic Jody Di Bartolomeo14,62329.5
Conservative Mel Grunstein12,99726.2
Green Ryan McLaughlin1,4542.9
Christian Heritage Irma D. Ruiter7351.5
Marxist–Leninist Ron Walker1130.2
Total valid votes49,564100.0

Niagara Centre, 1996–2003

2000 Canadian federal election
PartyCandidateVotes%±%
Liberal Tony Tirabassi 21,64145.73-3.97
Alliance Bernie Law13,31328.13+3.29
New Democratic Mike Grimaldi7,02914.85+3.50
Progressive Conservative Joe Atkinson4,89310.34-1.67
Canadian Action Tom Prue2900.61
Marxist–Leninist Ron Walker1490.31+0.02
Source:Elections Canada [11]

Note:The 2000 Alliance vote is compared to the 1997 Reform vote

1997 Canadian federal election
PartyCandidateVotes%
Liberal Gilbert Parent 24,11549.70
Reform Don Johnstone12,05324.84
Progressive Conservative Joe Atkinson5,82712.01
New Democratic James Wilson5,51011.35
Christian Heritage David Bylsma5151.06
Natural Law Anne Larrass3630.75
Marxist–Leninist Ron Walker1430.29
Source:Elections Canada [11]

Welland, 1867–1987

1984 Canadian federal election : Welland
PartyCandidateVotes%±%
Progressive Conservative Allan Pietz 18,41842.0+14.7
Liberal Gilbert Parent 14,48133.0-10.8
New Democratic Rob Dobrucki10,50824.0-4.4
Green Andrew Rivett2840.6
Communist John MacLennan1450.3+0.1
Total valid votes43,836100.0
1980 Canadian federal election : Welland
PartyCandidateVotes%±%
Liberal Gilbert Parent 18,11243.8+6.6
New Democratic Robert Wright11,72928.4+2.5
Progressive Conservative George Krusell11,29227.3-8.7
Communist John Severinsky950.20.0
Marxist–Leninist Ron Walker780.20.0
Total valid votes41,306100.0
1979 Canadian federal election : Welland
PartyCandidateVotes%±%
Liberal Gilbert Parent 16,02537.2-19.3
Progressive Conservative Allan E. Pietz15,52736.1+11.8
New Democratic Robert Wright11,15125.9+7.3
Independent John L. Sabados2180.5
Communist John Severinsky830.2-0.4
Marxist–Leninist Ron Walker620.1
Total valid votes43,066100.0
1974 Canadian federal election : Welland
PartyCandidateVotes%±%
Liberal Victor Railton 21,22856.5+7.2
Progressive Conservative Alex McCrae9,10724.2-7.3
New Democratic Jim McPherson6,98318.6-0.5
Communist John Severinsky2380.6
Total valid votes 37,556100.0
1972 Canadian federal election : Welland
PartyCandidateVotes%±%
Liberal Victor Railton 18,69349.3-0.5
Progressive Conservative Kent Hodgson11,97731.6+14.0
New Democratic Ronald Cook7,25619.1-13.5
Total valid votes37,926100.0
1968 Canadian federal election : Welland
PartyCandidateVotes%±%
Liberal Donald R. Tolmie 17,33549.8-0.5
New Democratic Robert Wright11,36332.6+6.7
Progressive Conservative Franklin Bud Law6,12917.6-6.3
Total valid votes34,827100.0
1965 Canadian federal election : Welland
PartyCandidateVotes%±%
Liberal Donald R. Tolmie 17,86950.2-5.0
New Democratic Robert Wright9,20625.9+12.0
Progressive Conservative T.G. Spencer8,49623.9
Total valid votes35,571100.0
1963 Canadian federal election : Welland
PartyCandidateVotes%±%
Liberal William Hector McMillan 19,87955.3+7.7
Progressive Conservative Francis Goldring9,29125.8-7.2
New Democratic Guy Mersereau5,01013.9-2.9
Social Credit J.M. Patterson1,4133.9+2.2
Communist Frank Haslam3721.0+0.2
Total valid votes35,965 100.0
1962 Canadian federal election : Welland
PartyCandidateVotes%±%
Liberal William Hector McMillan 17,61447.6+4.9
Progressive Conservative Allan Pietz12,20933.0-6.1
New Democratic Mel Swart 6,22516.8-1.4
Social Credit W.F. Trelford6301.7
Communist Frank Haslam3170.9
Total valid votes36,995100.0

Note: NDP vote is compared to CCF vote in 1958 election.

1958 Canadian federal election : Welland
PartyCandidateVotes%±%
Liberal William Hector McMillan 15,36542.7+0.3
Progressive Conservative Allan Ernest Pietz14,05339.1+5.1
Co-operative Commonwealth Mel Swart 6,55018.2-5.4
Total valid votes 35,968100.0
1957 Canadian federal election : Welland
PartyCandidateVotes%±%
Liberal William Hector McMillan 13,24142.4-12.8
Progressive Conservative William Bigelow Wellington10,62034.0+7.6
Co-operative Commonwealth Melvin L. Swart 7,35623.6+7.8
Total valid votes31,217100.0
1953 Canadian federal election : Welland
PartyCandidateVotes%±%
Liberal William Hector McMillan 15,41155.2+6.5
Progressive Conservative Clarence Lavern Robins7,37326.4-6.0
Co-operative Commonwealth Melvin L. Swart 4,40815.8+0.9
Labor–Progressive Frank Haslam7212.6-1.4
Total valid votes 27,913100.0
Canadian federal by-election, 16 October 1950: Welland
PartyCandidateVotes%±%
On Mr. Mitchell's death, 1 August 1950
Liberal William Hector McMillan 19,55348.7+1.4
Progressive Conservative Sam Hughes13,03132.4+6.0
Co-operative Commonwealth Melvin L. Swart 5,97214.9-8.0
Labor–Progressive Melbourne A. Doig 1,6164.0+0.6
Total valid votes40,172100.0
1949 Canadian federal election : Welland
PartyCandidateVotes%±%
Liberal Humphrey Mitchell 23,73447.3+3.7
Progressive Conservative Sam Hughes13,25926.4-6.3
Co-operative Commonwealth Armour McCrae11,49322.9+6.4
Labor–Progressive Melbourne A. Doig 1,7113.4
Total valid votes50,197100.0
1945 Canadian federal election : Welland
PartyCandidateVotes%±%
Liberal Humphrey Mitchell 19,52243.6+1.3
Progressive Conservative Thomas Oscar Oliver14,63732.7
Co-operative Commonwealth Harland Roy Potter7,38316.5-5.3
Farmer–Labour Fern A. Sayles3,2587.3
Total valid votes44,800100.0
Canadian federal by-election, 9 February 1942: Welland
PartyCandidateVotes%±%
On Mr. Damude's death, 15 September 1941
Liberal Humphrey Mitchell 11,87542.3-10.2 [12]
Independent J. Douglas Watt10,10636.0
Co-operative Commonwealth Mark Kriluk6,12221.8+14.1
Total valid votes28,103100.0
1940 Canadian federal election : Welland
PartyCandidateVotes%±%
Liberal Arthur Damude 19,13252.5+1.9
National Government Allan Brooks14,49139.8+5.1
Co-operative Commonwealth Ernest Woodworth2,8187.7-3.5
Total valid votes 36,441100.0

Note: "National Government" vote is compared to Conservative vote in 1935 election.

1935 Canadian federal election : Welland
PartyCandidateVotes%±%
Liberal Arthur Damude 17,32450.6+5.0
Conservative Fred M. Cairns11,85034.6-19.7
Co-operative Commonwealth Thomas C. Daly3,83611.2
Reconstruction W. Herbert Smith1,2003.5
Total valid votes34,210 100.0
1930 Canadian federal election : Welland
PartyCandidateVotes%±%
Conservative George Hamilton Pettit 15,50354.3+1.7
Liberal Arthur Byron Damude13,03745.7-1.7
Total valid votes 28,540100.0
1926 Canadian federal election : Welland
PartyCandidateVotes%±%
Conservative George Hamilton Pettit 14,33152.6-7.7
Liberal William Manly German12,89047.4+7.7
Total valid votes27,221100.0
1925 Canadian federal election : Welland
PartyCandidateVotes%±%
Conservative George Hamilton Pettit 12,75360.4+30.3
Liberal Harry Punshon Stephens8,37339.6-13.3
Total valid votes 21,126 100.0
1921 Canadian federal election : Welland
PartyCandidateVotes%±%
Liberal William Manly German 11,19552.9+13.5
Conservative Evan Eugene Fraser6,36530.1-15.9
Progressive Joseph Henry Staley3,43716.2
Independent Henry Speakman1560.7
Total valid votes21,153100.0

Note: Conservative vote is compared to Government vote in 1917 election, and Liberal vote is compared to Opposition vote.

1917 Canadian federal election : Welland
PartyCandidateVotes%
Government (Unionist) Evan Eugene Fraser 5,37846.0
Opposition (Laurier Liberals) William Manly German 4,61639.5
Labour James Arthur Hughes1,70414.6
Total valid votes11,698100.0
1911 Canadian federal election : Welland
PartyCandidateVotes
Liberal William Manly German acclaimed
1908 Canadian federal election : Welland
PartyCandidateVotes%±%
Liberal William Manly German 4,44953.9-3.6
Conservative George Hanan3,80646.1
Total valid votes 8,255100.0
1904 Canadian federal election : Welland
PartyCandidateVotes%±%
Liberal William Manly German 3,54357.5+5.4
Conservative Walter Upper2,62142.5
Total valid votes 6,164100.0
1900 Canadian federal election : Welland
PartyCandidateVotes%±%
Liberal William Manly German 2,77752.1+3.7
Conservative William McCleary 2,55747.9-3.7
Total valid votes5,334100.0
1896 Canadian federal election : Welland
PartyCandidateVotes%±%
Conservative William McCleary 2,70551.6+6.1
Liberal James A. Lowell 2,53648.4-6.1
Total valid votes5,241100.0

Note: popular vote is compared to redsult in 1891 general election.

By-election on 29 April 1892

On Mr. German being unseated, 5 April 1892

PartyCandidateVotes
Liberal James A. Lowell acclaimed
1891 Canadian federal election : Welland
PartyCandidateVotes%±%
Liberal William M. German 2,72654.5
Conservative John Ferguson 2,27945.5-6.6
Total valid votes 5,005100.0
1887 Canadian federal election : Welland
PartyCandidateVotes%±%
Conservative John Ferguson 2,62252.1+0.4
UnknownThos. Conlon2,41047.9
Total valid votes 5,032100.0
1882 Canadian federal election : Welland
PartyCandidateVotes%±%
Conservative John Ferguson 1,96551.7+0.2
UnknownB.B. Osler1,83348.3
Total valid votes3,798100.0
1878 Canadian federal election : Welland
PartyCandidateVotes%±%
Liberal–Conservative Christopher William Bunting 1,92651.6
UnknownH. Edwin1,81048.4
Total valid votes3,736100.0
1874 Canadian federal election : Welland
PartyCandidateVotes%±%
Liberal William Alexander Thomson 1,68253.0+2.0
UnknownE.W. Brookfield1,49347.0
Total valid votes 3,175100.0
Canadian federal by-election, 23 November 1872: Welland
PartyCandidateVotes%±%
On Mr. Street's death, 6 August 1872
Liberal William Alexander Thomson 1,53951.0
UnknownRichard S. King1,48049.0
Total valid votes3,019100.0
1872 Canadian federal election : Welland
PartyCandidateVotes%
Conservative Thomas Clark Street 1,59060.0
UnknownA.G. Hill1,06040.0
Total valid votes2,650100.0
Source: Canadian Elections Database [13]
1867 Canadian federal election : Welland
PartyCandidateVotes
Conservative Thomas Clark Street acclaimed

See also

Related Research Articles

<span class="mw-page-title-main">Welland</span> City in Ontario, Canada

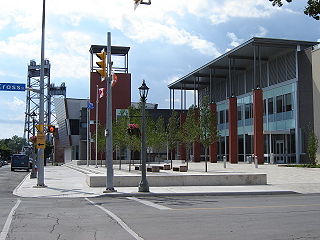
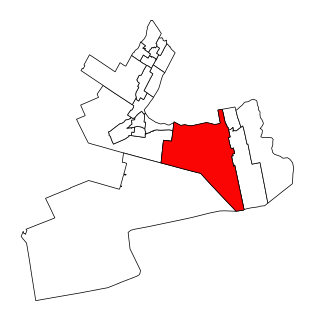
Welland is a city in the Regional Municipality of Niagara in Southern Ontario, Canada. As of 2021, it had a population of 55,750.

<span class="mw-page-title-main">Welland Canal</span> Ship canal in Ontario, Canada, connecting Lake Ontario and Lake Erie

The Welland Canal is a ship canal in Ontario, Canada, and part of the St. Lawrence Seaway and Great Lakes Waterway. The canal traverses the Niagara Peninsula between Port Weller on Lake Ontario, and Port Colborne on Lake Erie, and was erected because the Niagara River—the only natural waterway connecting the lakes—was unnavigable due to Niagara Falls. The Welland Canal enables ships to ascend and descend the Niagara Escarpment, and has followed four different routes since it opened.

<span class="mw-page-title-main">Niagara Peninsula</span> Peninsula in Ontario, Canada

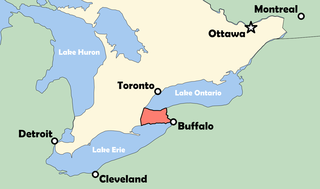
The Niagara Peninsula is an area of land lying between the southwestern shore of Lake Ontario and the northeastern shore of Lake Erie, in Ontario, Canada. Technically an isthmus rather than a peninsula, it stretches from the Niagara River in the east to Hamilton, Ontario, in the west. The peninsula is located in the Golden Horseshoe region of Southern Ontario, and has a population of roughly 1,000,000 residents. The region directly across the Niagara River and Lake Erie in New York State is known as the Niagara Frontier.

<span class="mw-page-title-main">Regional Municipality of Niagara</span> Regional municipality in Ontario, Canada

The Regional Municipality of Niagara, also colloquially known as the Niagara Region or Region of Niagara, is a regional municipality comprising twelve municipalities of Southern Ontario, Canada. The regional seat is in Thorold. It is the southern end of the Golden Horseshoe, the largest megalopolis in Canada.

King's Highway 58, commonly referred to as Highway 58, is a provincially maintained highway in the Canadian province of Ontario. The route is divided into two segments with a combined length of 15.5 km (9.6 mi). The southern segment travels from Niagara Regional Road 3, formerly Highway 3, in Port Colborne, to the Highway 58A junction in the southern end of Welland, a distance of 7.2 km (4.5 mi). The northern segment begins at Highway 20 near Allanburg and travels north and west to a large junction with Highway 406 at the St. Catharines – Thorold boundary, a distance of 8.3 km (5.2 mi). An 18.1 km (11.2 mi) gap separates the two segments within Welland and Pelham. The entire route is located within the Regional Municipality of Niagara.

Monck was a federal electoral district in the Canadian province of Ontario, which was represented in the House of Commons of Canada from 1867 to 1892. It is sometimes also considered one of Ontario's historic counties, as it was listed in some post-Confederation census records as a county of residence.

<span class="mw-page-title-main">Welland County</span> Historic county in Ontario, Canada

Welland County is a historic county in the Canadian province of Ontario.

Lincoln was a federal electoral district represented in the House of Commons of Canada from 1867 to 1883 and from 1904 to 1997. It was on the Niagara Peninsula in the Canadian province of Ontario. At various times, there was also an electoral district of the same name used in provincial elections.

<span class="mw-page-title-main">Niagara Falls (federal electoral district)</span> Federal electoral district in Ontario, Canada

Niagara Falls is a federal electoral district in Ontario, Canada, that has been represented in the House of Commons of Canada since 1953.

<span class="mw-page-title-main">St. Catharines (federal electoral district)</span> Federal electoral district in Ontario, Canada

St. Catharines is a federal electoral district in the Niagara Region of Ontario, Canada, that has been represented in the House of Commons of Canada since 1968.

Erie was a federal electoral district represented in the House of Commons of Canada from 1979 to 1997. It was located in the province of Ontario. This riding was created in 1976 from parts of Lincoln and Welland ridings.

Welland—St. Catharines—Thorold was a federal electoral district represented in the House of Commons of Canada from 1988 to 1997. It was located in the province of Ontario. This riding was created in 1987 from Welland riding.

Erie—Lincoln was a federal electoral district in Ontario, Canada, that was represented in the House of Commons of Canada from 1997 to 2004, and was a provincial electoral district represented in the Legislative Assembly of Ontario from 1999 to 2007. This riding was created in 1996 from parts of Erie, Haldimand—Norfolk and Lincoln ridings.

<span class="mw-page-title-main">Cooks Mills, Welland</span> Unincorporated community in Ontario, Canada

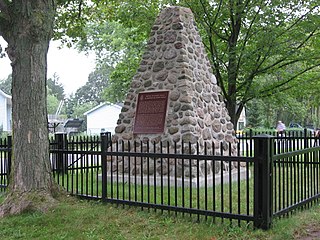
Cooks Mills is a small community in the easternmost part of the city of Welland in Ontario, Canada. It was established, and is still centred, on a Welland River tributary called Lyons Creek. It is almost entirely a bedroom community, as there are few employers located in the area.
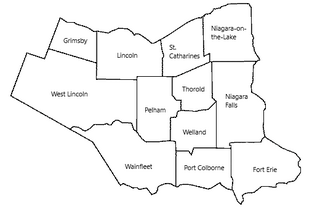
Erie—Lincoln was a provincial electoral district in Ontario, Canada, that elected members to the Legislative Assembly of Ontario.

<span class="mw-page-title-main">Niagara Centre (provincial electoral district)</span> Provincial electoral district in Ontario, Canada

Niagara Centre is a provincial electoral district in Ontario, Canada, represented from 1867 until 1977 and again since 2007 in the Legislative Assembly of Ontario. Its population in 2006 was 112,875.

Niagara Region Transit is a regional public transit system operating in the Niagara Region of Ontario. Initial service commenced on September 12, 2011, and consisted of inter-municipal routes. In January 2023, Niagara Region Transit assumed the operations of Welland Transit, Fort Erie Transit, St. Catharines Transit, and Niagara Falls Transit to form a single unified local transit service for the entire Niagara Region.

<span class="mw-page-title-main">Niagara West (federal electoral district)</span> Federal electoral district in Ontario, Canada

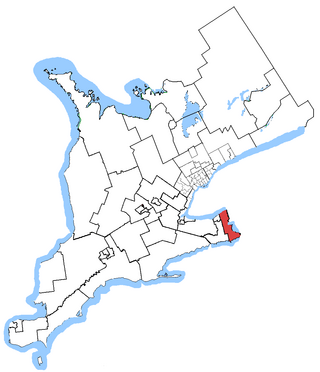
Niagara West is a federal electoral district in Ontario. It encompasses a portion of Ontario formerly included in the electoral districts of Niagara West—Glanbrook, Welland and St. Catharines. It is currently represented by Dean Allison.

Lincoln South was an electoral district of the Legislative Assembly of the Parliament of the Province of Canada, in Canada West. It was created in 1841, upon the establishment of the Province of Canada by the union of Upper Canada and Lower Canada. Lincoln South was represented by one member in the Legislative Assembly. It was amalgamated prior to the election of 1848.

<span class="mw-page-title-main">2022 Niagara Region municipal elections</span> Canadian local elections

Elections were held in the Niagara Region of Ontario on October 24, 2022, in conjunction with municipal elections across the province.

References

  1. 1 2 Statistics Canada: 2016
  2. https://redecoupage-redistribution-2022.ca/com/on/fbnd/35071/index_e.aspx
  3. Government of Canada, Statistics Canada (February 9, 2022). "Profile table, Census Profile, 2021 Census of Population - Niagara Centre [Federal electoral district (2013 Representation Order)], Ontario". www12.statcan.gc.ca. Retrieved March 9, 2023.
  4. Canada, Elections. "Niagara Centre". www.elections.ca.
  5. "List of confirmed candidates – September 20, 2021 Federal Election". Elections Canada . Retrieved September 2, 2021.
  6. "Transposition of Votes from the 44th General Election to the 2023 Representation Orders". Elections Canada . Retrieved April 9, 2024.
  7. "List of confirmed candidates". Elections Canada. Retrieved October 4, 2019.
  8. "Official Voting Results". Elections Canada. Retrieved June 28, 2021.
  9. Canada, Elections. "Voter Information Service - Find your electoral district". www.elections.ca.
  10. Canada, Elections. "Error page". www.elections.ca.
  11. 1 2 "Niagara Centre ELECTORAL DISTRICT NO. 35051". elections.ca. Elections Canada. Archived from the original on April 30, 2002. Retrieved April 24, 2020.
  12. "Final Standings in By-Elections", Toronto Daily Star, February 10, 1942
  13. Sayers, Anthony M. "1872 Federal Election". Canadian Elections Database. Archived from the original on February 3, 2024.


43°00′32″N79°16′48″W / 43.009°N 79.280°W / 43.009; -79.280