The Liberal Party of Canada was re-elected with its fourth consecutive government, winning 191 seats (73 percent of the seats in the House of Commons), with just under 50 percent of the popular vote.
It was the first federal election with Newfoundland voting, having joined Canada in March of that year. It was also the first election since 1904 in which part of the remaining parts of the Northwest Territories were granted representation, following the partitioning off of the provinces of Alberta and Saskatchewan.
The Liberal Party victory won the largest majority in Canadian history to that point. As of 2025[update], it remains the third largest majority government in Canadian history, and the largest in the party's history (the Progressive Conservative Party won larger seat majorities in 1958 and 1984).
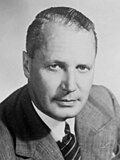
Despite the humiliation of losing his own seat at the previous election, Mackenzie King remained a popular Prime Minister, working to bring about Canadian citizenship as a legal right (Canadians having been previously British subjects), and laying the groundwork for the eventual entry of Newfoundland into the confederation in March 1949. Failing health ultimately forced his resignation in 1948, and his Quebec lieutenant and Secretary for External Affairs, Louis St. Laurent handily won the race to succeed him, beating out fellow cabinet minister James Garfield Gardiner.
The Liberals' polling numbers wavered slightly following St. Laurent's installation as Prime Minister, but they consistently remained well ahead of the Progressive Conservatives, and with the party's polling lead starting to increase again in early 1949, St. Laurent decided to capitalise and called a snap election. While the party had been governing without a stable majority since the previous election, they had generally been able to count on the support of the CCF to pass important legislation; St. Laurent's goal was to win a solid majority and remove his party's need to make concessions to the CCF on matters of confidence.
St. Laurent became the first leader of a major Canadian party to extensively campaign in person since former Conservative leader R. B. Bennett in 1930, projecting an image of himself as a congenial family man. While the campaign was relatively light on actual policy and based mostly around St. Laurent's personality, the approach paid off and saw the Liberals win the biggest parliamentary majority in the country's history until that point (and what remains the Liberals' biggest majority), with the only province where they failed to win at least a plurality of the popular vote being Alberta, where support for Social Credit remained strong; even then, the five seats won in the province by the Liberals has not been matched at any federal election since this one.
Progressive Conservatives
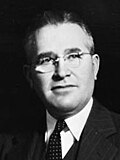
The Progressive Conservative Party, led by former Premier of OntarioGeorge Drew, lost over a third of their seats. Despite the party's mild recovery at the previous election, they proved a largely ineffective opposition and remained far behind the Liberals in polls throughout the 1945-1949 parliament, largely due to in-fighting between the western faction of previous leader John Bracken, and the party's eastern establishment who favoured the installation of Drew as leader. Drew's own reluctance to step away from his role as Premier of Ontario hampered efforts to remove Bracken, and it wasn't until Drew unexpectedly lost his seat in the Ontario legislature in the 1948 provincial election and announced his intention to move into federal politics that Bracken finally resigned.
While Drew won the leadership of the Progressive Conservatives by a landslide over John Diefenbaker in October 1948, his ascension to the party leadership was overshadowed by St. Laurent's own rise to the Prime Minister's office (additionally, Drew was not an MP when he became party leader, causing him to lose a further two months on a by-election to the Carleton riding after both the CCF and Social Credit fielded candidates and actively campaigned against him, going against the then-usual convention of allowing Canadian party leaders to win by-elections without opposition), meaning that he struggled to make an impression in the media. Support for the party declined across the country in the election, but was felt most keenly in Drew's native Ontario, and to a lesser degree in British Columbia. The party thus failed to win even a plurality of the seat count or popular vote in even a single province or territory (although they did come a very close second in the popular vote in Prince Edward Island). Their national popular vote share actually increased by two percentage points, but most of the extra votes were in earned in Quebec, where they accomplished little due to the large majorities held by Liberal MPs.
Co-Operative Commonwealth Federation
After something of a breakthrough in the previous federal election, the CCF struggled to keep up its momentum. Their polling numbers peaked in late 1948 when they came close to moving into second place ahead of the Progressive Conservatives, thanks to party leader Major James Coldwell being able to portray an image of experience compared to the new Liberal and Progressive Conservative leaders, but this increase ebbed away after the turn of the year, once St. Laurent and Drew had been able to establish themselves as leaders of their respective parties.
Despite hopes to exploit renewed western alienation that might be generated by the leaders of the two main parties respectively being from Quebec and Ontario, the CCF were largely unable to capitalise and ended up losing over half their parliamentary caucus. In particular, they were decimated in their political base of Saskatchewan, losing all but five of their seats to the Liberals despite coming a close second in the popular vote, and the relative popularity of Tommy Douglas' provincial CCF government. The only saving grace was that the CCF at least remained the main challengers to the Liberals in the west, coming away with 11 seats west of Ontario compared to 10 and 7 respectively for the Socreds and Progressive Conservatives.
Social Credit Party
For the fourth successive election, Social Credit would only succeed in electing MPs in Alberta, where they continued to control the legislative assembly under PremierErnest Manning. While their vote and seat count also declined, they held up better than the CCF's did, in part because the resignation of Bracken as Conservative leader and the ensuing abandonment of his western populist policies caused some Progressive Conservative supporters to switch their support to the Socreds, stemming losses to the Liberals. The party thus lost three seats to the Liberals, but remained a comfortable first in the province, making them the only party other than the Liberals to win the most seats and/or votes in a province during this election.
This page is based on this Wikipedia article Text is available under the CC BY-SA 4.0 license; additional terms may apply. Images, videos and audio are available under their respective licenses.


 1945
1945 1949
1949


