Peace River (federal electoral district) Last updated February 21, 2025 Former federal electoral district in Alberta, Canada
Peace River electoral district Peace River in relation to the other Alberta federal electoral districts
Legislature House of Commons District created 1924 District abolished 2013 First contested 1925 Last contested 2011 District webpage profile , map Population (2011 ) [ 1] 150,925 Electors (2011) 96,378 Area (km²) [ 2] 168,289.57 Census division(s) Division No. 10 , Division No. 17 , Division No. 19 Census subdivision(s) Grande Prairie , Grande Prairie County No. 1 , Mackenzie County , Peace River , Big Lakes , Greenview No. 16 , High Level , County of Northern Lights , Fairview , Opportunity No. 17
Peace River was a federal electoral district in Alberta , Canada, that was represented in the House of Commons of Canada from 1925 to 2015. It was a rural riding in northwest Alberta, representing Clear Hills County , Saddle Hills County , Birch Hills County , the County of Grande Prairie No. 1 , the County of Northern Lights , Mackenzie County , most of Northern Sunrise County , the Municipal District of Fairview No. 136 , the Municipal District of Peace No. 135 , the Municipal District of Spirit River No. 133 , the Municipal District of Smoky River No. 130 and the northern portion of the Municipal District of Greenview No. 16 . Following the Canadian federal electoral redistribution, 2012 the riding abolished into Grande Prairie-Mackenzie (72%) and Peace River—Westlock (28%).
History This riding was created in 1924 from Edmonton West riding.
Historical boundaries 1924 representation order
1933 representation order
1952 representation order
1966 representation order
1976 representation order
1987 representation order
1996 representation order
2003 representation order
Election results 2011 Canadian federal election Party Candidate Votes % Expenditures Conservative Chris Warkentin 36,334 75.76 +6.25 $103,279 New Democratic Jennifer Villebrun 7,740 16.14 +1.73 $23,470 Green Wayne John Kamieniecki 1,702 3.55 -3.14 $1,379 Liberal Corina Ganton 1,481 3.09 -4.68 $5,605 Independent Russ Toews 359 0.75 – $204 Rhinoceros Donovan Eckstrom 345 0.72 – $0 Total valid votes/Expense limit 47,961 100.00 Total rejected ballots 128 0.27 -0.03 Turnout 48,089 49.70 +4.99 Eligible voters 96,759 – –
2008 Canadian federal election Party Candidate Votes % Expenditures Conservative Chris Warkentin 29,550 69.51 +12.54 $48,906 New Democratic Adele Boucher Rymhs 6,124 14.41 +3.28 $19,142 Liberal Liliane Coutu-Maisonneuve 3,303 7.77 +5.51 $8,462 Green Jennifer Villebrun 2,843 6.69 +4.43 $1,612 Canadian Action Edwin Siggelkow 373 0.88 – $4,711 Libertarian Mélanie Simard 316 0.74 – $1,312 Total valid votes/Expense limit 42,509 100.00 $118,949 Total rejected ballots 129 0.30 +0.07 Turnout 42,638 44.71 -10.0 Conservative hold Swing +4.63
2006 Canadian federal election Party Candidate Votes % Expenditures Conservative Chris Warkentin 27,785 56.97 -8.15 $61,636 Independent Bill Given 9,882 20.26 – $101,905 New Democratic Susan Thompson 5,427 11.13 +0.02 $20,836 Liberal Tanya Kappo 4,573 9.38 -9.58 $4,298 Green Zane Lewis 1,102 2.26 -2.53 $0 Total valid votes 48,769 100.00 Total rejected ballots 113 0.23 -0.06 Turnout 48,882 54.7 +1.0 Conservative hold Swing -14.2
2004 Canadian federal election Party Candidate Votes % Expenditures Conservative Charlie Penson 28,158 65.12 -12.44 $64,760 Liberal Lyle Carlstrom 8,200 18.96 +3.48 $93,798 New Democratic Susan Thompson 4,804 11.11 +4.17 $11,013 Green Benjamin Morrison Pettit 2,073 4.79 – $1,300 Total valid votes 43,235 100.00 Total rejected ballots 125 0.29 +0.03 Turnout 43,360 53.73 -1.33 Conservative hold Swing -7.96
Note: Conservative vote is compared to the total of Progressive Conservative and Canadian Alliance vote in 2000.
2000 Canadian federal election Party Candidate Votes % Expenditures Alliance Charlie Penson 27,508 65.59 +6.66 $45,093 Liberal Kim Ksenia Fenton 6,495 15.48 -3.61 $5,773 Progressive Conservative Milton Hommy 5,021 11.97 -4.12 $10,973 New Democratic Patricia Lawrence 2,914 6.94 +1.08 $6,931 Total valid votes 41,938 100.00 Total rejected ballots 111 0.26 +0.05 Turnout 42,049 55.06 +1.42
Note: Canadian Alliance vote is compared to the Reform vote in 1997.
1997 Canadian federal election Party Candidate Votes % Expenditures Reform Charlie Penson 22,351 58.93 -1.28 $55,260 Liberal David A. Biltek 7,241 19.09 +3.57 $60,269 Progressive Conservative John Simpson 6,104 16.09 +1.73 $39,665 New Democratic Ray A. Domeij 2,226 5.86 +0.38 $7,223 Total valid votes 37,922 100.00 Total rejected ballots 77 0.21 Turnout 37,999 53.64
Note: NDP vote is compared to CCF vote in 1958 election.
Note: Progressive Conservative vote is compared to "National Government" vote in 1940 election. Social Credit vote is compared to New Democracy vote in 1940 election.
Note: New Democracy vote is compared to Social Credit vote in 1935 election.
Note: UFA vote is compared to Progressive vote in 1925 election.
This page is based on this
Wikipedia article Text is available under the
CC BY-SA 4.0 license; additional terms may apply.
Images, videos and audio are available under their respective licenses.
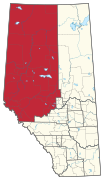 1924 representation order
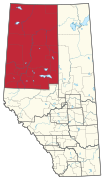 1933 representation order
 1952 representation order
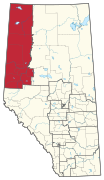 1966 representation order
 1976 representation order
 1987 representation order
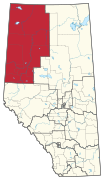 1996 representation order
 2003 representation order


