Mount Royal (electoral district)

Last updated

Mount Royal
Flag of Quebec.svg Quebec electoral district
Mount Royal (Canadian electoral district).svg
Mount Royal in relation to other federal electoral districts in Montreal and Laval
Federal electoral district
Legislature House of Commons
MP


Anthony Housefather
Liberal
District created1924
First contested 1925
Last contested 2021
District webpage profile, map
Demographics
Population (2016) [1] 103,320
Electors (2019)73,163
Area (km²) [2] 23
Pop. density (per km²)4,492.2
Census division(s) Montreal
Census subdivision(s) Montreal (part), Côte Saint-Luc, Mont Royal, Hampstead

Mount Royal (French : Mont-Royal) is a federal electoral district in Quebec, Canada, that has been represented in the House of Commons of Canada since 1925. Its population in 2006 was 98,888.

Contents

The riding is among the strongest Liberal ridings in the country. Réal Caouette, long-time leader of the Social Credit Party in Quebec, once said that a mailbox could win the Liberal nomination in Mount Royal and still win election just because it was red (the traditional colour of the Liberal Party). The Liberals have held the riding continuously since 1940, and have only been seriously threatened three times since then—in 1958, 1984 and 2011.

Its best-known MP is former Prime Minister Pierre Trudeau, who represented the riding from 1965 to 1984. Its current MP, Anthony Housefather, was elected on 19 October 2015, garnering 50.3% of the vote, [3] and was profiled as one of 10 rookie MPs to watch in the new parliament. [4]

The riding's English name was eliminated in the 2012 electoral redistribution but was reversed by the Riding Name Change Act, 2014.

The riding has a large Jewish population, the second-largest in Canada at 30.7 percent. [5] It is one of only two ridings in Canada with a Jewish plurality (the other being Thornhill in the Regional Municipality of York in Ontario).[ citation needed ]

Geography

The district includes the City of Côte Saint-Luc, the Towns of Mount Royal and Hampstead, the neighbourhood of Snowdon and the western part of the neighbourhood of Côte-des-Neiges in the city of Montreal, Quebec.

Demographics

According to the 2011 Canadian census [6]

Ethnic groups: 62.1% White, 10.8% Filipino, 6.3% Black, 5.5% South Asian, 3.4% Arab, 3.3% Southeast Asian, 2.9% Chinese, 2.1% Latino, 1.2% West Asian, 2.4% Other
Languages: 33.0% English, 23.8% French, 5.4% Tagalog, 4.2% Russian, 3.5% Arabic, 2.9% Spanish, 2.4% Chinese, 2.2% Romanian, 1.9% Tamil, 1.8% Vietnamese, 1.7% Hebrew, 1.7% Yiddish, 1.6% Italian, 1.4% Bengali, 1.2% Greek, 1.2% Persian, 10.1% Other
Religions: 44.4% Christian, 30.7% Jewish, 7.4% Muslim, 2.8% Hindu, 2.1% Buddhist, 0.3% Other, 12.3% None
Median income: $24,313 (2010)
Average income: $48,466 (2010)

According to the 2016 Canadian census

History

The electoral district was created in 1924 mostly from Jacques-Cartier, Westmount—Saint-Henri and Laurier—Outremont ridings, with small parts taken from St. Antoine and St. Lawrence—St. George. The electoral district was actually abolished twice since 1924, in 1966 and in 1987; however, the district to replace it kept the same name and incumbent both times. Between the 1935 and 1949 elections, the riding did not contain any of the Town of Mount Royal, and was instead based in Notre-Dame-de-Grâce and Montreal West.

This riding remained largely intact during the 2012 electoral redistribution, losing a small (uninhabited) territory to Outremont.

Former boundaries

Members of Parliament

This riding has elected the following members of Parliament:

ParliamentYearsMemberParty
Mount Royal
Riding created from Jacques-Cartier, Laurier—Outremont,
Westmount—St. Henri, St. Antoine and St. Lawrence—St. George
15th  1925–1926   Robert Smeaton White Conservative
16th  1926–1930
17th  1930–1935
18th  1935–1940 William Allen Walsh
19th  1940–1945   Fred Whitman Liberal
20th  1945–1949
21st  1949–1953 Alan Macnaughton
22nd  1953–1957
23rd  1957–1958
24th  1958–1962
25th  1962–1963
26th  1963–1965
27th  1965–1968 Pierre Trudeau
28th  1968–1972
29th  1972–1974
30th  1974–1979
31st  1979–1980
32nd  1980–1984
33rd  1984–1988 Sheila Finestone
34th  1988–1993
35th  1993–1997
36th  1997–1999
 1999–2000 Irwin Cotler
37th  2000–2004
38th  2004–2006
39th  2006–2008
40th  2008–2011
41st  2011–2015
42nd  2015–2019 Anthony Housefather
43rd  2019–2021
44th  2021–present

Election results

2021 Canadian federal election
PartyCandidateVotes%±%Expenditures
Liberal Anthony Housefather 23,29257.71+1.42$93,203.95
Conservative Frank Cavallaro9,87124.46-0.47$16,697.71
New Democratic Ibrahim Bruno El-Khoury3,3788.37+0.11$575.63
Bloc Québécois Yegor Komarov1,5823.92-0.10$2,242.01
Green Clement Badra1,0852.78-2.69$638.61
People's Zachary Lozoff1,0532.61+1.78$0.00
Marxist–Leninist Diane Johnston960.24+0.04$0.00
Total valid votes/Expense limit40,357$107,092.98
Total rejected ballots
Turnout56.72-3.69
Eligible voters71,153
Liberal hold Swing +0.94
Source: Elections Canada [8]
2019 Canadian federal election
PartyCandidateVotes%±%Expenditures
Liberal Anthony Housefather 24,59056.30+5.95$75,605.49
Conservative David Tordjman10,88724.93-12.96$80,742.48
New Democratic Eric-Abel Baland3,6098.26+0.18none listed
Green Clément Badra2,3895.47+3.92$4,397.05
Bloc Québécois Xavier Levesque1,7574.02+2.12none listed
People's Zachary Lozoff3620.83$0.00
Marxist–Leninist Diane Johnston850.19-0.07$0.00
Total valid votes/expense limit43,67998.68
Total rejected ballots5831.32
Turnout44,26260.41
Eligible voters73,273
Liberal hold Swing +9.46
Source: Elections Canada [9] [10]
2015 Canadian federal election
PartyCandidateVotes%±%Expenditures
Liberal Anthony Housefather 24,18750.34+8.93$95,380.32
Conservative Robert Libman 18,20137.88+2.27$157,866.00
New Democratic Mario Jacinto Rimbao3,8848.08-9.77$8,395.91
Bloc Québécois Jade Bossé-Bélanger9081.90-1.01$198.94
Green Timothy Landry7471.55-0.20
Marxist–Leninist Diane Johnston1240.26-0.02
Total valid votes/Expense limit48,051100.00$207,183.11
Total rejected ballots4250.88
Turnout48,47665.18+7.54
Eligible voters74,374
Liberal hold Swing +6.66
Source: Elections Canada [11] [12]
2011 Canadian federal election
PartyCandidateVotes%±%Expenditures
Liberal Irwin Cotler 16,15141.41-14.24
Conservative Saulie Zajdel 13,89135.61+8.28
New Democratic Jeff Itcush6,96317.85+10.13
Bloc Québécois Gabriel Dumais1,1362.91-1.45
Green Brian Sarwer-Foner6831.75-2.67
Marxist–Leninist Diane Johnston1090.28+0.01
Independent Abraham Weizfeld740.19
Total valid votes/Expense limit39,007100.00
Total rejected ballots3120.79+0.04
Turnout39,31957.64+5.34
2008 Canadian federal election
PartyCandidateVotes%±%Expenditures
Liberal Irwin Cotler 19,70255.65-9.90$70,302
Conservative Rafael Tzoubari9,67627.33+9.43$63,120
New Democratic Nicolas Thibodeau2,7337.72+1.02$3,089
Green Tyrell Alexander1,5654.42+0.57$600
Bloc Québécois Maryse Lavallée1,5434.36-1.35$6,931
Marxist–Leninist Diane Johnston970.27-0.02
Communist Antonio Artuso890.25$907
Total valid votes/Expense limit35,405100.00 $80,838
Total rejected ballots268 0.75+0.06
Turnout35,67352.30-0.51
2006 Canadian federal election
PartyCandidateVotes%±%Expenditures
Liberal Irwin Cotler 24,24865.55-10.13$66,099
Conservative Neil Martin Drabkin6,62117.90+9.27$41,404
New Democratic Nicolas Thibodeau2,4796.70+1.79$2,810
Bloc Québécois Guillaume Dussault2,1125.71-1.25$8,542
Green Damien Pichereau1,4233.85+1.09
Marxist–Leninist Diane Johnston1060.29+0.04
Total valid votes/Expense limit36,989 100.00 $75,740
Total rejected ballots2410.65-0.18
Turnout37,23052.81-0.59
2004 Canadian federal election
PartyCandidateVotes%±%Expenditures
Liberal Irwin Cotler 28,67075.68-5.56$79,191
Conservative Matthew Fireman3,2718.63-1.02$16,501
Bloc Québécois Vincent Gagnon2,6366.96+2.69$5,960
New Democratic Sébastien Beaudet1,8594.91+2.37$2,199
Green Adam Sommerfeld1,0462.76+1.09
Marijuana Adam Greenblatt3080.81
Marxist–Leninist Diane Johnston940.25
Total valid votes/Expense limit37,884 100.00 $74,792
Total rejected ballots3170.83
Turnout38,20153.40

Note: Conservative vote is compared to the total of the Canadian Alliance vote and Progressive Conservative vote in 2000 election.

2000 Canadian federal election
PartyCandidateVotes%±%
Liberal Irwin Cotler 33,11881.24-10.74
Progressive Conservative Stephane Gelgoot2,4896.11+2.34
Bloc Québécois Jean-Sebastien Houle1,7404.27+2.03
Alliance Alex Gabanski1,4443.54
New Democratic Maria Pia Chávez1,0342.54+0.52
Green Jean-Claude Balu6811.67
Communist Judith Chafoya1400.34
Natural Law Ena Kahn1220.30
Total valid votes40,768100.00
Canadian federal by-election, 15 November 1999
PartyCandidateVotes%±%
Resignation of Sheila Finestone, 10 August 1999
Liberal Irwin Cotler 15,82091.98+29.72
Progressive Conservative Noel Earl Alexander6483.77-6.58
Bloc Québécois Mathieu Alarie3852.24-1.86
New Democratic Serge Granger3472.02+0.02
Total valid votes17,200100.00

Note: Canadian Alliance vote is compared to the Reform vote in 1997 election.

1997 Canadian federal election
PartyCandidateVotes%±%
Liberal Sheila Finestone 30,11562.26-20.68
Independent Howard Galganov 10,09020.86
Progressive Conservative Carolyn Steinman5,00610.35+4.57
Bloc Québécois Jacques Thibaudeau1,9814.10-2.86
New Democratic Adam Giambrone 9662.00+0.33
Natural Law Ena Kahn2110.44-0.21
Total valid votes48,369100.00
1993 Canadian federal election
PartyCandidateVotes%±%
Liberal Sheila Finestone 39,59882.94+23.09
Bloc Québécois Guillaume Dumas3,3246.96
Progressive Conservative Neil Drabkin2,7585.78-26.17
New Democratic Michael Richard Werbowski7961.67-3.70
Independent Harry Polansky5371.12
Natural Law Ken Matthews3120.65
National Kurtis Law3000.63
Commonwealth of Canada Georges Duchesnay710.15-0.09
Abolitionist Marie Vienneau470.10
Total valid votes47,743100.00
1988 Canadian federal election
PartyCandidateVotes%±%
Liberal Sheila Finestone 27,35459.85+12.38
Progressive Conservative Robert Presser14,60131.95-7.14
New Democratic Tariq Alvi2,4555.37-4.52
Rhinoceros Lady Be Ann Poulin5121.12-0.50
Green Daniel Reicher4380.96
Independent Barry Goodman1650.36
Commonwealth of Canada Paul G. Fraleigh1080.24+0.07
Independent Abe Rosner680.15
Total valid votes45,701 100.00
1984 Canadian federal election
PartyCandidateVotes%±%
Liberal Sheila Finestone 22,71647.47-33.76
Progressive Conservative Sharon Wolfe18,70739.09+28.52
New Democratic Nancy Pearson4,7359.89+4.23
Rhinoceros Claude Parachute Racine7761.62-0.10
Parti nationaliste André Daoust3920.82
Libertarian Victor Lévis3380.71+0.41
Independent Mark Sholzberg1100.23
Commonwealth of Canada Guy R. Huard800.17
Total valid votes47,854100.00
1980 Canadian federal election
PartyCandidateVotes%±%
Liberal Pierre Trudeau 33,82181.23-3.9
Progressive Conservative Harry Bloomfield4,40210.57+3.4
New Democratic David C. Winch2,3565.66+1.7
Rhinoceros Michel Flybin Rivard 7151.72+0.4
Independent Gordon Edwards1490.36
Libertarian Eddie Paul1260.30
Marxist–Leninist Liz Watkins680.16+0.0
Total valid votes41,637 100.00
1979 Canadian federal election
PartyCandidateVotes%±%
Liberal Pierre Trudeau 43,20285.2+10.2
Progressive Conservative J. David Dejong3,6607.2-6.1
New Democratic David C. Winch2,0234.0-5.8
Social Credit Laflèche Trudeau1,0492.11.1
Rhinoceros Jacques Ferron6491.3
Communist David G. Johnston810.2
Marxist–Leninist Robert Verrier610.1-0.3
Total valid votes50,725 100.0
1974 Canadian federal election
PartyCandidateVotes%±%
Liberal Pierre Trudeau 32,16675.0-5.6
Progressive Conservative Émile Mashaal5,72313.3+3.6
New Democratic Joe Rabinovitch4,2149.8+2.7
Social Credit Bertrand Marcil4141.0-0.4
Independent Edward J. Sommer2110.5
Marxist–Leninist Robert A. Cruise1620.4+0.2
Total valid votes42,890 100.0
1972 Canadian federal election
PartyCandidateVotes%±%
Liberal Pierre Trudeau 36,87580.6-10.1
Progressive Conservative Andrew Albert Brichant4,4469.7+5.0
New Democratic Harry Yudin3,2747.2+3.3
Social Credit Alexander O. Bronstein6251.4+1.2
Independent Gaston Miron4330.9
Independent Robert A. Cruise800.2
Total valid votes45,733 100.0

Note: Social Credit vote is compared to Ralliement créditiste vote in the 1968 election.

1968 Canadian federal election
PartyCandidateVotes%±%
Liberal Pierre Trudeau 37,40290.8+35.1
Progressive Conservative Huguette Marleau1,9654.8-8.8
New Democratic Jussy Brainin1,5833.8-25.8
Independent Walter Gallagher1820.4
Ralliement créditiste Michel Lamonde800.2-1.0
Total valid votes41,212 100.0
1965 Canadian federal election
PartyCandidateVotes%±%
Liberal Pierre Trudeau 28,06455.6-14.7
New Democratic Charles Taylor 14,92929.6+13.1
Progressive Conservative Peter S. Wise6,84013.6+2.9
Ralliement créditiste Michel Smith5981.2-1.3
Total valid votes50,431 100.0

Note: Ralliement créditiste vote is compared to Social Credit vote in the 1963 election.

1963 Canadian federal election
PartyCandidateVotes%±%
Liberal Alan Macnaughton 37,64870.4+7.3
New Democratic Charles Taylor 8,85516.5+3.8
Progressive Conservative Thomas Joseph Coonan5,69310.6-12.0
Social Credit Austin G. Gordon1,3182.5+0.8
Total valid votes53,514 100.0
1962 Canadian federal election
PartyCandidateVotes%±%
Liberal Alan Macnaughton 31,65463.0+14.6
Progressive Conservative Stanley Shenkman11,35222.6-24.7
New Democratic Charles Taylor 6,38812.7+8.4
Social Credit Henri-J. Bernard8451.7
Total valid votes50,239 100.0

Note: NDP vote is compared to CCF vote in 1958 election.

1958 Canadian federal election
PartyCandidateVotes%±%
Liberal Alan Macnaughton 22,05148.4-12.0
Progressive Conservative Reginald J. Dawson21,56247.3+11.4
Co-operative Commonwealth Harold Atwill1,9524.3+0.6
Total valid votes45,565 100.0
1957 Canadian federal election
PartyCandidateVotes%±%
Liberal Alan Macnaughton 23,33060.4-1.2
Progressive Conservative George Brown13,86135.9+2.0
Co-operative Commonwealth Harold Atwill1,4203.7+1.9
Total valid votes38,611 100.0
1953 Canadian federal election
PartyCandidateVotes%±%
Liberal Alan Macnaughton 17,18361.7-2.2
Progressive Conservative Dudley Holden Kerr9,46033.9-0.1
Labor–Progressive Norman Nerenberg7272.6
Co-operative Commonwealth Ross Worrall5001.8-0.3
Total valid votes27,870 100.0
1949 Canadian federal election
PartyCandidateVotes%
Liberal Alan Macnaughton 21,65463.8
Progressive Conservative Earle Moore11,55034.0
Co-operative Commonwealth Ross Edward Worrall7192.1
Total valid votes33,923 100.0
1945 Canadian federal election
PartyCandidateVotes%±%
Liberal Frederick Primrose Whitman 20,92546.76-9.72
Progressive Conservative St. Clair Holland17,79839.77+1.89
Co-operative Commonwealth John Stanley Allen3,6088.06+2.42
Independent PCGilbert Layton1,2702.84
Labor–Progressive Beryl Truax1,1472.56
Total valid votes44,748 100.0
Liberal hold Swing -5.80

Note: Progressive Conservative vote is compared to "National Government" vote in 1940 election.

1940 Canadian federal election
PartyCandidateVotes%±%
Liberal Frederick Primrose Whitman 19,85856.48+19.96
National Government William Allen Walsh 13,31937.88-11.57
Co-operative Commonwealth John Stanley Allen1,9835.64+1.14
Total valid votes35,160 100.0
Liberal gain from Conservative Swing +15.76

Note: "National Government" vote is compared to Conservative vote in 1935 election.

1935 Canadian federal election
PartyCandidateVotes%±%
Conservative William Allen Walsh 16,20349.44-26.01
Liberal Adam Kirk Cameron11,96736.52+11.98
Reconstruction Clifford Henry Cheasley2,7828.49
Co-operative Commonwealth Lloyd B. Almond1,4734.50
Independent Thomas Henry Carveth3431.05
Total valid votes32,768 100.0
Conservative hold Swing -18.99
1930 Canadian federal election
PartyCandidateVotes%±%
Conservative Robert Smeaton White 19,93275.46-0.55
Liberal Octavia Grace Ritchie England 6,48324.54+0.55
Total valid votes26,415 100.0
Conservative hold Swing -0.55
1926 Canadian federal election
PartyCandidateVotes%±%
Conservative Robert Smeaton White 14,24976.00+6.33
Liberal Thomas Henry Carveth4,49924.00
Total valid votes18,748 100.0
1925 Canadian federal election
PartyCandidateVotes%
Conservative Robert Smeaton White 16,37769.67
Independent LiberalRobert Louis Calder7,12930.33
Total valid votes23,506 100.0

See also

Related Research Articles

<span class="mw-page-title-main">Louis-Hébert (federal electoral district)</span> Federal electoral district in Quebec, Canada

Louis-Hébert is a federal electoral district in the Canadian province of Quebec. Represented in the House of Commons since 1968, its population was certified, according to the detailed statistics of 2001, as 98,156.

<span class="mw-page-title-main">Saint-Hyacinthe—Bagot</span> Federal electoral district in Quebec, Canada

Saint-Hyacinthe—Bagot is a federal electoral district that has been represented in the House of Commons of Canada since 1935. It is located in Quebec, Canada. Its population in 2006 was 95,983. In the 2015 election, the winner received the lowest vote percentage of any winning candidate in the country.

<span class="mw-page-title-main">Hochelaga (electoral district)</span> Federal electoral district in Quebec, Canada

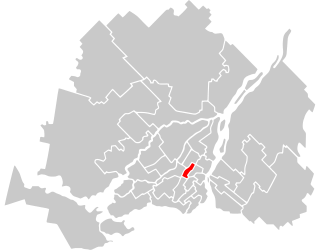
Hochelaga is a federal electoral district in Quebec, Canada, that has been represented in the House of Commons of Canada from 1867 to 1988 and since 2004.

<span class="mw-page-title-main">Outremont (electoral district)</span> Federal electoral district in Quebec, Canada

Outremont is a federal electoral district in Montreal, Quebec, Canada, that has been represented in the House of Commons of Canada since 1935. It was known as Outremont—Saint-Jean from 1947 to 1966. Its population in 2006 was 95,711. Its current Member of Parliament is Rachel Bendayan of the Liberal Party of Canada.

<span class="mw-page-title-main">Papineau (electoral district)</span> Federal electoral district in Quebec, Canada

Papineau is a federal electoral district in Montreal, Quebec, Canada, that has been represented in the House of Commons of Canada since 1948. Its population in 2016 was 110,750. Justin Trudeau, the Prime Minister of Canada and Leader of the Liberal Party, has represented the riding since the 2008 federal election. Trudeau became Liberal leader in a 2013 leadership election, succeeding Bob Rae, and prime minister when the Liberals returned to government in the 2015 Canadian federal election, succeeding Conservative leader Stephen Harper.

<span class="mw-page-title-main">Ahuntsic (federal electoral district)</span> Federal electoral district in Quebec, Canada

Ahuntsic was a federal electoral district in Quebec, Canada, that was represented in the House of Commons of Canada from 1968 to 1979 and from 1988 to 2015.

<span class="mw-page-title-main">Longueuil—Saint-Hubert</span> Federal electoral district in Quebec, Canada

Longueuil—Saint-Hubert is a federal electoral district in Quebec, Canada, represented in the House of Commons of Canada from since 2015
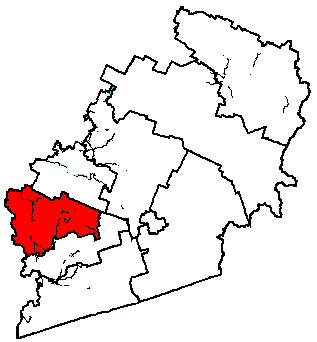
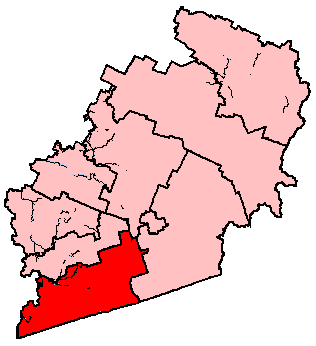
<span class="mw-page-title-main">Shefford (federal electoral district)</span> Federal electoral district in Quebec, Canada

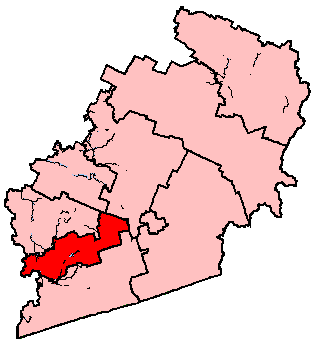
Shefford is a federal electoral district in Quebec, Canada, that has been represented in the House of Commons of Canada since 1867. Its population in 2006 was 100,000.

<span class="mw-page-title-main">Portneuf—Jacques-Cartier</span> Federal electoral district in Quebec, Canada

Portneuf—Jacques-Cartier is a federal electoral district in Quebec, Canada, that has been represented in the House of Commons of Canada since 1867. Its population in 2001 was 87,141. It is currently represented by Joël Godin of the Conservative Party of Canada.

<span class="mw-page-title-main">Joliette (electoral district)</span> Federal electoral district in Quebec, Canada

Joliette is a federal electoral district in Quebec, Canada, that has been represented in the House of Commons of Canada from 1867 to 1935 and since 1968.

<span class="mw-page-title-main">Pontiac (federal electoral district)</span> Federal electoral district in Quebec, Canada

Pontiac is a federal electoral district in western Quebec, Canada, that has been represented in the House of Commons of Canada from 1867 to 1949 and since 1968.

Chicoutimi—Le Fjord is a federal electoral district in Quebec, Canada, that has been represented in the House of Commons of Canada since 1925. The riding consists of the northern part of the Chicoutimi borough of Saguenay, as well as the La Baie borough and the municipalities of Ferland-et-Boilleau, L'Anse-Saint-Jean, Petit-Saguenay, Rivière-Éternité and Saint-Félix-d'Otis and the unorganized territory of Lalemant.

<span class="mw-page-title-main">Gatineau (federal electoral district)</span> Federal electoral district in Quebec, Canada

Gatineau is a federal electoral district in Quebec, Canada, represented in the House of Commons of Canada from since 1949. Between 1987 and 1996, it was known as "Gatineau—La Lièvre".

<span class="mw-page-title-main">Brome—Missisquoi</span> Federal electoral district in Quebec, Canada

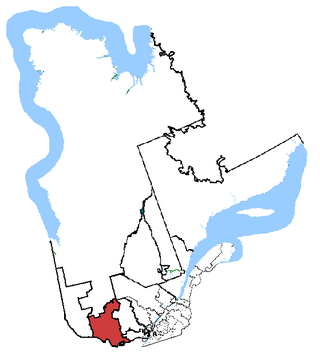
Brome—Missisquoi is a federal electoral district in Quebec, Canada, that has been represented in the House of Commons of Canada since 1925. The original electoral district of Missiquoi existed from 1867 to 1925.

<span class="mw-page-title-main">Drummond (federal electoral district)</span> Federal electoral district in Quebec, Canada

Drummond is a federal electoral district in Quebec, Canada, that has been represented in the House of Commons of Canada since 1968. It was created in 1966 from Drummond—Arthabaska, Nicolet—Yamaska and Richmond—Wolfe.

<span class="mw-page-title-main">Hull—Aylmer</span> Federal electoral district in Quebec, Canada

Hull—Aylmer is a federal electoral district in Quebec, Canada, that has been represented in the House of Commons of Canada since 1917.

<span class="mw-page-title-main">Saint-Jean (federal electoral district)</span> Federal electoral district in Quebec, Canada

Saint-Jean is a federal electoral district in Quebec, Canada, that has been represented in the House of Commons of Canada since 1968.

<span class="mw-page-title-main">Sherbrooke (federal electoral district)</span> Federal electoral district in Quebec, Canada

Sherbrooke is a federal electoral district in Quebec, Canada, that has been represented in the House of Commons of Canada since 1925.

<span class="mw-page-title-main">Trois-Rivières (federal electoral district)</span> Federal electoral district in Quebec, Canada

Trois-Rivières is an electoral district in Quebec, Canada that has been represented in the House of Commons of Canada from 1867 to 1892 and from 1935 to the present.

<span class="mw-page-title-main">Terrebonne (federal electoral district)</span> Federal electoral district in Quebec, Canada

Terrebonne is a federal electoral district in the Canadian province of Quebec. It was represented in the House of Commons of Canada from 1867 to 1997, when it was dissolved in an electoral redistribution. It was reconstituted as an electoral district again beginning with the 2015 election.

References

Riding history from the Library of Parliament:

Notes

Parliament of Canada
Preceded by Riding represented by the prime minister
1968–1979
Succeeded by
Preceded by Riding represented by the prime minister
1980–1984
Succeeded by
Vacant; next was Manicouagan, in 1984

45°31′00″N73°38′30″W / 45.51667°N 73.64167°W / 45.51667; -73.64167