Canadian federal election results in Central Quebec

Last updated
Electoral history
YearResults
2019
2015
2011
2008
2006
2004
2000
1997
1993
1988
1984
1980
1979
1974
1972
1968
1965
1963
1962
1958
1957
1953
1949
1945
1940
1935
1930
1926
1925

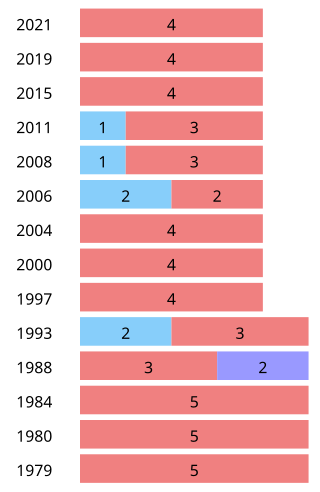
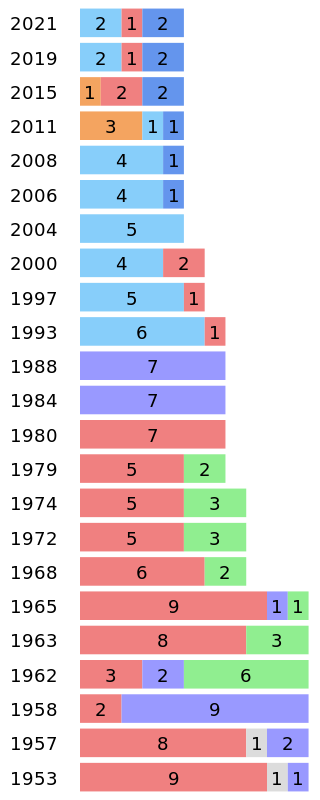
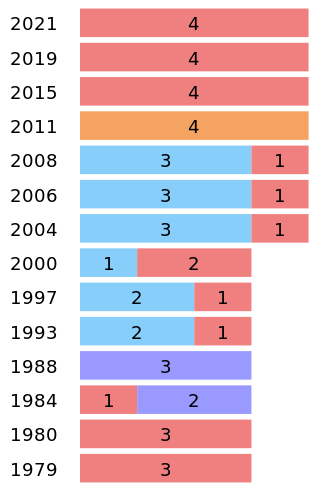
Canadian federal elections have provided the following results in Central Quebec .

Contents

Regional profile

This area was one of the power bases for the Bloc Québécois for two decades. In fact, before 2011, the BQ won at least seven of its nine seats in each of the preceding four elections, losing Saint-Maurice (Jean Chrétien's old riding) in 1993, 1997 and 2000 and Portneuf in 2000, which both went Liberal. They swept all nine ridings in 2004, and in 2006 and 2008 lost only Lotbinière—Chutes-de-la-Chaudière to the Conservatives and Portneuf-Jacques-Cartier to independent candidate André Arthur.

Before the rise of Mulroney in 1984, this area was traditionally Liberal, except for Joliette (the only riding in Quebec that voted anything other than Liberal in 1980), and Lotbinière (which voted Social Credit in 1979). Mulroney's Conservatives swept the area in 1988, and 1984 (except for Chrétien's seat).

The 2011 NDP surge saw New Democrats sweeping all but two seats in the region, with the Conservatives and Bloc Québécois holding one each. In 2015, Bloc Québécois rebounded to take three more ridings, while the Liberals regained Saint-Maurice—Champlain. Bloc Québécois continued to regain its place in 2019, taking out the NDP.

Votes by party throughout time

Election Liberal Bloc Québécois New Democratic Conservative Green PC Reform /
Alliance
Social
Credit
Others
1979 180,520
54.6%
10,132
3.1%
65,566
19.8%
57,091
17.3%
17,125
5.2%
1980 201,928
63.1%
26,657
8.3%
71,297
22.3%
9,698
3.0%
10,656
3.3%
1984 122,290
33.3%
17,039
4.6%
No candidate213,934
58.2%
14,366
3.9%
1988 85,664
23.0%
56,877
15.3%
7,877
2.1%
217,759
58.6%
3,482
0.9%
1993 108,726
26.9%
226,747
56.0%
4,132
1.0%
No candidate58,666
14.5%
No candidate6,564
1.6%
1997 100,304
25.5%
188,654
48.0%
6,172
1.6%
No candidate95,181
24.2%
No candidate3,085
0.8%
2000 155,710
37.3%
204,655
49.1%
5,247
1.3%
No candidate18,551
4.4%
26,063
6.2%
6,880
1.6%
2004 98,817
23.2%
252,754
59.3%
13,852
3.3%
46,035
10.8%
12,259
2.9%
Merged into
Conservative Party
2,367
0.6%
2006 42,3969
9.2%
224,855
48.0%
29,358
6.3%
134,839
28.8%
15,929
3.4%
20,529
4.4%
2008 75,203
16.2%
212,387
45.6%
53,097
11.4%
93,581
20.1%
14,905
3.2%
16,107
3.5%
2011 40,576
8.2%
138,443
27.8%
223,402
44.9%
66,743
13.4%
12,486
2.5%
15,569
3.1%
2015 141,558
26.9%
131,178
25.0%
131,007
24.9%
108,824
20.7%
10,078
1.9%
2,858
0.5%
2019 121,949
22.8%
219,889
41.2%
54,311
10.2%
110,431
20.7%
17,270
3.2%
9,917
1.9%
2021 115,940
22.5%
199,010
38.7%
46,765
9.1%
124,578
24.2%
6,126
1.2%
22,314
4.3%
Canadian federal election results in Central Quebec (Share of votes).svg
Election statistics in Eastern Quebec

2019

edit
Electoral districtCandidatesIncumbent
LiberalConservativeBQNDPGreenPPCOther
Bécancour—Nicolet—Saurel Nathalie Rochefort
9,332
17.83%
Pierre-André Émond
8,434
16.11%
Louis Plamondon
29,653
56.66%
Carole Lennard
2,732
5.22%
David Turcotte
1,697
3.24%
Richard Synnott
489
0.93%
Louis Plamondon
Berthier—Maskinongé Christine Poirier
7,796
13.83%
Josée Bélanger
5,812
10.31%
Yves Perron
21,200
37.62%
Ruth Ellen Brosseau
19,698
34.95%
Éric Laferrière
1,008
1.79%
Luc Massé
428
0.76%
Alain Bélanger (Ind.)
154
0.27%
Martin Acetaria Caesar Jubinville (Rhino.)
151
0.27%
Danny Légaré (Mar.)
107
0.19%
Ruth Ellen Brosseau
Joliette Michel Bourgeois
12,995
22.52%
Jean-Martin Masse
5,176
8.97%
Gabriel Ste-Marie
33,590
58.22%
Julienne Soumaoro
2,623
4.55%
Érica Poirier
2,343
4.06%
Sylvain Prescott
498
0.86%
Paul Savard (PIQ)
474
0.82%
Gabriel Ste-Marie
Lévis—Lotbinière Ghislain Daigle
10,761
16.95%
Jacques Gourde
28,297
44.57%
François-Noël Brault
15,921
25.08%
Christel Marchand
4,355
6.86%
Patrick Kerr
1,908
3.01%
Marc Fontaine
2,247
3.54%
Jacques Gourde
Montcalm Isabel Sayegh
11,200
20.44%
Gisèle Desroches
4,942
9.02%
Luc Thériault
31,791
58.01%
Julian Bonello-Stauch
3,514
6.41%
Mathieu Goyette
2,416
4.41%
Hugo Clénin
524
0.96%
Marc Labelle (PIQ)
419
0.76%
Luc Thériault
Portneuf—Jacques-Cartier Annie Talbot
12,876
19.91%
Joël Godin
28,110
43.46%
Mathieu Bonsaint
15,707
24.29%
David-Roger Gagnon
3,758
5.81%
Marie-Claude Gaudet
2,308
3.57%
Luca Abbatiello
1,915
2.96%
Joël Godin
Repentigny Josée Larose
18,111
27.67%
Pierre Branchaud
4,878
7.45%
Monique Pauzé
34,837
53.22%
Meryem Benslimane
4,470
6.83%
Diane Beauregard
2,289
3.50%
Samuel Saint-Laurent
524
0.80%
Micheline Boucher Granger (PIQ)
347
0.53%
Monique Pauzé
Saint-Maurice—Champlain François-Philippe Champagne
23,104
39.55%
Bruno-Pier Courchesne
9,542
16.34%
Nicole Morin
19,950
34.15%
Barthélémy Boisguérin
3,071
5.26%
Stéphanie Dufresne
1,809
3.10%
Julie Déziel
938
1.61%
François-Philippe Champagne
Trois-Rivières Valérie Renaud-Martin
15,774
26.06%
Yves Lévesque
15,240
25.17%
Louise Charbonneau
17,240
28.48%
Robert Aubin
10,090
16.67%
Marie Duplessis
1,492
2.46%
Marc André Gingras
565
0.93%
Ronald St-Onge Lynch (Ind.)
137
0.23%
Robert Aubin

2015

edit
Electoral districtCandidatesIncumbent
ConservativeNDPLiberalBQGreenOther
Bécancour—Nicolet—Saurel Yves Laberge
5,955
11.41%
Nicolas Tabah
11,531
22.09%
Claude Carpentier
12,666
24.26%
Louis Plamondon
20,871
39.98%
Corina Bastiani
1,182
2.26%
Louis Plamondon
Bas-Richelieu—Nicolet—Bécancour
Berthier—Maskinongé Marianne Foucrault
5,548
10.20%
Ruth Ellen Brosseau
22,942
42.17%
Pierre Destrempes
11,032
20.28%
Yves Perron
14,037
25.80%
Cate Burton
847
1.56%
Ruth Ellen Brosseau
Joliette Soheil Eid
5,705
10.06%
Danielle Landreville
14,566
25.69%
Michel Bourgeois
15,995
28.22%
Gabriel Ste-Marie
18,875
33.30%
Mathieu Morin
1,335
2.35%
Robert D. Morais (SD)
213
0.38%
Francine Raynault§
Lévis—Lotbinière Jacques Gourde
31,357
50.10%
Hélène Bilodeau
9,246
14.77%
Claude Boucher
13,562
21.67%
Steve Gagné
7,163
11.44%
Tina Biello
1,124
1.80%
François Belanger (AOTN)
136
0.22%
Jacques Gourde
Lotbinière—Chutes-de-la-Chaudière
Montcalm Gisèle DesRoches
5,093
9.61%
Martin Leclerc
12,431
23.45%
Louis-Charles Thouin
14,484
27.32%
Luc Thériault
19,405
36.61%
Yumi Yow Mei Ang
976
1.84%
Manon Perreault (SD)
620
1.17%
Manon Perreault [lower-alpha 1]
Portneuf—Jacques-Cartier Joël Godin
27,290
43.97%
Élaine Michaud
13,686
22.05%
David Gauvin
13,322
21.47%
Raymond Harvey
6,665
10.74%
Johanne Morin
1,096
1.77%
Élaine Michaud
Repentigny Jonathan Lefebvre
7,053
10.82%
Réjean Bellemare
15,167
23.26%
Adriana Dudas
17,798
27.29%
Monique Pauzé
22,618
34.68%
Yoland Gilbert
1,242
1.90%
Johnathan Cloutier (SD)
1,333
2.04%
Jean-François Larose
Saint-Maurice—Champlain Jacques Grenier
9,592
16.27%
Jean-Yves Tremblay
12,245
20.77%
François-Philippe Champagne
24,475
41.52%
Sacki Carignan Deschamps
11,295
19.16%
Martial Toupin
1,144
1.94%
Jean-Paul Bédard (M-L)
196
0.33%
Lise St-Denis
Trois-Rivières Dominic Therrien
11,231
18.63%
Robert Aubin
19,193
31.83%
Yvon Boivin
18,224
30.23%
André Valois
10,249
17.00%
Éric Trottier
1,032
1.71%
Maxime Rousseau (Libert.)
360
0.60%
Robert Aubin

2011

edit
Electoral districtCandidatesIncumbent
BQConservativeLiberalNDPGreenOther
Bas-Richelieu—Nicolet—
Bécancour
Louis Plamondon
19,046
38.30%
Charles Cartier
6,478
13.03%
Rhéal Blais
5,024
10.10%
Krista Lalonde
17,705
35.60%
Anne-Marie Tanguay
1,479
2.97%
Louis Plamondon
Berthier—Maskinongé Guy André
16,668
29.45%
Marie-Claude Godue
7,904
13.96%
Francine Gaudet
8,060
14.24%
Ruth Ellen Brosseau
22,403
39.58%
Léonie Matteau
1,196
2.11%
Martin Jubinville (Rhino)
373
0.66%
Guy André
Joliette Pierre A. Paquette
18,804
32.90%
Michel Morand
5,525
9.67%
François Boucher
3,545
6.20%
Francine Raynault
27,050
47.33%
Annie Durette
2,227
3.90%
Pierre Paquette
Lotbinière—
Chutes-de-la-Chaudière
Gaston Gourde
8,381
14.88%
Jacques Gourde
22,460
39.88%
Nicole Larouche
2,866
5.09%
Tanya Fredette
21,683
38.50%
Richard Domm
936
1.66%
Jacques Gourde
Montcalm Roger Gaudet
19,609
30.16%
Jason Fuoco
5,118
7.87%
Yves Dufour
3,501
5.39%
Manon Perreault
34,434
52.97%
Marianne Girard
2,347
3.61%
Roger Gaudet
Portneuf—Jacques-Cartier Richard Côté
10,745
20.48%
Réjean Thériault
3,463
6.60%
Élaine Michaud
22,387
42.67%
Claudine Delorme
1,279
2.44%
André Arthur (Ind.)
14,594
27.82%
André Arthur
Repentigny Nicolas Dufour
19,242
31.09%
Christophe Royer
4,606
7.44%
Chantal Perreault
4,830
7.80%
Jean-François Larose
32,131
51.92%
Michel Duchaine
1,078
1.74%
Nicolas Dufour
Saint-Maurice—Champlain Jean-Yves Laforest
13,961
29.28%
Jacques Grenier
8,447
17.72%
Yves Tousignant
5,670
11.89%
Lise St-Denis
18,628
39.07%
Pierre Audette
972
2.04%
Jean-Yves Laforest
Trois-Rivières Paule Brunelle
11,987
23.80%
Pierre Lacroix
6,205
12.32%
Patrice Mangin
3,617
7.18%
Robert Aubin
26,981
53.57%
Louis Lacroix
972
1.93%
Francis Arsenault (Rhino)
256 0.51%
Paule Brunelle
Marc-André Fortin (Ind.)
346 0.69%

2008

edit
Electoral districtCandidatesIncumbent
BQConservativeLiberalNDPGreenIndependent
Bas-Richelieu—
Nicolet—
Bécancour
Louis Plamondon
26,821
54.67%
Réjean Bériault
8,904
18.15%
Ghislaine Cournoyer
7,987
16.28%
Nourredine Seddiki
4,010
8.17%
Rebecca Laplante
1,334
2.72%
Louis Plamondon
Berthier—
Maskinongé
Guy André
24,945
45.83%
Marie-Claude Godue
12,078
22.19%
Jean-Luc Matteau
10,035
18.44%
André Chauvette
5,684
10.44%
Denis Lefebvre
1,691
3.11%
Guy André
Joliette Pierre Paquette
28,040
52.40%
Sylvie Lavallée
9,540
17.83%
Suzie St-Onge
7,769
14.52%
Francine Raynault
5,579
10.42%
Annie Durette
2,588
4.84%
Pierre Paquette
Lotbinière—
Chutes-de-la-
Chaudière
Antoine Sarrazin-Bourgoin
12,738
24.58%
Jacques Gourde
24,495
47.27%
Marie-Thérèse Hovington
6,498
12.54%
Raymond Côté
6,828
13.18%
Shirley Picknell
1,265
2.44%
Jacques Gourde
Montcalm Roger Gaudet
33,519
55.69%
Claude Marc Boudreau
8,096
13.45%
David Grégoire
8,387
13.93%
Marie-Josée Beauchamp
8,337
13.85%
Michel Paulette
1,854
3.08%
Roger Gaudet
Portneuf—
Jacques-Cartier
Richard Côté
14,401
32.02%
Stéphane Asselin
7,320
16.27%
André Turgeon
5,707
12.69%
Nathan John Weatherdon
1,452
3.23%
André Arthur
15,063 33.49%
André Arthur
Jean Paradis
1,039 2.31%
Repentigny Nicolas Dufour
31,007
53.05%
Bruno Royer
8,168
13.98%
Robert Semegen
8,751
14.97%
Réjean Bellemare
8,853
15.15%
Paul W. Fournier
1,666
2.85%
Raymond Gravel
Saint-Maurice—
Champlain
Jean-Yves Laforest
20,397
43.96%
Stéphane Roof
11,083
23.89%
Ronald St-Onge Lynch
9,755
21.02%
Anne-Marie Aubert
3,601
7.76%
Martial Toupin
1,562
3.37%
Jean-Yves Laforest
Trois-Rivières Paule Brunelle
22,405
45.27%
Claude Durand
11,998
24.24%
Marcos G. Simard
9,008
18.20%
Geneviève Boivin
4,544
9.18%
Ariane Blais
1,540
3.11%
Paule Brunelle

2006

edit
Electoral districtCandidatesIncumbent
BQLiberalConservativeNDPGreenOther
Bas-Richelieu—Nicolet—Bécancour Louis Plamondon
27,742
55.92%
Ghislaine Provencher
6,438
12.98%
Marie-Ève Hélie-Lambert
11,588
23.36%
Marie-Claude Roberge Cartier
2,248
4.53%
Louis Lacroix
1,595
3.22%
Louis Plamondon
Richelieu
Berthier—Maskinongé Guy André
26,191
48.50%
Serge Lafrenière
5,605
10.38%
Marie-Claude Godue
16,958
31.40%
Anne-Marie Aubert
3,319
6.15%
Nathalie Gratton
1,925
3.56%
Guy André
Joliette Pierre A. Paquette
28,630
54.12%
Gérard Leclerc
5,245
9.92%
Sylvie Lavallée
14,192
26.83%
Jacques Trudeau
2,745
5.19%
Jean-François Lévêque
2,086
3.94%
Pierre Paquette
Lotbinière—Chutes-de-la-Chaudière Odina Desrochers
15,402
29.64%
Eric Paradis
2,820
5.43%
Jacques Gourde
28,236
54.34%
Raymond Côté
3,529
6.79%
Shirley Picknell
1,978
3.81%
Odina Desrochers
Montcalm Roger Gaudet
34,975
62.28%
Luc Fortin
4,645
8.27%
Michel Paulette
10,818
19.26%
Nancy Leclerc
3,766
6.71%
Wendy Gorchinsky
1,954
3.48%
Roger Gaudet
Portneuf—Jacques-Cartier Guy Côté
13,094
25.88%
Gilles Landry
2,489
4.92%
Howard M. Bruce
11,472
22.67%
Jean-Marie Fiset
1,956
3.87%
Jérôme Beaulieu
1,431
2.83%
André Arthur (Ind.)
20,158
39.84%
Guy Côté
Portneuf
Repentigny Benoît Sauvageau
34,958
62.42%
Josyanne Forest
4,847
8.65%
Claude Jr Lafortune
10,124
18.08%
Réjean Bellemare
4,337
7.74%
Adam Jastrzebski
1,742
3.11%
Benoît Sauvageau
Saint-Maurice—Champlain Jean-Yves Laforest
21,532
44.34%
Lucille Whissell
5,612
11.56%
Martial Toupin
16,028
33.01%
Claude Larocque
3,684
7.59%
Pierre Audette
1,705
3.51%
Marcel Gagnon
Trois-Rivières Paule Brunelle
22,331
45.87%
Martine Girard
5,268
10.82%
Luc Ménard
15,423
31.68%
Geneviève Boivin
3,774
7.75%
Linda Lavoie
1,513
3.11%
Paul Giroux (Mar.)
371
0.76%
Paule Brunelle

2004

edit
Electoral districtCandidatesIncumbent
LiberalBQConservativeNDPGreenMarijuana
Berthier—Maskinongé Laurier Thibault
11,198
22.79%
Guy André
29,432
59.90%
Ann Julie Fortier
5,535
11.27%
Denis McKinnon
1,653
3.36%
Eric Labrecque
1,314
2.67%
New district
Joliette Jean-François Coderre
10,975
22.70%
Pierre A. Paquette
30,661
63.42%
Daniel Bouchard
3,107
6.43%
Jacques Trudeau
1,755
3.63%
Wendy Gorchinsky
1,147
2.37%
Marco Geoffroy
701
1.45%
Pierre Paquette
Lotbinière—Chutes-de-la-Chaudière Anicet Gagné
9,445
21.45%
Odina Desrochers
20,245
45.99%
Jean Landry
10,628
24.14%
Jean Bernatchez
2,091
4.75%
Rama Borne MacDonald
1,615
3.67%
Odina Desrochers
Lotbinière—L'Érable
Montcalm Daniel Brazeau
7,915
16.40%
Roger Gaudet
34,383
71.24%
Michel Paulette
2,831
5.87%
François Rivest
1,531
3.17%
Serge Bellemare
1,606
3.33%
Roger Gaudet
Berthier—Montcalm
Portneuf Claude Duplain
11,863
27.56%
Guy Côté
18,471
42.91%
Howard M. Bruce
9,251
21.49%
Jean-François Breton
1,540
3.58%
Pierre Poulin
1,925
4.47%
Claude Duplain
Repentigny Lévis Brien
9,353
18.25%
Benoît Sauvageau
35,907
70.06%
Allen F. MacKenzie
2,447
4.77%
André Cardinal
1,526
2.98%
Jean-François Léveque
1,482
2.89%
François Boudreau
539
1.05%
Benoît Sauvageau
Richelieu Ghislaine Provencher
11,045
22.68%
Louis Plamondon
31,497
64.67%
Daniel A. Proulx
3,726
7.65%
Charles Bussières
1,017
2.09%
Jean-Pierre Bonenfant
839
1.72%
Daniel Blackburn
580
1.19%
Louis Plamondon
Bas-Richelieu—Nicolet—Bécancour
Saint-Maurice—Champlain Marie-Eve Bilodeau
14,320
30.55%
Marcel Gagnon
25,918
55.29%
Martial Toupin
4,129
8.81%
Pierre J.C. Allard
1,104
2.36%
Pierre Cayou Audette
855
1.82%
Paul Giroux
547
1.17%
Vacant1
Saint-Maurice
merged district
Marcel Gagnon
Champlain
Trois-Rivières Jean-Éric Guindon
12,703
27.36%
Paule Brunelle
26,240
56.51%
Jean-Guy Mercier
4,381
9.43%
Marc Tessier
1,635
3.52%
Linda Lavoie
1,476
3.18%
Yves Rocheleau

1 Formerly held by Liberal Jean Chrétien.

Maps

2000

edit
Electoral districtCandidatesIncumbent
BQLiberalCanadian AllianceNDPPCOther
Bas-Richelieu—Nicolet—Bécancour Louis Plamondon
25,266
56.92%
Roland Paradis
13,781
31.04%
Frédéric Lajoie
2,078
4.68%
Raymond Dorion
421
0.95%
Gabriel Rousseau
1,944
4.38%
Black D. Blackburn (Mar.)
901
2.03%
Louis Plamondon
Richelieu
Berthier—Montcalm Michel Bellehumeur
31,647
57.06%
Jean-Carle Hudon
16,669
30.05%
Réal Naud
2,851
5.14%
Jean-Pierre De Billy
823
1.48%
Paul Lavigne
2,011
3.63%
Sébastien Hénault (Mar.)
1,464
2.64%
Michel Bellehumeur
Champlain Marcel Gagnon
20,423
45.26%
Julie Boulet
20,408
45.23%
Eric Labranche
2,599
5.76%
Philippe Toone
672
1.49%
Paul Giroux (Mar.)
1,020
2.26%
Réjean Lefebvre
Joliette Pierre Paquette
23,615
52.20%
Robert Malo
14,820
32.76%
Clément Lévesque
2,432
5.38%
François Rivest
1,085
2.40%
Eric Champagne
2,730
6.03%
Bob Aubin (Comm.)
560
1.24%
René Laurin
Lotbinière—L'Érable Odina Desrochers
15,351
45.64%
Luc Dastous
12,563
37.35%
Pierre Allard
2,827
8.40%
Dominique Vaillancourt
538
1.60%
Jean Landry
2,357
7.01%
Odina Desrochers
Lotbinière
Portneuf Patrice Dallaire
15,444
35.23%
Claude Duplain
17,877
40.78%
Howard Bruce
6,699
15.28%
François Dion
3,819
8.71%
Pierre de Savoye
Repentigny Benoît Sauvageau
33,627
57.80%
David Veillette
15,635
26.88%
Michel Paulette
2,964
5.09%
Pierre Péclet
831
1.43%
Michel Carignan
3,122
5.37%
Lise Dufour (Mar.)
1,997
3.43%
Benoît Sauvageau
Saint-Maurice François Marchand
16,821
38.96%
Jean Chrétien
23,345
54.07%
Jean-Guy Mercier
1,461
3.38%
Raymond Chase
359
0.83%
Pierre Blais
966
2.24%
Sylvain Archambault (Comm.)
223
0.52%
Jean Chrétien
Trois-Rivières Yves Rocheleau
22,405
46.67%
Denis Normandin
20,606
42.92%
Luc Legaré
2,161
4.50%
David Horlock
512
1.07%
Scott Healy
1,599
3.33%
Alexandre Deschênes (M-L)
184 0.38%
Gilles Raymond (NLP)
538 1.12%
Yves Rocheleau

1997

edit
Electoral districtCandidatesIncumbent
BQLiberalPCNDPOther
Richelieu Louis Plamondon
26,421
Jocelyn Paul
13,941
Yves Schelling
6,827
Sylvain Pelletier
1,028
Louis Plamondon
Berthier—Montcalm Michel Bellehumeur
32,707
Lise Perreault
15,073
Réal Naud
13,338
Jean-Pierre de Billy
1,009
Michel Bellehumeur
Champlain Réjean Lefebvre
20,687
Pierre Lesieur
12,915
Yves St-Amant
12,784
Petra Genest
632
Réjean Lefebvre
Joliette René Laurin
22,605
Denise Cloutier Bergeron
7,452
Anie Perrault
17,417
Jacques Trudeau
502
Gilles Roy (NL)
594
René Laurin
Lotbinière Odina Desrochers
13,069
Pierre Savoie
10,062
Gaston Beaudet
9,690
Dominique Vaillancourt
445
Jean Landry (Ind)
1,988
Jean Landry
Portneuf Pierre de Savoye
18,615
Raynald Samson
12,674
Raymond McBain
10,587
Majella Desmeules
1,112
Pierre de Savoye
Repentigny Benoît Sauvageau
33,283
Robert Tranchemontagne
12,495
Michel Carignan
12,436
Normand Caplette
916
New district
Saint-Maurice Yves Duhaime
20,664
Jean Chrétien
22,266
Denis Vincent
3,657
Eric Hébert
489
Jean Chrétien
Trois-Rivières Yves Rocheleau
21,267
Jean-Guy Doucet
15,692
Michel Charland
12,102
Dorothy Hénaut
528
Roger Périgny (NL)
503
Yves Rocheleau

1993

edit
Electoral districtCandidatesIncumbent
BQLiberalPCNDPOther
Richelieu Louis Plamondon
31,558
Michel Biron
10,933
Lorraine Frappier
4,455
Carl Ethier
337
Paulo da Silva (PfC)
157
Louis Plamondon
Berthier—Montcalm Michel Bellehumeur
36,065
Madeleine Bélanger
16,133
Réal Naud
5,358
Jean-Pierre de Billy
591
Réal Croteau (NL)
804
Laurent Harvey (Nat)
276
Robert de Cotret
Champlain Réjean Lefebvre
23,646
Michel Veillette
11,251
Michel Champagne
13,083
André De Billy
445
Michel Champagne
Joliette René Laurin
41,057
Réjean Lefebvre
10,344
Gaby Larrivée
8,776
Gilles De Chantal
809
Gilles Roy (NL)
1,274
Gaby Larrivée
Lotbinière Jean Landry
26,763
Michael Provencher
14,659
Jacques Le Sieur
7,387
André-Pierre Robitaille
714
Maurice Tremblay
Portneuf Pierre de Savoye
23,880
Paulin Plamondon
10,269
Marc Ferland
6,645
John MacFarlane
626
René Matte (Ind)
2,260
Robert Royer (NL)
869
Marc Ferland
Saint-Maurice Claude Rompré
18,896
Jean Chrétien
25,200
Pauline B. Daneault
1,909
Robert Des Champs
236
Christian Simard (NL)
372
Denis Pronovost [1]
Trois-Rivières Yves Rocheleau
24,882
Jean-Pierre Caron
9,937
Pierre H. Vincent
11,053
Maryse Choquette
374
Roger Périgny (NL)
552
Pierre H. Vincent
  1. Denis Pronovost was elected as a Progressive-Conservative in 1988 election but left the PC caucus in 1993 to seat as independent.

1988

edit
Electoral districtCandidatesIncumbent
PCLiberalNDPGreenOther
Richelieu Louis Plamondon
32,104
Yvon Hébert
8,979
Gaston Dupuis
3,154
Jacqueline Lacoste
1,896
Paul Poison Hevey (Rhino)
457
Louis Plamondon
Berthier—Montcalm Robert de Cotret
29,370
Maurice Roberge
13,624
Pierre Arès
5,884
Roberte Sylvestre
2,084
Antonio Yanakis (Ind)
1,292
Robert de Cotret
Berthier—Maskinongé—Lanaudière
Champlain Michel Champagne
29,788
André Burke
7,471
Jocelyn Crête
8,792
Michel Champagne
Joliette Gaby Larrivée
27,908
Denis Coderre
12,573
Claude Hétu
7,232
Gaétan Riopel-Savignac
2,290
Jean-François Desroches (Ind)
530
François Roy (PfC)
128
Gaby Larrivée
Lotbinière Maurice Tremblay
26,585
Pierre Lajeunesse
15,067
Richard Lacoursière
8,782
Maurice Tremblay
Portneuf Marc Ferland
23,893
Paulin Plamondon
11,055
Jean-Marie Fiset
5,100
Reynald Desrochers
1,607
Marc Ferland
Saint-Maurice Denis Pronovost
18,741
Yvon Milette
10,168
Claude Rompré
12,463
Gilles Grondin [1]
Trois-Rivières Pierre H. Vincent
29,370
Nicholas Papirakis
6,727
Josée Trudel
5,470
Danielle La Chicane Saint-Laurent (Rhino)
826
Lise Éthier (Ind)
249
Pierre H. Vincent
  1. Gilles Grondin was elected in a by-election on September 29, 1986. Jean Chrétien was elected in the 1984 Canadian federal election.

Notes

  1. Perreault sat as an independent at dissolution then joined Strength in Democracy after writ was dropped.

Related Research Articles

<span class="mw-page-title-main">Bloc Québécois</span> Canadian federal political party active only in Quebec

The Bloc Québécois is a federal political party in Canada devoted to Quebec nationalism and the promotion of Quebec sovereignty. The Bloc was formed by Members of Parliament (MPs) who defected from the federal Progressive Conservative Party and Liberal Party during the collapse of the Meech Lake Accord. Founder Lucien Bouchard had been a cabinet minister in the federal Progressive Conservative government of Brian Mulroney.

<span class="mw-page-title-main">2000 Canadian federal election</span>

The 2000 Canadian federal election was held on November 27, 2000, to elect members to the House of Commons of Canada of the 37th Parliament of Canada. Prime Minister Jean Chrétien's Liberal Party won a third majority government.

<span class="mw-page-title-main">1997 Canadian federal election</span>

The 1997 Canadian federal election was held on June 2, 1997, to elect members to the House of Commons of the 36th Parliament of Canada. Prime Minister Jean Chrétien's Liberal Party won a second majority government. The Reform Party replaced the Bloc Québécois as the Official Opposition.

<span class="mw-page-title-main">1993 Canadian federal election</span>

The 1993 Canadian federal election was held on October 25, 1993, to elect members to the House of Commons of the 35th Parliament of Canada. Considered to be a major political realignment, it was one of the most eventful elections in Canada's history. The governing Progressive Conservatives suffered a spectacular wipeout, losing 154 of their 156 seats in one of the worst-ever defeats for a governing party in the Western world. The Liberal Party under Jean Chrétien won a majority government with 177 seats, with the separatist Bloc Québécois and western-based Reform Party coming in second and third, with the Bloc's 54 seats making it the Official Opposition thanks to the devastation of the PCs.

<span class="mw-page-title-main">Timeline of Quebec history (1982–present)</span>

This section of the Timeline of Quebec history concerns the events between patriation of the British North America Act and the present day.

The following is a timeline of the Canadian federal election, 2004. More on the election in general is available in the article 2004 Canadian federal election.

<span class="mw-page-title-main">Canadian federal election results in Northern Montreal</span>

Canadian federal elections have provided the following results in Northern Montreal.

Canadian federal elections have provided the following results in Eastern Montreal.

Canadian federal elections have provided the following results in Western Montreal.

<span class="mw-page-title-main">2006 Canadian federal election</span>

The 2006 Canadian federal election was held on January 23, 2006, to elect members to the House of Commons of Canada of the 39th Parliament of Canada.

This is a seat by seat list of candidates in the 2004 Canadian election.

Canadian federal elections have provided the following results in Eastern Quebec.

Canadian federal elections have provided the following results in the Laurentides, Outaouais and Northern Quebec.

Canadian federal elections have provided the following results in the Côte-Nord and Saguenay–Lac-Saint-Jean.

Canadian federal elections have provided the following results in Quebec City.

Canadian federal elections have provided the following results in the Eastern Townships.

Canadian federal elections have provided the following results in Montérégie.

Louis Plamondon is a Canadian politician who served as the interim speaker of the House of Commons of Canada from September 27 to October 3, 2023. A member of the Bloc Québécois, he has represented Bécancour—Nicolet—Saurel since 1984. As the longest-serving current member of the House of Commons, Plamondon is Dean of the House, and holds the record as Canada's longest-serving dean.

<span class="mw-page-title-main">Results of the 2006 Canadian federal election</span> Results of the 39th Canadian federal election

The 39th Canadian federal election was held on January 23, 2006.

By-elections to the 37th Canadian Parliament were held to fill vacancies in the House of Commons of Canada between the 2000 federal election and the 2004 federal election. The Liberal Party of Canada led a majority government for the entirety of the 37th Canadian Parliament, with little change from by-elections.