Northwest Territories (electoral district)

Last updated

Northwest Territories
Flag of the Northwest Territories.svg Northwest Territories electoral district
Northwest Territories, Canada.svg
Federal electoral district
Legislature House of Commons
MP


Michael McLeod
Liberal
District created1976
First contested 1979
Last contested 2021
District webpage profile, map
Demographics
Population (2021) [1] 41,070
Electors (2019)30,235
Area (km²) [2] 1,127,711.92
Pop. density (per km²)0.04
Census division(s) Region 1, Region 2, Region 3, Region 4, Region 5, Region 6
Census subdivision(s) Yellowknife, Hay River, Inuvik, Fort Smith, Behchokò, Fort Simpson, Tuktoyaktuk, Norman Wells, Fort McPherson, Fort Providence
Flag of the Northwest Territories.svg Northwest Territories electoral district
Defunct federal electoral district
Legislature House of Commons
District created1962
District abolished1976
First contested 1962
Last contested 1974

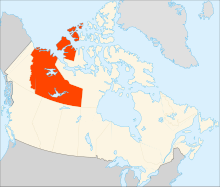
Northwest Territories (French : Territoires du Nord-Ouest) is a federal electoral district represented in the House of Commons of Canada. The electoral district covers the entire territory.

Contents

This riding was created in 1962 from Mackenzie River riding. It was composed of the entire territory of the Northwest Territories. In 1979, the riding was divided into the ridings of Western Arctic and Nunatsiaq (later Nunavut). Following the creation of the territory of Nunavut in 1999, the riding of Western Arctic was made coterminous with the new Northwest Territories.

After 1999, Western Arctic was an anomaly in that, unlike Nunavut and Yukon, it did not share the name of the territory with which it was coterminous. This did not change with subsequent representation orders because the electoral boundaries revision process did not affect the territories and the territorial riding names were specified in law. In 2014, at the behest of Western Arctic MP Dennis Bevington, the riding name was changed to Northwest Territories by Bill C-37, which also changed the names of several other ridings scheduled to come into effect with the representation order for the next election. Unlike those names, the change to Northwest Territories came into effect immediately as it involved amending the Electoral Boundaries Readjustment Act itself. [3] [4]

From 1887 to 1905, the only areas of the NWT with representation in Parliament were those areas that became part of present-day provinces (Alberta, Saskatchewan and western Manitoba). From 1905 to 1947, the NWT was not represented in Parliament. From 1947 to 1962, the southwestern NWT was represented only by the electoral district of Yukon—Mackenzie River and then Mackenzie River. In 1962, the electoral district of NWT was created to represent the entire territory, for the first time giving all Canadian territory a representative in Parliament.

This riding's boundaries remained the same following the 2012 redistribution.

Demographics

According to the 2021 Canadian census

Ethnic groups: 49.6% Native Canadian, 38.2% White, 4.1% Filipino, 2.6% Black, 1.9% South Asian
Languages: 76% English, 3.3% Tlicho, 2.8% French, 1.9% Slavey, 1.9% Tagalog, 1% Dene
Religions: 55.2% Christian (21% Catholic, 8.1% Anglican, 2% United Church, 1.9% Pentecostal and other Charismatic 1.5% Baptist), 39.8% No religion, 1.8% Muslim
Median income: $56 800
Average income: $69 400

Members of Parliament

Following the division into Western Arctic and Nunatsiaq, the riding's first MP was Progressive Conservative MP Dave Nickerson, who was first elected in 1979 and re-elected twice. In the 1988 election, Nickerson was defeated by Liberal Ethel Blondin-Andrew who went on to serve as the riding's MP for eighteen years, including two years as Minister of State for Northern Development. In 2006, Blondin-Andrew was defeated by New Democrat Dennis Bevington. The earlier riding of Northwest Territories had been represented by New Democrat Wally Firth from 1972 to 1979.

This riding has elected the following members of Parliament:

ParliamentYearsMemberParty
Northwest Territories
Riding created from Mackenzie River
25th  1962–1963   Isabel Hardie Liberal
26th  1963–1965   Eugène Rhéaume Progressive Conservative
27th  1965–1968   Bud Orange Liberal
28th  1968–1972
29th  1972–1974   Wally Firth New Democratic
30th  1974–1979
Riding divided into Western Arctic and Nunatsiaq
As Western Arctic
31st  1979–1980   Dave Nickerson Progressive Conservative
32nd  1980–1984
33rd  1984–1988
34th  1988–1993   Ethel Blondin-Andrew Liberal
35th  1993–1997
36th  1997–2000
37th  2000–2004
38th  2004–2006
39th  2006–2008   Dennis Bevington New Democratic
40th  2008–2011
41st  2011–2014
Northwest Territories
41st  2014–2015   Dennis Bevington New Democratic
42nd  2015–2019   Michael McLeod Liberal
43rd  2019–2021
44th  2021–present

Election results

Graph of election results in Northwest Territories/Western Arctic (since 1979, minor parties that never got 2% of the vote or didn't run consistently are omitted)

Northwest Territories (2014–present)

2021 Canadian federal election
PartyCandidateVotes%±%Expenditures
Liberal Michael McLeod 5,38738.22-1.78
New Democratic Kelvin Kotchilea4,55832.34+10.54
Conservative Lea Anne Mollison2,03114.41-11.39
Independent Jane Groenewegen 1,79112.71
Green Roland Laufer3282.33-8.27
Total valid votes14,09598.91-0.33
Total rejected ballots1551.09+0.33
Turnout14,25047.2-6.3
Liberal hold Swing -4.16
Source: Elections Canada [5]
2019 Canadian federal election
PartyCandidateVotes%±%Expenditures
Liberal Michael McLeod 6,63840.0-8.34$60,703.01
Conservative Yanik D'Aigle4,27925.8+7.45none listed
New Democratic Mary Beckett3,61921.8-8.68$5,371.84
Green Paul Falvo1,75710.6+7.77$10,067.85
People's Luke Quinlan2951.8none listed
Total valid votes/expense limit16,291100.0
Total rejected ballots125
Turnout16,41654.3
Eligible voters30,235
Liberal hold Swing -15.79
Source: Elections Canada [6] [7]
2015 Canadian federal election
PartyCandidateVotes%±%Expenditures
Liberal Michael McLeod 9,17248.34+29.90$71,207.71
New Democratic Dennis Bevington 5,78330.48−15.36$37,599.86
Conservative Floyd Roland 3,48118.35−13.76
Green John Moore5372.83−0.23
Total valid votes/expense limit18,973100.00 $214,028.20
Total rejected ballots1040.55
Turnout19,07764.82
Eligible voters29,432
Liberal gain from New Democratic Swing +22.63
Source: Elections Canada [8] [9]

Western Arctic (1979–2014)

2011 Canadian federal election
PartyCandidateVotes%±%
New Democratic Dennis Bevington 7,14045.80+4.36
Conservative Sandy Lee 5,00132.10−5.51
Liberal Joe Handley 2,87218.40+4.82
Green Eli Purchase4473.10−2.39
Animal Alliance Bonnie Dawson870.60
Total valid votes15,577100.0  
Total rejected ballots780.50+0.09
Turnout15,65555.43+7.72
Eligible voters28,244
New Democratic hold Swing +4.94
2008 Canadian federal election
PartyCandidateVotes%±%Expenditures
New Democratic Dennis Bevington 5,66941.44−0.99$39,961
Conservative Brendan Bell 5,14637.62+17.14$84,329
Liberal Gabrielle Mackenzie-Scott1,85813.58−21.7$37,884
Green Sam Gamble7525.49+3.65$9,010
First Peoples National Noeline Villebrun2521.84
Total valid votes13,677100.0  
Total rejected ballots560.41
Turnout13,73347.71
Eligible voters28,787
New Democratic hold Swing −9.06
2006 Canadian federal election
PartyCandidateVotes%±%Expenditures
New Democratic Dennis Bevington 6,80142.67+3.62$40,703
Liberal Ethel Blondin-Andrew 5,64335.40−4.04
Conservative Richard Edjericon3,20020.08+2.92
Green Alexandre Beaudin2961.85−2.47
Total valid votes15,940100.0  
New Democratic gain from Liberal Swing +3.83
2004 Canadian federal election
PartyCandidateVotes%±%Expenditures
Liberal Ethel Blondin-Andrew 5,31739.44−6.15$58,782
New Democratic Dennis Bevington 5,26439.05+12.34$39,504
Conservative Sean Mandeville2,31417.16−10.52$16,863
Green Chris O'Brien5834.32$2,754
Total valid votes13,478100.0  
Total rejected ballots690.51
Turnout13,54747.33
Liberal hold Swing −9.24
Change for the Conservatives is based on the combined totals of the Canadian Alliance and the Progressive Conservatives.
2000 Canadian federal election
PartyCandidateVotes%±%Expenditures
Liberal Ethel Blondin-Andrew 5,85545.59+3.96$56,498
New Democratic Dennis Bevington 3,43026.71+7.42$27,323
Alliance Fred Turner2,27317.70+2.99$15,406
Progressive Conservative Bruce McLaughlin 1,6879.98−2.64$8,374
Total valid votes12,840100.0  
Total rejected ballots720.56
Turnout12,91252.24
Liberal hold Swing −1.73
Change for the Canadian Alliance is based on the Reform Party.
1997 Canadian federal election
PartyCandidateVotes%±%Expenditures
Liberal Ethel Blondin-Andrew 5,56441.63−20.84$56,834
New Democratic Mary Beth Levan2,57919.29+12.98$22,393
Reform Mike Watt1,96614.71+0.62$4,546
Progressive Conservative Bob Dowdall1,68712.62–0.71$16,020
Independent Wally Firth 1,56711.72$8,857
Total valid votes13,363100.0  
Total rejected ballots940.70
Turnout13,45758.37
Liberal hold Swing −16.91
1993 Canadian federal election
PartyCandidateVotes%±%
Liberal Ethel Blondin-Andrew 8,86762.47+20.10
Reform Mansell Grey2,00014.09
Progressive Conservative Martin Hanly1,89313.34−15.28
New Democratic Bill Schram8966.31−18.78
Green Chris O'Brien3252.29
Natural Law Lynn Taylor2131.50
Total valid votes14,194100.0  
Liberal hold Swing +3.00
1988 Canadian federal election
PartyCandidateVotes%±%
Liberal Ethel Blondin 5,41542.37+16.52
Progressive Conservative Dave Nickerson 3,65728.62−17.50
New Democratic Wayne Cahill3,20725.10−2.93
Independent Cece McCauley3312.59
Independent Ernie Lennie1691.32
Total valid votes12,779100.0  
Liberal gain from Progressive Conservative Swing +17.01
1984 Canadian federal election
PartyCandidateVotes%±%
Progressive Conservative Dave Nickerson 5,82246.12+12.31
New Democratic Bertha Allen3,53828.03−5.60
Liberal Lynda Sorenson 3,26425.86−6.71
Total valid votes12,624100.0  
Progressive Conservative hold Swing +8.96
1980 Canadian federal election
PartyCandidateVotes%±%
Progressive Conservative Dave Nickerson 3,55633.81−1.35
New Democratic Wally Firth 3,53733.63+4.30
Liberal Gary Boyd3,42532.56–0.59
Total valid votes10,518100.0  
Progressive Conservative hold Swing −2.82
lop.parl.ca
1979 Canadian federal election
PartyCandidateVotes%
Progressive Conservative Dave Nickerson 4,05835.16
Liberal David Searle 3,82733.15
New Democratic Georges Erasmus 3,38529.33
Independent Edward McRae2732.37
Total valid votes11,543100.0  
Riding created from part of the former riding of Northwest Territories, with New Democrat Wally Firth as the incumbent.

Northwest Territories (1962–1974)

Graph of election results in Northwest Territories (1962-1974, parties that never got 2% of the vote or didn't run consistently are omitted)
1974 Canadian federal election
PartyCandidateVotes%±%
New Democratic Wally Firth 5,41042.09+2.27
Progressive Conservative Bob Ward4,27133.23+2.36
Liberal Richard Whitford3,17324.68−4.64
Total valid votes12,854100.0  
New Democratic hold Swing –0.04
1972 Canadian federal election
PartyCandidateVotes%±%
New Democratic Wally Firth 5,59739.82+27.07
Progressive Conservative Bob Ward4,33930.87+7.43
Liberal Dick Hill4,12129.32−34.48
Total valid votes14,057100.0  
New Democratic gain from Liberal Swing +9.82
1968 Canadian federal election
PartyCandidateVotes%±%
Liberal Robert Orange 6,01863.80+7.59
Progressive Conservative R. Van Norman2,21123.44−15.68
New Democratic William Harvey Kent1,20312.75+8.09
Total valid votes9,432100.0  
Liberal hold Swing +11.64
1963 Canadian federal election
PartyCandidateVotes%±%
Progressive Conservative Eugène Rhéaume 4,81456.82+14.47
Liberal Isabel Hardie 3,65943.18−3.06
Total valid votes8,473100.0  
Progressive Conservative gain from Liberal Swing +8.76
1962 Canadian federal election
PartyCandidateVotes%
Liberal Isabel Hardie 3,84246.24
Progressive Conservative Eugène Rhéaume 3,51942.35
Independent A. Pat Carey94811.41
Total valid votes8,309100.0  
This riding was created from Mackenzie River, with Liberal Merv Hardie as the incumbent.

Federal riding associations

Riding associations are the local branches of the national political parties:

PartyAssociation nameCEOHQ address HQ city
Conservative Western Arctic Conservative AssociationBill Aho5523 44th Street Yellowknife
Green Green Party of Canada — Western ArcticJessica Gamble15 Gitzel Street Yellowknife
Liberal Northwest Territories Federal Liberal AssociationChuck BlythPO BOX 965 Yellowknife
New Democratic Western Arctic Federal NDP Riding AssociationShane PykePO BOX 2185 Yellowknife

See also

References

  1. Statistics Canada: 2022
  2. Statistics Canada: 2022
  3. Bill C-37, An Act to change the names of certain electoral districts and to amend the Electoral Boundaries Readjustment Act (S.C. 2014, c. 19).
  4. Parliament of Canada. "Northwest Territories (Northwest Territories) 2014-". History of Federal Ridings since 1867. Consulted 2014-08-27.
  5. "Election Night Results". Elections Canada. Retrieved October 28, 2021.
  6. "List of confirmed candidates". Elections Canada. Retrieved October 4, 2019.
  7. "Election Night Results". Elections Canada. Retrieved November 9, 2019.
  8. Elections Canada – Confirmed candidates for Northwest Territories, 30 September 2015
  9. Elections Canada – Final Candidates Election Expenses Limits