Joliette (federal electoral district)

Last updated

Joliette
Flag of Quebec.svg Quebec electoral district
Joliette.png
Joliette in relation to other Quebec federal electoral districts
Federal electoral district
Legislature House of Commons
MP


Gabriel Ste-Marie
Bloc Québécois
District created1966
First contested 1968
Last contested 2021
District webpage profile, map
Demographics
Population (2016) [1] 104,136
Electors (2019)88,831
Area (km²) [2] 9,102
Pop. density (per km²)11.4
Census division(s) Joliette, Matawinie
Census subdivision(s) Joliette, Saint-Charles-Borromée, Rawdon, Notre-Dame-des-Prairies, Saint-Paul, Chertsey, Saint-Donat, Crabtree, Saint-Ambroise-de-Kildare, Saint-Thomas

Joliette is a federal electoral district in Quebec, Canada, that has been represented in the House of Commons of Canada from 1867 to 1935 and since 1968.

Contents

Geography

This electoral district, located northeast of Montreal in the Quebec region of Lanaudière, currently consists of:

It is bounded by the:

Demographics

According to the 2021 Canadian census [3]

Ethnic groups: 93.4% White, 3.8% Indigenous, 1.1% Black

Languages: 92.5% French, 2.1% English, 1.8% Atikamekw

Religions: 70.0% Christian (63.5% Catholic, 6.5% Other), 28.4% None

Median income: $37,200 (2020)

Average income: $45,280 (2020)

History

It was created by the British North America Act of 1867 which preserved existing electoral districts in Lower Canada. In 1933, Joliette became part of the new electoral district of Joliette—L'Assomption—Montcalm.

It was created again in 1966 from Berthier—Maskinongé—delanaudière, Joliette—L'Assomption—Montcalm and Terrebonne ridings.

This riding lost territory to Berthier—Maskinongé during the 2012 electoral redistribution.

Members of Parliament

This riding has elected the following members of Parliament:

ParliamentYearsMemberParty
Joliette
1st  1867–1872   François Benjamin Godin Liberal
2nd  1872–1874   Louis François Georges Baby Conservative
3rd  1874–1874
 1874–1878
4th  1878–1878
 1878–1880
 1880–1882 Lewis Arthur McConville
5th  1882–1882 Édouard Guilbault
 1882–1887  Independent Conservative
6th  1887–1889   Conservative
 1889–1891   Hilaire Neveu Nationalist
7th  1891–1896   Urbain Lippé Conservative
8th  1896–1900   Charles Bazinet Liberal
9th  1900–1904
10th  1904–1908 Joseph Adélard Dubeau
11th  1908–1911
12th  1911–1917   Joseph Pierre Octave Guilbault Conservative
13th  1917–1921   Jean-Joseph Denis Liberal
14th  1921–1925
15th  1925–1926
16th  1926–1928
 1928–1930 Charles-Édouard Ferland
17th  1930–1935
Riding dissolved into Joliette—L'Assomption—Montcalm
Riding re-created from Berthier—Maskinongé—Delanaudière,
Joliette—L'Assomption—Montcalm and Terrebonne
28th  1968–1971   Roch La Salle Progressive Conservative
 1971–1972   Independent
29th  1972–1974
30th  1974–1979   Progressive Conservative
31st  1979–1980
32nd  1980–1984
33rd  1984–1988
34th  1988–1993 Gaby Larrivée
35th  1993–1997   René Laurin Bloc Québécois
36th  1997–2000
37th  2000–2004 Pierre Paquette
38th  2004–2006
39th  2006–2008
40th  2008–2011
41st  2011–2015   Francine Raynault New Democratic
42nd  2015–2018   Gabriel Ste-Marie Bloc Québécois
 2018–2018   Groupe parlementaire québécois
 2018–2019   Bloc Québécois
43rd  2019–2021
44th  2021–present

Election results

1968–present

Graph of election results in Joliette (minor parties that never got 2% of the vote or didn't run consistently are omitted)
2021 Canadian federal election
PartyCandidateVotes%±%Expenditures
Bloc Québécois Gabriel Ste-Marie 30,91355.0-3.2$20,415.99
Liberal Michel Bourgeois12,73122.7+0.2$14,000.77
Conservative Roger Materne5,3149.5+0.5$2,412.32
New Democratic Alexis Beaudet3,1005.5+0.9$59.42
People's Maxime Leclerc1,7713.2+2.3$0.00
Green Érica Poirier1,1262.0-2.1$80.52
Free Manon Coutu9921.8N/A$2,900.09
Marijuana Yanick Théoret2510.4N/A$0.00
Total valid votes/expense limit56,19897.7$120,469.50
Total rejected ballots1,3322.3
Turnout57,53062.3
Registered voters92,281
Bloc Québécois hold Swing -1.8
Source: Elections Canada [4]
2021 federal election redistributed results [5]
PartyVote %
  Bloc Québécois 28,53855.14
  Liberal 11,53322.28
  Conservative 4,9049.47
  New Democratic 2,9975.79
  People's 1,5653.02
  Green 1,0111.95
 Others1,2102.34
2019 Canadian federal election
PartyCandidateVotes%±%Expenditures
Bloc Québécois Gabriel Ste-Marie 33,59058.22+24.92$25,277.75
Liberal Michel Bourgeois12,99522.52-5.70$33,054.52
Conservative Jean-Martin Masse5,1768.97-1.09$15,856.88
New Democratic Julienne Soumaoro2,6234.55-21.14none listed
Green Érica Poirier2,3434.06+1.71$752.47
People's Sylvain Prescott4980.86$932.68
Indépendence du QuébecPaul Savard4740.82$0.00
Total valid votes/expense limit57,699100.0  
Total rejected ballots1,2031.35+0.15
Turnout58,90266.31-0.91
Eligible voters88,831
Bloc Québécois hold Swing +15.31
Source: Elections Canada [6] [7]
2015 Canadian federal election
PartyCandidateVotes%±%Expenditures
Bloc Québécois Gabriel Ste-Marie 18,87533.30+0.29$39,176.25
Liberal Michel Bourgeois15,99528.22+21.83$24,407.76
New Democratic Danielle Landreville14,56625.69-21.23$46,434.16
Conservative Soheil Eid5,70510.06+0.37$34,086.31
Green Mathieu Morin1,3352.35-1.64$1,229.90
Strength in Democracy Robert D. Morais2130.38
Total valid votes/Expense limit56,689100.0   $233,084.37
Total rejected ballots1,1091.20-0.36
Turnout57,79867.22+3.7
Eligible voters85,981
Bloc Québécois gain from New Democratic Swing +10.8
Source: Elections Canada [8] [9]


2011 federal election redistributed results [10]
PartyVote %
  New Democratic 23,81346.92
  Bloc Québécois 16,75133.01
  Conservative 4,9199.69
  Liberal 3,2436.39
  Green 2,0243.99
2011 Canadian federal election
PartyCandidateVotes%±%Expenditures
New Democratic Francine Raynault 27,05047.33+36.91
Bloc Québécois Pierre Paquette 18,80432.90-19.50
Conservative Michel Morand5,5259.67-8.16
Liberal François Boucher3,5456.20-8.32
Green Annie Durette2,2273.90-0.94
Total valid votes/Expense limit57,151100.00
Total rejected ballots 904 1.56-0.05
Turnout58,055 63.52 +1.50
Eligible voters91,395
2008 Canadian federal election
PartyCandidateVotes%±%Expenditures
Bloc Québécois Pierre Paquette 28,04052.40-1.63$66,256
Conservative Sylvie Lavallée9,54017.83-8.93$55,729
Liberal Suzie St-Onge7,76914.52+4.62$4,504
New Democratic Francine Raynault 5,57910.42+5.05$1,331
Green Annie Durette2,5884.84+0.90$2,465
Total valid votes/Expense limit53,516100.00 $94,530
Total rejected ballots8781.61
Turnout54,394 62.02
Bloc Québécois hold Swing +3.65
2006 Canadian federal election
PartyCandidateVotes%±%Expenditures
Bloc Québécois Pierre Paquette 28,63054.03-9.39$59,887
Conservative Sylvie Lavallée14,18226.76+20.33$33,883
Liberal Gérard Leclerc5,2459.90-12.80$8,879
New Democratic Jacques Trudeau2,8455.37+1.74$2,326
Green Jean-François Lévêque2,0863.94+1.57$0
Total valid votes/Expense limit52,988100.00 $86,852
2004 Canadian federal election
PartyCandidateVotes%±%Expenditures
Bloc Québécois Pierre Paquette 30,66163.42+11.22$68,711
Liberal Jean-François Coderre10,97522.70-10.06$40,336
Conservative Daniel Bouchard3,1076.43-4.98$4,639
New Democratic Jacques Trudeau1,7553.63+1.23$1,187
Green Wendy Gorchinsky1,1472.37$77
Marijuana Marco Geoffroy7011.45
Total valid votes/Expense limit48,346100.00 $84,187

Note: Conservative vote is compared to the total of the Canadian Alliance vote and Progressive Conservative vote in the 2000 election.

2000 Canadian federal election
PartyCandidateVotes%±%
Bloc Québécois Pierre Paquette 23,61552.20+5.66
Liberal Robert Malo14,82032.76+17.41
Progressive Conservative Eric Champagne2,7306.03-29.83
Alliance Clément Lévesque2,4325.38
New Democratic François Rivest1,0852.40+1.36
Communist Bob Aubin5601.24
Total valid votes45,242100.00
1997 Canadian federal election
PartyCandidateVotes%±%Expenditures
Bloc Québécois René Laurin 22,60546.54$58,632
Progressive Conservative Anie Perrault17,41735.86$27,044
Liberal Denise Cloutier Bergeron7,45215.34$19,618
Natural Law Gilles Roy5941.22$707
New Democratic Jacques Trudeau5021.03$910
Total valid votes48,570 100.00
Total rejected ballots2,407
Turnout50,977 73.56
Electors on the lists69,304
Sources: Official Results, Elections Canada and Financial Returns, Elections Canada.
1993 Canadian federal election
PartyCandidateVotes%±%
Bloc Québécois René Laurin 41,05765.94
Liberal Réjean Lefebvre10,34416.61-8.20
Progressive Conservative Gaby Larrivée8,77614.10-40.99
Natural Law Gilles Roy1,2742.05
New Democratic Gilles De Chantal8091.30-12.98
Total valid votes62,260100.00
1988 Canadian federal election
PartyCandidateVotes%±%
Progressive Conservative Gaby Larrivée 27,90855.09-18.83
Liberal Denis Coderre 12,57324.82+7.68
New Democratic Claude Hétu7,23214.28+10.12
Green Gaétan Riopel-Savignac2,2904.52
Independent Jean-François Desroches5301.05
Commonwealth of Canada François Roy1280.25+0.17
Total valid votes50,661100.00
1984 Canadian federal election
PartyCandidateVotes%±%
Progressive Conservative Roch La Salle 38,83973.91+8.59
Liberal Hélène Meagher9,00617.14-13.47
New Democratic Martin Vaillancourt2,1864.16+3.41
Rhinoceros Henri Dicule Mondor1,5152.88+1.10
Parti nationaliste Marc Argeris6541.24
Social Credit Alfred Blouin2000.38+0.13
Communist Montserrat Escola1030.20
Commonwealth of Canada Isaylovic Momo440.08
Total valid votes52,547100.00
Canadian federal by-election, 17 August 1981
PartyCandidateVotes%±%
On resignation of Mr. LaSalle, 17 March 1981
Progressive Conservative Roch Lasalle 24,43465.32+18.36
Liberal Michel Denis11,45030.61-15.53
Rhinoceros Claude Le Propre Forget6671.78
Independent Jean-Guy Mercier3490.93
New Democratic Jacques Trudeau2810.75-4.16
Social Credit Carl O'Malley920.25-1.35
Independent Paul Desormiers910.24
Independent Raymond J. Turmel420.11
Total valid votes37,406100.00
1980 Canadian federal election
PartyCandidateVotes%±%
Progressive Conservative Roch Lasalle 22,28046.96-3.76
Liberal Gilles Ratelle21,89146.14+7.05
New Democratic Jacques Trudeau2,3304.91+2.11
Social Credit Alfred Blouin7561.59-3.58
Marxist–Leninist Mario Verrier1840.39+0.23
Total valid votes47,441100.00
1979 Canadian federal election
PartyCandidateVotes%±%
Progressive Conservative Roch Lasalle 23,96050.72-3.84
Liberal Roger Cabana18,46639.09+3.93
Social Credit Alfred Blouin2,4465.18-2.30
New Democratic Jacques Trudeau1,3242.80+0.87
Rhinoceros Andrée social Hallé8281.75
Union populaire Robert Forget1400.30
Marxist–Leninist André Pesant740.16-0.22
Total valid votes47,238100.00
1974 Canadian federal election
PartyCandidateVotes%±%
Progressive Conservative Roch Lasalle 22,54654.56+7.83
Liberal Serge Rochon14,52935.16+2.02
Social Credit Louis Comtois3,0907.48-7.13
New Democratic Gerard Doyon7971.93-2.65
Communist J.E. Poirier2010.49
Marxist–Leninist André Pesant1570.38
Total valid votes41,320 100.00

Note: results from the 1974 federal election are missing from the Library of Parliament website. Results shown are incomplete results (250 of 256 polling stations reporting) reported in the Globe and Mail on 9 July 1974.

Note: percentage change for Roch LaSalle compares his vote as a PC candidate in 1974 to his vote as an independent candidate in 1972.

1972 Canadian federal election
PartyCandidateVotes%±%
Independent Roch Lasalle 18,07446.73+3.40
Liberal Claude Livernoche12,81933.14-9.58
Social Credit Louis Comtois5,65214.61+6.30
Progressive Conservative Sylvio Ricard1,7704.58
New Democratic Constance Riverin3610.93-4.70
Total valid votes38,676100.00

Note: Social Credit vote is compared to Ralliement créditiste vote in the 1968 election. Note: percentage change for Roch LaSalle compares his vote as an independent candidate in 1972 to his vote as a PC candidate in 1968.

1968 Canadian federal election
PartyCandidateVotes%
Progressive Conservative Roch Lasalle 12,46443.33
Liberal Georges Rondeau12,29242.73
Ralliement créditiste Aurélien Neveu2,3918.31
New Democratic Roland Bourgeois1,6205.63
Total valid votes28,767100.00

1867–1935

1930 Canadian federal election
PartyCandidateVotes%±%
Liberal Charles-Édouard Ferland 5,90454.25-12.33
Conservative Joseph-Conrad Perrault4,97945.75
Total valid votes10,883100.00
Canadian federal by-election, 17 December 1928
PartyCandidateVotes%±%
On Mr. Denis' acceptance of an office of emolument under the Crown, 3 November 1928
Liberal Charles-Édouard Ferland 5,25166.58
Liberal René-Laurier Guilbault2,63633.42
Total valid votes7,887100.00
1926 Canadian federal election
PartyCandidateVotes%±%
Liberal Jean-Joseph Denis 5,65957.39-0.43
Conservative Joseph Damien Neveu4,20242.61+0.43
Total valid votes9,861100.00
1925 Canadian federal election
PartyCandidateVotes%±%
Liberal Jean-Joseph Denis 5,63857.81-2.82
Conservative Joseph Emery Ladouceur4,11442.19+5.41
Total valid votes9,752100.00
1921 Canadian federal election
PartyCandidateVotes%±%
Liberal Jean-Joseph Denis 6,20360.63+6.95
Conservative Joseph Pierre Laporte3,76336.78
Independent Paplinuce Bonin2652.59
Total valid votes10,231100.00
1917 Canadian federal election
PartyCandidateVotes%±%
Opposition (Laurier Liberals) Jean-Joseph Denis 2,45953.68
Opposition (Laurier Liberals) Joseph Adélard Dubeau2,12246.32-2.93
Total valid votes4,581100.00
1911 Canadian federal election
PartyCandidateVotes%±%
Conservative Joseph Pierre Octave Guilbault 2,23950.75+4.74
Liberal Joseph Adélard Dubeau2,17349.25-4.74
Total valid votes4,412100.00
1908 Canadian federal election
PartyCandidateVotes%±%
Liberal Joseph Adélard Dubeau 2,17853.99+1.04
Conservative Joseph-Alexandre Guilbault1,85646.01-1.04
Total valid votes4,034100.00
1904 Canadian federal election
PartyCandidateVotes%±%
Liberal Joseph Adélard Dubeau 1,97252.95+1.76
Conservative Joseph Adolphe Renaud1,75247.05-1.76
Total valid votes3,724100.00
1900 Canadian federal election
PartyCandidateVotes%±%
Liberal Charles Bazinet 1,82251.19-3.71
Conservative Joseph Adolphe Renaud1,73748.81+3.71
Total valid votes3,559100.00
1896 Canadian federal election
PartyCandidateVotes%±%
Liberal Charles Bazinet 1,76954.90+5.87
Conservative V.P. Lavallée1,45345.10-5.87
Total valid votes3,222100.00
1891 Canadian federal election
PartyCandidateVotes%±%
Conservative Urbain Lippe 1,58150.97
Liberal Hilaire Neveu1,52149.03
Total valid votes3,102100.00
By-election on 16 January 1889

On election being declared void, 6 November 1888

PartyCandidateVotes%±%
 Nationalist Hilaire Neveu ?
Independent Conservative Édouard Guilbault ?
Total valid votes?
1887 Canadian federal election
PartyCandidateVotes%±%
Conservative Édouard Guilbault 1,53350.02-8.23
Liberal Hilaire Neveu 1,53249.98
Total valid votes3,065100.00

N.B. Mr. Guilbault elected by the casting vote of the Returning Officer.

Canadian federal by-election, 7 December 1882
PartyCandidateVotes%±%
On election being declared void, 4 November 1882
Independent Conservative Édouard Guilbault 1,07058.25+3.20
Conservative J.N.A. McConville76741.75
Total valid votes1,837100.00

Note: The change in Mr. Guilbault's popular vote is compared to his result in the 1882 general election.

1882 Canadian federal election
PartyCandidateVotes%±%
Conservative Édouard Guilbault 1,21555.05
Conservative Lewis Arthur McConville 99244.95-19.19
Total valid votes2,207100.00
Canadian federal by-election, 9 December 1880
PartyCandidateVotes%±%
On Mr. Baby being appointed Puisne Judge, Quebec Superior Court, 29 October 1880
Conservative Lewis Arthur McConville 1,22564.14+5.86
Liberal F.B. Godin68535.86-5.86
Total valid votes1,910100.00
By-election on 14 November 1878

On Mr. Baby being named Minister of Inland Revenue, 26 October 1878

PartyCandidateVotes
Conservative Louis François Georges Baby acclaimed
1878 Canadian federal election
PartyCandidateVotes%±%
Conservative Louis François Georges Baby 1,26458.28+4.15
Liberal François Benjamin Godin 90541.72
Total valid votes2,169100.00
Canadian federal by-election, 10 December 1874
PartyCandidateVotes%±%
Mr. Baby being unseated on petition, 6 November 1874
Conservative Louis François Georges Baby 1,06954.13+2.88
UnknownAmable Beaupré90645.87-2.88
Total valid votes1,975100.00
1874 Canadian federal election
PartyCandidateVotes%
Conservative Louis François Georges Baby 92451.25
UnknownA. Beaupré87948.75
Total valid votes1,803100.00
1872 Canadian federal election
PartyCandidateVotes
Conservative Louis François Georges Baby acclaimed
1867 Canadian federal election
PartyCandidateVotes%
Liberal François Benjamin Godin 91851.57
Conservative Louis François Georges Baby 86248.43
Total valid votes1780100.00

See also

Related Research Articles

<span class="mw-page-title-main">Rivière-du-Nord (electoral district)</span> Federal electoral district in Quebec, Canada

Rivière-du-Nord is a federal electoral district in Quebec, Canada, that has been represented in the House of Commons of Canada since 2004.

<span class="mw-page-title-main">Berthier—Maskinongé</span> Federal electoral district in Quebec, Canada

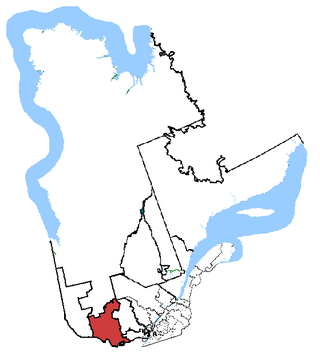
Berthier—Maskinongé is a federal electoral district in Quebec, Canada, that has been represented in the House of Commons of Canada from 1925 to 1953, from 1968 to 1988, and since 2004. Its population in 2001 was 103,516.

Roch La Salle was a Canadian politician from the province of Quebec. He represented the riding of Joliette in the House of Commons of Canada for 20 years. A popular figure, he was re-elected six times during his tenure.

<span class="mw-page-title-main">Montcalm (federal electoral district)</span> Federal electoral district in Quebec, Canada

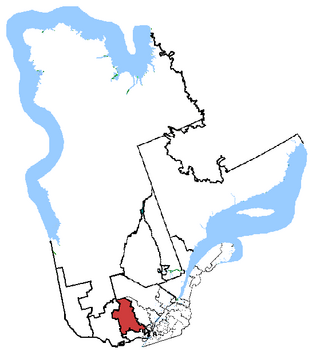
Montcalm is a federal electoral district in Quebec, Canada, which has been represented in the House of Commons of Canada from 1867 to 1917 and since 2004.

<span class="mw-page-title-main">Repentigny (federal electoral district)</span> Federal electoral district in Quebec, Canada

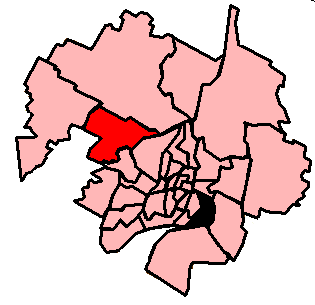
Repentigny is a federal electoral district in Quebec, Canada, that has been represented in the House of Commons of Canada since 1997. It consists of the Regional County Municipality of L'Assomption, except the city and parish of L'Épiphanie.

<span class="mw-page-title-main">Saint-Maurice—Champlain</span> Federal electoral district in Quebec, Canada

Saint-Maurice–Champlain is a federal electoral district in Quebec, Canada, that has been represented in the House of Commons of Canada since 2004.

<span class="mw-page-title-main">Terrebonne—Blainville</span> Federal electoral district in Quebec, Canada

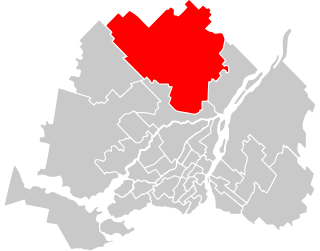
Terrebonne—Blainville was a federal electoral district in Quebec, Canada, that was represented in the House of Commons of Canada from 1997 until 2015.

<span class="mw-page-title-main">Trois-Rivières (federal electoral district)</span> Federal electoral district in Quebec, Canada

Trois-Rivières is an electoral district in Quebec, Canada that has been represented in the House of Commons of Canada from 1867 to 1892 and from 1935 to the present.

<span class="mw-page-title-main">Verchères—Les Patriotes</span> Federal electoral district in Quebec, Canada

Verchères—Les Patriotes was a federal electoral district in Quebec, Canada, that was represented in the House of Commons of Canada from 1979 until the 2012 electoral redistribution.

Chapleau was a federal electoral district in Quebec, Canada, that was represented in the House of Commons of Canada from 1935 to 1968. It is currently a Quebec provincial riding that includes the majority of the Gatineau region.

Joliette—L'Assomption—Montcalm was a federal electoral district in Quebec, Canada, that was represented in the House of Commons of Canada from 1935 to 1968.

Berthier—Maskinongé—Delanaudière was a federal electoral district in Quebec, Canada, that was represented in the House of Commons of Canada from 1953 to 1968.

Berthier—Montcalm was a federal electoral district in Quebec, Canada, that was represented in the House of Commons of Canada from 1988 to 2004.

Joliette is a provincial electoral district in the Lanaudière region of Quebec, Canada that elects members to the National Assembly of Quebec. It notably includes the cities of Joliette and Saint-Charles-Borromée.

<span class="mw-page-title-main">Terrebonne (federal electoral district)</span> Federal electoral district in Quebec, Canada

Terrebonne is a federal electoral district in the Canadian province of Quebec. It was represented in the House of Commons of Canada from 1867 to 1997, when it was dissolved in an electoral redistribution. It was reconstituted as an electoral district again beginning with the 2015 election.

References

Riding electoral history from Parliament of Canada website:

Notes

46°39′14″N73°57′43″W / 46.654°N 73.962°W / 46.654; -73.962