Terrebonne (federal electoral district)

Last updated

Terrebonne
Flag of Quebec.svg Quebec electoral district
Terrebonne (Canadian electoral district).svg
Terrebonne in relation to other electoral districts in Montreal and Laval
Federal electoral district
Legislature House of Commons
MP


Nathalie Sinclair-Desgagné
Bloc Québécois
District created1867
First contested 1867
Last contested 2021
District webpage profile, map
Demographics
Population (2011) [1] 106,322
Electors (2015)83,775
Area (km²) [1] 159
Pop. density (per km²)668.7
Census division(s) Les Moulins
Census subdivision(s) Terrebonne

Terrebonne is a federal electoral district in the Canadian province of Quebec. It was represented in the House of Commons of Canada from 1867 to 1997, when it was dissolved in an electoral redistribution. It was reconstituted as an electoral district again beginning with the 2015 election.

Contents

History

The riding was originally created by the British North America Act of 1867 which preserved existing electoral districts in Lower Canada. It was abolished in 1996 into Repentigny and Terrebonne—Blainville.

It was recreated during the 2012 federal electoral redistribution from parts of Terrebonne—Blainville (51%) and Montcalm (49%), and consists solely of the city of Terrebonne.

Demographics

According to the 2021 Canadian census [2]
Ethnic groups: 81.2% White, 11.0% Black, 2.5% Arab, 2.2% Latin American, 1.3% Indigenous
Languages: 83.8% French, 2.6% English, 2.2% Spanish, 2.1% Haitian Creole, 1.5% Arabic, 1.0% Italian
Religions: 68.9% Christian (57.5% Catholic, 1.0% Baptist, 10.4% Other), 4.3% Muslim. 26.0% None
Median income: $45,600 (2020)
Average income: $53,800 (2020)

Members of Parliament

ParliamentYearsMemberParty
Terrebonne
1st  1867–1872   Louis-Rodrigue Masson Conservative
2nd  1872–1874
3rd  1874–1878
4th  1878–1882
5th  1882–1882 Guillaume-Alphonse Nantel
 1882–1887 Joseph-Adolphe Chapleau
6th  1887–1891
7th  1891–1893
 1893–1896 Pierre-Julien Leclair
8th  1896–1900 Léon Adolphe Chauvin
9th  1900–1903   Raymond Préfontaine Liberal
 1903–1904 Samuel Desjardins
10th  1904–1908
11th  1908–1911   Wilfrid Bruno Nantel Conservative
12th  1911–1915
 1915–1917 Gédéon Rochon
13th  1917–1921   Jules-Édouard Prévost Opposition (Laurier Liberals)
14th  1921–1925   Liberal
15th  1925–1926
16th  1926–1930
17th  1930–1935 Louis-Étienne Parent
18th  1935–1940
19th  1940–1945   Lionel Bertrand Independent Liberal
20th  1945–1949   Liberal
21st  1949–1953
22nd  1953–1957
23rd  1957–1958 Raymond Raymond
24th  1958–1962   Marcel Deschambault Progressive Conservative
25th  1962–1963   Léo Cadieux Liberal
26th  1963–1965
27th  1965–1968
28th  1968–1972 Joseph-Roland Comtois
29th  1972–1974
30th  1974–1979
31st  1979–1980
32nd  1980–1984
33rd  1984–1986   Robert Toupin Progressive Conservative
 1986–1986   Independent
 1986–1987   New Democratic
 1987–1988   Independent
34th  1988–1993   Jean-Marc Robitaille Progressive Conservative
35th  1993–1997   Benoît Sauvageau Bloc Québécois
Riding dissolved into Repentigny and Terrebonne—Blainville
Riding re-created from Terrebonne—Blainville and Montcalm
42nd  2015–2018   Michel Boudrias Bloc Québécois
 2018–2018   Groupe parlementaire québécois
 2018–2019   Bloc Québécois
43rd  2019–2021
44th  2021–present Nathalie Sinclair-Desgagné

Election results

Terrebonne, 2015–present

Graph of election results in Terrebonne (since 2011, minor parties that never got 2% of the vote or didn't run consistently are omitted)
2021 Canadian federal election
PartyCandidateVotes%±%Expenditures
Bloc Québécois Nathalie Sinclair-Desgagné 24,27041.2-9.4$28,625.35
Liberal Eric Forget17,47529.6+0.3$6,336.80
Conservative Frédérick Desjardins6,18310.5+2.9$8,029.08
New Democratic Luke Mayba3,9136.6-0.9$7,745.37
Independent Michel Boudrias 3,8646.6N/A$16,574.97
People's Louis Stinziani1,5942.7+2.0$0.00
Green Dave Hamelin-Schuilenburg8472.4-2.3$103.94
Free Nathan Fortin-Dubé8031.4N/A$25.71
Total valid votes/expense limit58,94997.8$119,339.41
Total rejected ballots1,3552.2
Turnout60,30466.4
Eligible voters90,835
Bloc Québécois hold Swing -4.9
Source: Elections Canada [3]
2021 federal election redistributed results [4]
PartyVote %
  Bloc Québécois 23,29841.40
  Liberal 16,52829.37
  Conservative 5,88610.46
  New Democratic 3,7426.65
  People's 1,5062.68
  Green 8021.43
 Others4,5188.03
2019 Canadian federal election
PartyCandidateVotes%±%Expenditures
Bloc Québécois Michel Boudrias 31,02950.59+17.58$20,129.32
Liberal Frédéric Beauchemin 17,94429.26+1.26none listed
Conservative France Gagnon4,6407.57-3.78$1,869.33
New Democratic Maxime Beaudoin4,6277.54-18.07$0.33
Green Réjean Monette2,2773.71+1.97none listed
People's Jeffrey Barnes3990.65none listed
Rhinoceros Paul Vézina2600.42$0.00
Independent Jade Hébert1590.26$0.00
Total valid votes/expense limit61,33597.95
Total rejected ballots1,2822.05-0.06
Turnout62,61770.31-0.15
Eligible voters89,062
Bloc Québécois hold Swing +8.16
Source: Elections Canada [5] [6]
2015 Canadian federal election
PartyCandidateVotes%±%Expenditures
Bloc Québécois Michel Boudrias 19,23833.01+2.23$17,316.45
Liberal Michèle Audette 16,31627.99+21.07$28,471.60
New Democratic Charmaine Borg 14,92825.61-25.93$66,226.31
Conservative Michel Surprenant6,61511.35+3.28$4,734.68
Green Susan Moen1,0161.74-0.95
Strength in Democracy Louis Clément Sénat1710.29$1,208.41
Total valid votes/expense limit58,28497.89 $222,232.39
Total rejected ballots1,2562.11
Turnout59,54070.46
Eligible voters84,502
Bloc Québécois gain from New Democratic Swing +14.08
Source: Elections Canada [7] [8]
2011 federal election redistributed results [9]
PartyVote %
  New Democratic 25,62551.54
  Bloc Québécois 15,30430.78
  Conservative 4,0118.07
  Liberal 3,4406.92
  Green 1,3392.69

Terrebonne, 1867–1997

Graph of election results in Terrebonne (1957-1993, minor parties that never got 2% of the vote or didn't run consistently are omitted)
1993 Canadian federal election
PartyCandidateVotes%±%
Bloc Québécois Benoît Sauvageau 56,23568.9
Liberal Claire Brouillet14,62317.9-0.6
Progressive Conservative Jean-Marc Robitaille9,49611.6-41.1
New Democratic Renée-Claude Lorimier8731.1-9.7
Commonwealth of Canada Christian Chouery4450.5
Total valid votes81,672 100.0
1988 Canadian federal election
PartyCandidateVotes%±%
Progressive Conservative Jean-Marc Robitaille 35,34552.8-7.5
Liberal Claire Brouillet12,42218.5-7.7
Independent Robert Toupin 10,39015.5
New Democratic Lauraine Vaillancourt7,19410.7+1.9
Rhinoceros Alain Cowboy De Lagrave1,6472.5
Total valid votes66,998 100.0
1984 Canadian federal election
PartyCandidateVotes%±%
Progressive Conservative Robert Toupin 43,82260.30
Liberal Joseph-Roland Comtois (incumbent)19,04026.20
New Democratic Brian Umansky6,4548.88
Parti nationaliste Jean-A. Bonin3,0604.21
Commonwealth of Canada Claude Brosseau2920.40
Total valid votes72,668100.00
Total rejected ballots1,634
Turnout74,30274.93
Electors on the lists99,162
Source: Report of the Chief Electoral Officer, Thirty-third General Election, 1984.
1980 Canadian federal election
PartyCandidateVotes%±%
Liberal Joseph-Roland Comtois 36,08968.3+6.0
New Democratic Gilles Bertrand6,91713.1+7.5
Progressive Conservative Jacques Dupuis4,807+9.1-1.4
Social Credit Georgette Grenier2,8395.4-12.9
Rhinoceros Pédro Gervais G.D. Drapeau1,8443.5+1.2
Union populaire Réal Godin2330.4-0.1
Marxist–Leninist Jacques Coderre1310.20.0
Total valid votes52,860 100.0
1979 Canadian federal election
PartyCandidateVotes%±%
Liberal Joseph-Roland Comtois 34,83962.3+7.2
Social Credit Georgette Grenier10,23918.3+14.0
Progressive Conservative Louis-Rhéal Tremblay5,84510.5-23.8
New Democratic Roland Francis3,1145.6+2.7
Rhinoceros Jean-Marie Da Silva1,3062.3
Union populaire Réal Godin2980.5
Marxist–Leninist André Cousineau1640.3
Communist Gaétan Trudel1220.2
Total valid votes55,927 100.0
Canadian federal by-election, 24 May 1977
PartyCandidateVotes%±%
On Mr. Comtois' resignation, 25 October 1976
Liberal Joseph-Roland Comtois 25,00655.1-1.1
Progressive Conservative Roger Delorme15,53934.2+14.8
Social Credit Jean Léveillé1,9494.3-11.7
New Democratic Pierre Demers1,2992.9-4.6
Independent Gilles Mélançon1,1512.5
Communist Claude Demers2900.6+0.1
Independent J. Noël St-Michel1670.4
Total valid votes45,401 100.0
1974 Canadian federal election
PartyCandidateVotes%±%
Liberal Joseph-Roland Comtois 28,65256.1+9.1
Progressive Conservative Gilles Mélançon9,89719.4-5.4
Social Credit Guy Meunier8,13815.9-4.6
New Democratic Pierre Demers3,8127.5-0.1
Marxist–Leninist Françoise Daoust2720.5
Communist Nicole Ledoux2650.5
Total valid votes51,036 100.0
1972 Canadian federal election
PartyCandidateVotes%±%
Liberal Joseph-Roland Comtois 24,92847.1-15.0
Social Credit Guy Meunier13,13624.8+20.8
Progressive Conservative Michel Coté10,88520.5+0.3
New Democratic Pierre Demers4,0227.6-3.7
Total valid votes52,971 100.0

Note: Social Credit vote is compared to Ralliement créditiste vote in the 1968 election.

1968 Canadian federal election
PartyCandidateVotes%±%
Liberal Joseph-Roland Comtois 21,19162.0+17.8
Progressive Conservative Jacques Vachon6,93420.3-7.1
New Democratic Jean-Maurice Sénécal3,86011.3-2.9
Ralliement créditiste Rosario Therrien1,3634.0-10.2
Démocratisation Économique Pierre Therrien8242.4
Total valid votes34,172 100.0
1965 Canadian federal election
PartyCandidateVotes%±%
Liberal Léo Cadieux 16,80644.2-1.8
Progressive Conservative André Fauteux10,41727.4+15.8
Ralliement créditiste Jean-Marc Fontaine5,41214.2-18.7
New Democratic Jean-Maurice Sénécal5,38414.2+4.7
Total valid votes38,019 100.0

Note: Ralliement créditiste vote is compared to Social Credit vote in the 1963 election.

1963 Canadian federal election
PartyCandidateVotes%±%
Liberal Léo Cadieux 19,01546.0+6.8
Social Credit Hubert Murray13,61833.0+9.6
Progressive Conservative Bert Walker4,79811.6-16.5
New Democratic Gérard Gagnon3,8959.4+0.1
Total valid votes41,326 100.0
1962 Canadian federal election
PartyCandidateVotes%±%
Liberal Léo Cadieux 15,54739.2-9.4
Progressive Conservative Marcel Deschambault11,15528.1-23.3
Social Credit Lucien Bachand9,26923.4
New Democratic Jean Philip3,6809.3
Total valid votes39,651 100.0
1958 Canadian federal election
PartyCandidateVotes%±%
Progressive Conservative Marcel Deschambault 19,31951.4+11.5
Liberal Raymond Raymond18,24148.6-11.5
Total valid votes37,560 100.0
1957 Canadian federal election
PartyCandidateVotes%
Liberal Raymond Raymond 19,51560.1
Progressive Conservative Marcel Deschambault12,97339.9
Total valid votes32,488 100.0
1953 Canadian federal election
PartyCandidateVotes
Liberal Lionel Bertrand acclaimed
1949 Canadian federal election
PartyCandidateVotes%±%
Liberal Lionel Bertrand 18,30466.9+0.2
Progressive Conservative Lucien Thinel8,10729.6
Union des électeurs Jean-Paul Houle9533.5
Total valid votes27,364 100.0
1945 Canadian federal election
PartyCandidateVotes%±%
Liberal Lionel Bertrand 15,38366.6+26.9
Bloc populaire Henri Dionne6,72629.1
Independent Charles Aubry6913.0
Co-operative Commonwealth Louis-Philippe Lebel2811.2
Total valid votes23,081 100.0
1940 Canadian federal election
PartyCandidateVotes%±%
Independent Liberal Lionel Bertrand 7,83944.9
Liberal Louis-Étienne Parent 6,93839.8-25.3
National Government Léopold Lachapelle2,66815.3-11.9
Total valid votes17,445 100.0

Note: "National Government" vote is compared to Conservative vote in 1935 election.

1935 Canadian federal election
PartyCandidateVotes%±%
Liberal Louis-Étienne Parent 9,90065.1+8.9
Conservative Léopold Nantel4,14127.2-16.6
Liberal Eugène Léveillé1,1727.7
Total valid votes15,213 100.0
1930 Canadian federal election
PartyCandidateVotes%±%
Liberal Louis-Étienne Parent 8,60956.1-19.5
Conservative Guillaume-André Fauteux6,72743.9+19.5
Total valid votes15,336 100.0
1926 Canadian federal election
PartyCandidateVotes%±%
Liberal Jules-Édouard Prévost 7,06075.7+3.4
Conservative Léopold Nantel2,27024.3-3.4
Total valid votes9,330 100.0
1925 Canadian federal election
PartyCandidateVotes%±%
Liberal Jules-Édouard Prévost 6,78972.2+1.3
Conservative Léopold Nantel2,60927.8-1.3
Total valid votes9,398 100.0
1921 Canadian federal election
PartyCandidateVotes%
Liberal Jules-Édouard Prévost 8,88271.0
Conservative Guillaume-André Fauteux3,63629.0
Total valid votes12,518 100.0
1917 Canadian federal election
PartyCandidateVotes
Opposition (Laurier Liberals) Jules-Édouard Prévost acclaimed
Canadian federal by-election, 8 February 1915
PartyCandidateVotes%
Conservative Gédéon Rochon 2,19353.6
UnknownJoseph-Alphonse Beaulieu1,89546.4
Total valid votes4,088 100.0
Called upon Mr. Nantel being appointed Railway Commissioner, 20 October 1914.
By-election on 27 October 1911

On Mr. Nantel being appointed Minister of Inland Revenue, 10 October 1911

PartyCandidateVotes
Conservative Wilfrid-Bruno Nantel acclaimed
1911 Canadian federal election
PartyCandidateVotes%±%
Conservative Wilfrid Bruno Nantel 2,72756.5+5.7
Liberal Samuel Desjardins2,10143.5-5.7
Total valid votes4,828 100.0
1908 Canadian federal election
PartyCandidateVotes%±%
Conservative Wilfrid Bruno Nantel 2,59250.8+2.7
Liberal Thibaudeau Rinfret 2,51349.2-2.7
Total valid votes5,105 100.0
1904 Canadian federal election
PartyCandidateVotes%±%
Liberal Samuel Desjardins 2,48151.9-1.5
Conservative W. Bruno Nantel2,29748.1+1.5
Total valid votes4,778 100.0
Canadian federal by-election, 24 February 1903
PartyCandidateVotes%±%
Préfontaine was appointed Minister of
Marine and Fisheries, 11 November 1902
Liberal Samuel Desjardins 2,32553.4+0.3
Conservative A.H. Masson2,02946.6-0.3
Total valid votes4,354 100.0
1900 Canadian federal election
PartyCandidateVotes%±%
Liberal Raymond Préfontaine 2,27753.1+4.9
Conservative Léon-Adolphe Chauvin 2,01046.9-4.9
Total valid votes4,287 100.0
1896 Canadian federal election
PartyCandidateVotes%±%
Conservative Léon-Adolphe Chauvin 1,86251.8-10.1
Liberal P.F.C. Petit1,73448.2+10.1
Total valid votes3,596 100.0

Note: popular vote is compared to vote in 1891 general election.

By-election on 10 January 1893

Chapleau was appointed Lieutenant-Governor
of Quebec, 7 December 1892

PartyCandidateVotes
Conservative Pierre Leclaire acclaimed
1891 Canadian federal election
PartyCandidateVotes%±%
Conservative Joseph-Adolphe Chapleau 1,83061.9-1.8
Liberal M.D. Limoges1,12638.1+1.8
Total valid votes2,956 100.0
1887 Canadian federal election
PartyCandidateVotes%±%
Conservative Joseph-Adolphe Chapleau 1,81963.8-1.8
Liberal M.J. Therrien1,03436.2
Total valid votes2,853 100.0
By-election on 16 August 1882

To allow Mr. Chapleau to run for office.

PartyCandidateVotes
Conservative Joseph-Adolphe Chapleau acclaimed

Note: popular vote is compared to vote in 1882 general election.

1882 Canadian federal election
PartyCandidateVotes%±%
Conservative Guillaume-Alphonse Nantel 1,59365.6-21.3
UnknownA.E. Poirier83634.4
Total valid votes2,429 100.0

Note: popular vote is compared to vote in 1878 general election.

By-election on 6 November 1878

Masson was appointed Minister of
Militia and Defence, 19 October 1878

PartyCandidateVotes
Conservative Louis-Rodrigue Masson acclaimed
1878 Canadian federal election
PartyCandidateVotes%
Conservative Louis-Rodrigue Masson 1,19486.8
UnknownB. Longpré A18113.2
Total valid votes1,375 100.0
1874 Canadian federal election
PartyCandidateVotes
Conservative Louis-Rodrigue Masson acclaimed
1872 Canadian federal election
PartyCandidateVotes
Conservative Louis-Rodrigue Masson acclaimed
Source: Canadian Elections Database [10]
1867 Canadian federal election
PartyCandidateVotes
Conservative Louis-Rodrigue Masson acclaimed
Source: Canadian Elections Database [11]

Related Research Articles

<span class="mw-page-title-main">Mount Royal (electoral district)</span> Federal electoral district in Quebec, Canada

Mount Royal is a federal electoral district in Quebec, Canada, that has been represented in the House of Commons of Canada since 1925. Its population in 2006 was 98,888.

<span class="mw-page-title-main">Louis-Hébert (federal electoral district)</span> Federal electoral district in Quebec, Canada

Louis-Hébert is a federal electoral district in the Canadian province of Quebec. Represented in the House of Commons since 1968, its population was certified, according to the detailed statistics of 2001, as 98,156.

<span class="mw-page-title-main">Saint-Hyacinthe—Bagot</span> Federal electoral district in Quebec, Canada

Saint-Hyacinthe—Bagot is a federal electoral district that has been represented in the House of Commons of Canada since 1935. It is located in Quebec, Canada. Its population in 2006 was 95,983. In the 2015 election, the winner received the lowest vote percentage of any winning candidate in the country.

<span class="mw-page-title-main">Hochelaga (electoral district)</span> Federal electoral district in Quebec, Canada

Hochelaga is a federal electoral district in Quebec, Canada, that has been represented in the House of Commons of Canada from 1867 to 1988 and since 2004.
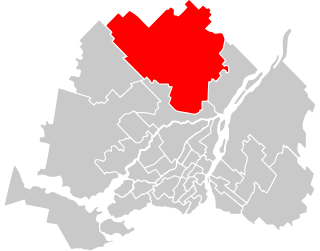
<span class="mw-page-title-main">Longueuil—Saint-Hubert</span> Federal electoral district in Quebec, Canada

Longueuil—Saint-Hubert is a federal electoral district in Quebec, Canada, represented in the House of Commons of Canada from since 2015

<span class="mw-page-title-main">Beauce (electoral district)</span> Federal electoral district in Quebec, Canada

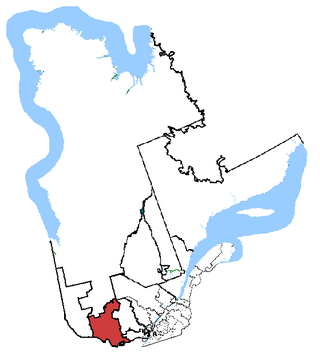
Beauce is a federal electoral district in Quebec, Canada, that has been represented in the House of Commons of Canada since 1867. In 2006, it had a population of 103,617 people, of whom 82,123 were eligible voters.

<span class="mw-page-title-main">Shefford (federal electoral district)</span> Federal electoral district in Quebec, Canada

Shefford is a federal electoral district in Quebec, Canada, that has been represented in the House of Commons of Canada since 1867. Its population in 2006 was 100,000.

<span class="mw-page-title-main">Portneuf—Jacques-Cartier</span> Federal electoral district in Quebec, Canada

Portneuf—Jacques-Cartier is a federal electoral district in Quebec, Canada, that has been represented in the House of Commons of Canada since 1867. Its population in 2001 was 87,141. It is currently represented by Joël Godin of the Conservative Party of Canada.

<span class="mw-page-title-main">Joliette (federal electoral district)</span> Federal electoral district in Quebec, Canada

Joliette is a federal electoral district in Quebec, Canada, that has been represented in the House of Commons of Canada from 1867 to 1935 and since 1968.

<span class="mw-page-title-main">Pontiac (federal electoral district)</span> Federal electoral district in Quebec, Canada

Pontiac is a federal electoral district in western Quebec, Canada, that has been represented in the House of Commons of Canada from 1867 to 1949 and since 1968.

Chicoutimi—Le Fjord is a federal electoral district in Quebec, Canada, that has been represented in the House of Commons of Canada since 1925. The riding consists of the northern part of the Chicoutimi borough of Saguenay, as well as the La Baie borough and the municipalities of Ferland-et-Boilleau, L'Anse-Saint-Jean, Petit-Saguenay, Rivière-Éternité and Saint-Félix-d'Otis and the unorganized territory of Lalemant.

<span class="mw-page-title-main">Gatineau (federal electoral district)</span> Federal electoral district in Quebec, Canada

Gatineau is a federal electoral district in Quebec, Canada, represented in the House of Commons of Canada from since 1949. Between 1987 and 1996, it was known as "Gatineau—La Lièvre".

<span class="mw-page-title-main">Brome—Missisquoi</span> Federal electoral district in Quebec, Canada

Brome—Missisquoi is a federal electoral district in Quebec, Canada, that has been represented in the House of Commons of Canada since 1925. The original electoral district of Missiquoi existed from 1867 to 1925.

<span class="mw-page-title-main">Hull—Aylmer</span> Federal electoral district in Quebec, Canada

Hull—Aylmer is a federal electoral district in Quebec, Canada, that has been represented in the House of Commons of Canada since 1917.

<span class="mw-page-title-main">Montcalm (federal electoral district)</span> Federal electoral district in Quebec, Canada

Montcalm is a federal electoral district in Quebec, Canada, which has been represented in the House of Commons of Canada from 1867 to 1917 and since 2004.

<span class="mw-page-title-main">Sherbrooke (federal electoral district)</span> Federal electoral district in Quebec, Canada

Sherbrooke is a federal electoral district in Quebec, Canada, that has been represented in the House of Commons of Canada since 1925.

<span class="mw-page-title-main">Trois-Rivières (federal electoral district)</span> Federal electoral district in Quebec, Canada

Trois-Rivières is an electoral district in Quebec, Canada that has been represented in the House of Commons of Canada from 1867 to 1892 and from 1935 to the present.

Vaudreuil—Soulanges is a federal electoral district in Quebec, Canada, that has been represented in the House of Commons of Canada since 1867.

<span class="mw-page-title-main">Québec (electoral district)</span> Federal electoral district in Quebec, Canada

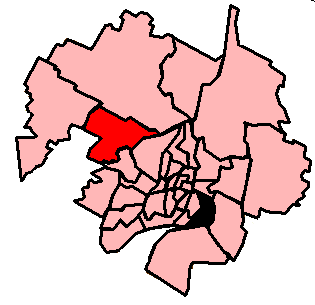
Québec is a federal electoral district that has been represented in the House of Commons of Canada since 1968. It is located in Quebec City in the province of Quebec, Canada.

<span class="mw-page-title-main">Thérèse-De Blainville</span> Federal electoral district in Quebec, Canada

Thérèse-De Blainville is a federal electoral district in Quebec.

References

  1. 1 2 Statistics Canada: 2012
  2. Government of Canada, Statistics Canada (February 9, 2022). "Profile table, Census Profile, 2021 Census of Population - Terrebonne [Federal electoral district (2013 Representation Order)], Quebec". www12.statcan.gc.ca. Retrieved October 12, 2023.
  3. "List of confirmed candidates – September 20, 2021 Federal Election". Elections Canada . Retrieved September 2, 2021.
  4. "Transposition of Votes from the 44th General Election to the 2023 Representation Orders". Elections Canada . Retrieved April 9, 2024.
  5. "List of confirmed candidates". Elections Canada. Retrieved October 3, 2019.
  6. "Official Voting Results". Elections Canada. Retrieved August 15, 2021.
  7. Elections Canada – Confirmed candidates for Terrebonne, 30 September 2015
  8. Elections Canada – Preliminary Election Expenses Limits for Candidates
  9. Pundits' Guide To Canadian Elections
  10. Sayers, Anthony M. "1872 Federal Election". Canadian Elections Database. Archived from the original on February 3, 2024.
  11. Sayers, Anthony M. "1867 Federal Election". Canadian Elections Database. Archived from the original on January 22, 2024.