South Australian state election, 26 March 1927 [1] Contents | ||||||
---|---|---|---|---|---|---|
Enrolled voters | 309,588 | |||||
Votes cast | 214,738 | Turnout | 77.43% | +14.71% | ||
Informal votes | 3,943 | Informal | N/A | |||
Summary of votes by party | ||||||
Party | Primary votes | % | Swing | Seats | Change | |
Labor | 243,450 | 47.99% | +0.65% | 16 | – 11 | |
Liberal Federation | 203,050 | 40.02% | –1.68% | 23 | + 6 | |
Country | 27,617 | 5.44% | –3.56% | 5 | + 3 | |
Protestant Labor | 10,560 | 2.08% | +2.08% | 1 | + 1 | |
Single Tax League | 1,923 | 0.40% | –0.20% | 0 | ± 0 | |
Independent | 20,720 | 5.10% | +4.60% | 1 | + 1 | |
Total | 507,320 | 46 |
This is a list of House of Assembly results for the 1927 South Australian state election. Each district elected multiple members.
Every voter would receive a ballot paper where they would cast two or three votes for different candidates. In electorates that were not unopposed, the two or three candidates with the most votes would be elected.
Party | Candidate | Votes | % | ±% | |
---|---|---|---|---|---|
Labor | Bill Denny (elected) | 7,412 | 25.4 | -4.8 | |
Labor | Bert Edwards (elected) | 7,149 | 24.5 | -5.1 | |
Labor | Herbert George (elected) | 7,095 | 24.3 | +24.3 | |
Liberal Federation | Donald Kerr | 2,688 | 9.2 | +9.2 | |
Liberal Federation | Francis Hicks | 2,200 | 7.5 | +7.5 | |
Liberal Federation | Agnes Goode | 2,189 | 7.5 | +0.7 | |
Independent | Cecil Skitch | 503 | 1.7 | +1.7 | |
Total formal votes | 29,236 10,299 ballots | 97.5 | −0.5 | ||
Informal votes | 266 | 2.5 | +0.5 | ||
Turnout | 10,565 | 73.4 | +22.7 | ||
Party total votes | |||||
Labor | 21,656 | 74.1 | -16.9 | ||
Liberal Federation | 7,077 | 24.2 | +17.4 | ||
Independent | Cecil Skitch | 503 | 1.7 | +1.7 |
Party | Candidate | Votes | % | ±% | |
---|---|---|---|---|---|
Country | Malcolm McIntosh (elected) | 5,809 | 29.7 | -8.5 | |
Country | Frederick McMillan (elected) | 5,643 | 28.9 | -8.5 | |
Labor | Richard McKenzie | 4,092 | 20.9 | +20.9 | |
Labor | Henry Dalziel | 4,000 | 20.5 | +20.5 | |
Total formal votes | 19,544 10,067 ballots | 98.8 | −0.6 | ||
Informal votes | 120 | 1.2 | +0.6 | ||
Turnout | 10,187 | 76.1 | +22.8 | ||
Party total votes | |||||
Country | 11,452 | 58.6 | -17.0 | ||
Labor | 8,092 | 41.4 | +41.4 |
Party | Candidate | Votes | % | ±% | |
---|---|---|---|---|---|
Liberal Federation | Percy Heggaton (elected) | unopposed | |||
Liberal Federation | Herbert Hudd (elected) | unopposed | |||
Liberal Federation | George Laffer (elected) | unopposed |
Party | Candidate | Votes | % | ±% | |
---|---|---|---|---|---|
Independent | Herbert Basedow (elected) | 5,766 | 18.4 | +10.2 | |
Labor | George Cooke (elected) | 5,241 | 16.7 | +0.4 | |
Liberal Federation | Henry Crosby (elected) | 5,152 | 16.4 | +1.1 | |
Liberal Federation | Reginald Rudall | 5,056 | 16.1 | +16.1 | |
Labor | Leonard Hopkins | 5,014 | 16.0 | +0.4 | |
Liberal Federation | Herbert Lyons | 4,870 | 15.5 | +15.5 | |
Independent | Albert Davies | 282 | 0.9 | +0.9 | |
Total formal votes | 31,371 10,816 ballots | 98.9 | +0.4 | ||
Informal votes | 123 | 1.1 | −0.4 | ||
Turnout | 10,939 | 86.0 | +15.6 | ||
Party total votes | |||||
Liberal Federation | 15,078 | 48.0 | +1.9 | ||
Labor | 10,255 | 32.7 | +0.8 | ||
Independent | Herbert Basedow | 5,766 | 18.4 | +10.2 | |
Independent | Albert Davies | 282 | 0.9 | +0.9 |
Party | Candidate | Votes | % | ±% | |
---|---|---|---|---|---|
Liberal Federation | George Jenkins (elected) | 5,719 | 17.6 | +5.0 | |
Country | Reginald Carter (elected) | 5,420 | 16.7 | +11.6 | |
Liberal Federation | Francis Jettner (elected) | 5,407 | 16.7 | +5.8 | |
Labor | Albert Hawke | 5,396 | 16.7 | +1.9 | |
Labor | Sydney McHugh | 5,239 | 16.2 | +1.2 | |
Labor | Mick O'Halloran | 5,231 | 16.1 | +0.1 | |
Total formal votes | 32,412 11,040 ballots | 98.8 | +0.8 | ||
Informal votes | 133 | 1.2 | −0.8 | ||
Turnout | 11,173 | 82.5 | +13.5 | ||
Party total votes | |||||
Labor | 15,866 | 49.0 | +3.2 | ||
Liberal Federation | 11,126 | 34.3 | -1.7 | ||
Country | 5,420 | 16.7 | -1.6 |
Party | Candidate | Votes | % | ±% | |
---|---|---|---|---|---|
Liberal Federation | Frederick Coneybeer (elected) | 15,372 | 20.1 | +3.3 | |
Liberal Federation | Walter Hamilton (elected) | 14,330 | 18.8 | +3.1 | |
Liberal Federation | Albert Sutton (elected) | 13,790 | 18.1 | +2.4 | |
Labor | Leslie Hunkin | 12,619 | 16.5 | -1.6 | |
Labor | Beasley Kearney | 10,111 | 13.2 | +13.2 | |
Labor | James Flaherty | 10,109 | 13.2 | +13.2 | |
Total formal votes | 76,331 26,387 ballots | 98.2 | −0.8 | ||
Informal votes | 494 | 1.8 | +0.8 | ||
Turnout | 26,881 | 75.8 | +13.1 | ||
Party total votes | |||||
Liberal Federation | 43,492 | 57.0 | +8.8 | ||
Labor | 32,839 | 43.0 | -8.8 |
Party | Candidate | Votes | % | ±% | |
---|---|---|---|---|---|
Liberal Federation | James Moseley (elected) | 3,680 | 25.6 | +8.1 | |
Country | Edward Coles (elected) | 3,459 | 24.0 | +24.0 | |
Labor | John O'Connor | 3,318 | 23.1 | +8.7 | |
Labor | James Pollard | 2,017 | 14.0 | +14.0 | |
Single Tax League | Edward Craigie | 1,923 | 13.4 | +3.0 | |
Total formal votes | 14,397 7,704 ballots | 98.2 | −0.4 | ||
Informal votes | 140 | 1.8 | +0.4 | ||
Turnout | 7,844 | 75.5 | +11.7 | ||
Party total votes | |||||
Labor | 5,335 | 37.1 | +8.5 | ||
Liberal Federation | 3,680 | 25.6 | -2.7 | ||
Country | 3,459 | 24.0 | 0.0 | ||
Single Tax League | 1,923 | 13.4 | -5.8 |
Party | Candidate | Votes | % | ±% | |
---|---|---|---|---|---|
Labor | Clement Collins (elected) | 5,031 | 17.0 | -0.7 | |
Liberal Federation | Hermann Homburg (elected) | 4,993 | 16.8 | +1.0 | |
Liberal Federation | Ernest Hannaford (elected) | 4,893 | 16.5 | +16.5 | |
Liberal Federation | John Randell | 4,715 | 15.9 | -0.6 | |
Labor | Frank Staniford | 4,327 | 14.6 | -3.1 | |
Labor | Alec Gniel | 4,158 | 14.0 | +14.0 | |
Independent | John Godfree | 1,561 | 5.3 | +5.3 | |
Total formal votes | 29,678 10,191 ballots | 98.4 | −1.0 | ||
Informal votes | 172 | 1.6 | +1.0 | ||
Turnout | 10.363 | 83.2 | +19.6 | ||
Party total votes | |||||
Liberal Federation | 14,601 | 49.2 | -0.5 | ||
Labor | 13,516 | 45.6 | -4.7 | ||
Independent | John Godfree | 1,561 | 5.3 | +5.3 |
Party | Candidate | Votes | % | ±% | |
---|---|---|---|---|---|
Labor | Thomas Butterfield (elected) | 2,776 | 30.5 | -9.4 | |
Labor | William Harvey (elected) | 2,678 | 29.5 | -8.2 | |
Liberal Federation | Philip McBride | 1,853 | 20.4 | +20.4 | |
Country | Sydney Castine | 1,785 | 19.6 | +19.6 | |
Total formal votes | 9,092 4,670 ballots | 98.2 | −0.1 | ||
Informal votes | 85 | 1.8 | +0.1 | ||
Turnout | 4,755 | 76.5 | +12.1 | ||
Party total votes | |||||
Labor | 5,454 | 60.0 | -17.6 | ||
Liberal Federation | 1,853 | 20.4 | -2.0 | ||
Country | 1,785 | 19.6 | +19.6 |
Party | Candidate | Votes | % | ±% | |
---|---|---|---|---|---|
Labor | Frederick Birrell (elected) | 7,875 | 25.5 | -2.0 | |
Liberal Federation | Shirley Jeffries (elected) | 7,811 | 25.3 | +2.1 | |
Liberal Federation | Victor Newland | 7,705 | 25.0 | +25.0 | |
Labor | Stanley Whitford | 7,450 | 24.2 | -2.9 | |
Total formal votes | 30,841 15,765 ballots | 97.8 | −1.2 | ||
Informal votes | 352 | 2.2 | +1.2 | ||
Turnout | 16,117 | 78.0 | +15.4 | ||
Party total votes | |||||
Liberal Federation | 15,516 | 50.3 | +4.9 | ||
Labor | 15,325 | 49.7 | -4.9 |
Party | Candidate | Votes | % | ±% | |
---|---|---|---|---|---|
Labor | John Jonas (elected) | 14,512 | 40.9 | +40.9 | |
Protestant Labor | Thomas Thompson (elected) | 10,560 | 29.8 | +29.8 | |
Labor | Frank Condon | 10,375 | 29.3 | -11.7 | |
Total formal votes | 35,447 20,507 ballots | 98.4 | −0.6 | ||
Informal votes | 334 | 1.6 | +0.6 | ||
Turnout | 20,841 | 77.2 | +13.1 | ||
Party total votes | |||||
Labor | 24,887 | 70.2 | -15.2 | ||
Protestant Labor | 10,560 | 29.8 | +29.8 |
Party | Candidate | Votes | % | ±% | |
---|---|---|---|---|---|
Labor | John Fitzgerald (elected) | unopposed | |||
Labor | Lionel Hill (elected) | unopposed |
Party | Candidate | Votes | % | ±% | |
---|---|---|---|---|---|
Liberal Federation | John Lyons (elected) | 5,066 | 39.8 | +39.8 | |
Liberal Federation | Robert Nicholls (elected) | 5,002 | 29.3 | -1.3 | |
Independent | Peter Gillen | 2,648 | 20.8 | +20.8 | |
Total formal votes | 12,716 7,530 ballots | 98.3 | +0.1 | ||
Informal votes | 130 | 1.7 | −0.1 | ||
Turnout | 7,660 | 79.8 | +9.8 | ||
Party total votes | |||||
Liberal Federation | 10,068 | 79.2 | +22.4 | ||
Independent | Peter Gillen | 2,648 | 20.8 | +20.8 |
Party | Candidate | Votes | % | ±% | |
---|---|---|---|---|---|
Liberal Federation | Herbert Richards (elected) | 19,642 | 19.1 | +1.4 | |
Liberal Federation | Ernest Anthoney (elected) | 19,485 | 19.0 | +1.5 | |
Liberal Federation | Edward Vardon (elected) | 18,939 | 18.4 | +1.3 | |
Labor | Bob Dale | 14,114 | 13.7 | +13.7 | |
Labor | Thomas Grealy | 14,015 | 13.6 | -2.9 | |
Labor | Francis McCabe | 13,417 | 13.1 | +13.1 | |
Independent | Edmund Craig | 3,162 | 3.1 | +3.1 | |
Total formal votes | 102,774 35,272 ballots | 97.6 | −1.6 | ||
Informal votes | 865 | 2.4 | +1.6 | ||
Turnout | 36,137 | 75.3 | +17.5 | ||
Party total votes | |||||
Liberal Federation | 58,066 | 56.5 | +4.2 | ||
Labor | 41,546 | 40.4 | -7.3 | ||
Independent | Edward Craig | 3,162 | 3.1 | +3.1 |
Party | Candidate | Votes | % | ±% | |
---|---|---|---|---|---|
Liberal Federation | Peter Reidy (elected) | 6,079 | 29.1 | +1.7 | |
Labor | Eric Shepherd (elected) | 5,410 | 25.9 | +0.1 | |
Liberal Federation | Vernon Petherick | 5,122 | 24.5 | -0.1 | |
Labor | Francis Young | 4,291 | 20.5 | +20.5 | |
Total formal votes | 20,902 10,630 ballots | 99.2 | −0.1 | ||
Informal votes | 81 | 0.8 | +0.1 | ||
Turnout | 10,711 | 89.4 | +14.8 | ||
Party total votes | |||||
Liberal Federation | 11,201 | 53.6 | +1.6 | ||
Labor | 9,701 | 46.4 | -1.6 |
Party | Candidate | Votes | % | ±% | |
---|---|---|---|---|---|
Labor | John Pedler (elected) | unopposed | |||
Labor | Robert Richards (elected) | unopposed |
Party | Candidate | Votes | % | ±% | |
---|---|---|---|---|---|
Labor | Alfred Blackwell (elected) | 15,549 | 42.3 | ||
Labor | John McInnes (elected) | 14,369 | 39.1 | ||
Independent | Raphael Cilento | 6,808 | 18.5 | ||
Total formal votes | 36,726 21,103 ballots | 97.4 | |||
Informal votes | 572 | 2.6 | |||
Turnout | 21,675 | 71.2 | |||
Party total votes | |||||
Labor | 29,918 | 82.5 | |||
Independent | Raphael Cilento | 6,808 | 18.5 |
}
Party | Candidate | Votes | % | ±% | |
---|---|---|---|---|---|
Liberal Federation | James McLachlan (elected) | 5,719 | 22.1 | +8.7 | |
Liberal Federation | Richard Butler (elected) | 5,573 | 21.6 | +8.9 | |
Country | Archie Cameron (elected) | 5,501 | 21.3 | +11.5 | |
Labor | Allan Robertson | 3,370 | 13.0 | +0.9 | |
Labor | Reginald Reincke | 2,857 | 11.1 | +11.1 | |
Labor | William Jarrad | 2,833 | 11.0 | +11.0 | |
Total formal votes | 25,853 8,814 ballots | 99.1 | −0.1 | ||
Informal votes | 76 | 0.9 | +0.1 | ||
Turnout | 8,890 | 80.3 | +7.4 | ||
Party total votes | |||||
Liberal Federation | 11,292 | 43.7 | +5.7 | ||
Labor | 9,060 | 35.1 | +0.7 | ||
Country | 5,501 | 21.3 | -6.4 |
Party | Candidate | Votes | % | ±% | |
---|---|---|---|---|---|
Liberal Federation | Edward Giles (elected) | unopposed | |||
Liberal Federation | Henry Tossell (elected) | unopposed |
The electoral system of Australia comprises the laws and processes used for the election of members of the Australian Parliament and is governed primarily by the Commonwealth Electoral Act 1918. The system presently has a number of distinctive features including compulsory enrolment; compulsory voting; majority-preferential instant-runoff voting in single-member seats to elect the lower house, the House of Representatives; and the use of the single transferable vote proportional representation system to elect the upper house, the Senate.
Electoral systems of the Australian states and territories are broadly similar to the electoral system used in federal elections in Australia.
The Legislative Council, or upper house, is one of the two chambers of the Parliament of South Australia. Its central purpose is to act as a house of review for legislation passed through the lower house, the House of Assembly. It sits in Parliament House in the state capital, Adelaide.
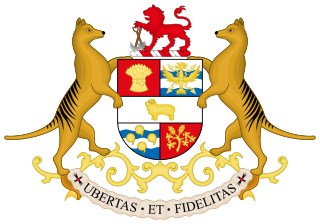
The House of Assembly, or Lower House, is one of the two chambers of the Parliament of Tasmania in Australia. The other is the Legislative Council or Upper House. It sits in Parliament House in the state capital, Hobart.
The Parliament of South Australia is the bicameral legislature of the Australian state of South Australia. It consists of the 47-seat House of Assembly and the 22-seat Legislative Council. General elections are held every 4 years, with all of the lower house and half of the upper house filled at each election. It follows a Westminster system of parliamentary government with the executive branch required to both sit in parliament and hold the confidence of the House of Assembly. The parliament is based at Parliament House on North Terrace in the state capital of Adelaide.
The Western Australian Legislative Council is the upper house of the Parliament of Western Australia, a state of Australia. It is regarded as a house of review for legislation passed by the Legislative Assembly, the lower house. The two Houses of Parliament sit in Parliament House in the state capital, Perth.
Lang Labor was a faction of the Australian Labor Party (ALP) consisting of the supporters of Jack Lang, who served two terms as Premier of New South Wales and was the party's state leader from 1923 to 1939. It controlled the New South Wales branch of the ALP throughout most of the 1920s and 1930s. The faction broke away to form separate parliamentary parties on several occasions and stood competing candidates against the ALP in state and federal elections.
John Verran was an Australian politician and trade unionist. He served as premier of South Australia from 1910 to 1912, the second member of the Australian Labor Party (ALP) to hold the position.
State elections were held in South Australia on 17 September 1977. All 47 seats in the South Australian House of Assembly were up for election. The incumbent Australian Labor Party led by Premier of South Australia Don Dunstan won a fourth term in government, defeating the Liberal Party of Australia led by Leader of the Opposition David Tonkin.
The 1968South AustralianState election was held in South Australia on 2 March 1968. All 39 seats in the South Australian House of Assembly were up for election; 38 of the 39 contests were won by candidates from Australia's two major political parties. The incumbent Labor Party South Australia led by Premier of South Australia Don Dunstan and the Liberal and Country League led by Leader of the Opposition Steele Hall) both won 19 seats. The sole independent candidate to win a race, Tom Stott of the Ridley electorate, joined with the LCL's 19 seats to form a coalition government that held a 20 to 19 majority, thus defeating the Dunstan Labor government.
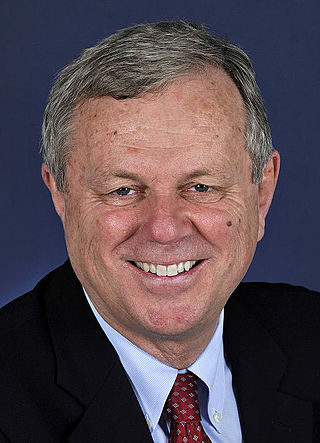
The 2010 South Australian state election elected members to the 52nd Parliament of South Australia on 20 March 2010. All seats in the House of Assembly or lower house, whose current members were elected at the 2006 election, and half the seats in the Legislative Council or upper house, last filled at the 2002 election, became vacant.
State elections were held in South Australia on 2 April 1910. All 42 seats in the South Australian House of Assembly were up for election. The incumbent Liberal and Democratic Union (LDU) government led by Premier of South Australia Archibald Peake was defeated by the United Labor Party (ULP) led by John Verran. Each of the 13 districts elected multiple members, with voters casting multiple votes. The Peake LDU minority government had replaced the Price ULP/LDU coalition government in June 1909. The 1910 election was the first to result in a South Australian majority government. This came two weeks after the election of a first majority in either house in the Parliament of Australia at the 1910 federal election, also for Labor. Though a South Australian majority was won, the ULP did not take office until after the new lower house first met.
State elections were held in South Australia on 5 April 1924. All 46 seats in the South Australian House of Assembly were up for election. The incumbent Liberal Federation government led by Premier of South Australia Henry Barwell was defeated by the opposition Australian Labor Party led by Leader of the Opposition John Gunn. Each district elected multiple members, with voters casting multiple votes.
State elections were held in South Australia on 26 March 1927. All 46 seats in the South Australian House of Assembly were up for election. The incumbent Australian Labor Party government led by Premier of South Australia Lionel Hill was defeated by the opposition Liberal Federation led by Leader of the Opposition Richard L. Butler, and the Country Party (SA) led by Archie Cameron. Each district elected multiple members, with voters casting multiple votes.
State elections were held in South Australia on 8 April 1933. All 46 seats in the South Australian House of Assembly were up for election. The incumbent Parliamentary Labor Party government led by Premier Robert Richards was defeated by the opposition Liberal and Country League led by Leader of the Opposition Richard L. Butler. Each district elected multiple members.
Thomas Butterfield was an Australian politician and minister in the South Australian Parliament.
The Protestant Independent Labour Party, alternatively spelt Protestant Independent Labor and sometimes known as the Protestant Labour Party, was a minor Australian political party that operated mainly in New South Wales, Queensland and South Australia in the 1920s and 1930s. It was formed by Walter Skelton in July 1923 as the Protestant Independent Labour Party. who had stood for the New South Wales Legislative Assembly district of Newcastle at the 1922 election, campaigning as a Protestant Independent Labour candidate, in which he was elected first of five members, receiving 25.19% of the vote. In 1925 he was re-elected to the Assembly under the Protestant Labour label, as the second of five members, receiving 17.70% of the vote. The party stood candidates in 12 of the 24 districts however Skelton was the only one elected, with the next highest candidate receiving 5.10% of the district vote.
The South Australian Labor Party, officially known as the Australian Labor Party (South Australian Branch) and commonly referred to simply as South Australian Labor, is the South Australian Branch of the Australian Labor Party, originally formed in 1891 as the United Labor Party of South Australia. It is one of two major parties in the bicameral Parliament of South Australia, the other being the Liberal Party of Australia (SA Division).
This is a list of House of Assembly results for the 1924 South Australian state election. Each district elected multiple members.
The 2022 South Australian state election was held on 19 March 2022 to elect members to the 55th Parliament of South Australia. All 47 seats in the House of Assembly, and half the seats in the Legislative Council were up for re-election.