South Australian state election, 5 April 1930 [1] Contents | ||||||
---|---|---|---|---|---|---|
Enrolled voters | 325,244 | |||||
Votes cast | 222,819 | Turnout | 71.36% | –6.07% | ||
Informal votes | 12,715 | Informal | 5.71% | |||
Summary of votes by party | ||||||
Party | Primary votes | % | Swing | Seats | Change | |
Labor | 102,194 | 48.64% | +0.65% | 30 | + 14 | |
Liberal Federation | 74,930 | 35.66% | –4.34% | 13 | – 10 | |
Country | 14,555 | 6.93% | +1.43% | 2 | – 3 | |
Single Tax League | 2,777 | 1.32% | +1.32% | 1 | + 1 | |
Communist | 696 | 0.33% | +0.33% | 0 | ± 0 | |
Independent | 14,952 | 7.11% | +0.57% | 0 | ± 0 | |
Total | 210,104 | 46 |
This is a list of House of Assembly results for the 1930 South Australian state election. Each district elected multiple members.
Party | Candidate | Votes | % | ±% | |
---|---|---|---|---|---|
Labor | Bill Denny (elected) | 5,761 | 81.7 | ||
Labor | Bert Edwards (elected) | 317 | 4.5 | ||
Labor | Herbert George (elected) | 241 | 3.4 | ||
Independent Labor | Alfred Wilson | 401 | 5.7 | ||
Communist | James Cullen | 336 | 4.8 | ||
Total formal votes | 7,056 | 92.2 | |||
Informal votes | 597 | 7.8 | |||
Turnout | 7,653 | 58.9 | |||
Party total votes | |||||
Labor | 6,319 | 89.6 | |||
Independent Labor | Alfred Wilson | 401 | 5.7 | ||
Communist | 336 | 4.8 |
Party | Candidate | Votes | % | ±% | |
---|---|---|---|---|---|
Liberal Federation | Malcolm McIntosh (elected) | 3,613 | 36.7 | ||
Liberal Federation | Frederick McMillan (elected) | 256 | 2.6 | ||
Labor | Henry Dalziel | 3,303 | 33.5 | ||
Labor | Richard McKenzie | 416 | 4.2 | ||
Country | Arthur Petch | 1,799 | 18.3 | ||
Country | Ernest Rowe | 461 | 4.7 | ||
Total formal votes | 9,848 | 94.1 | |||
Informal votes | 612 | 5.9 | |||
Turnout | 10,460 | 74.0 | |||
Party total votes | |||||
Liberal Federation | 3,869 | 39.3 | |||
Labor | 3,719 | 37.8 | |||
Country | 2,260 | 22.9 |
Party | Candidate | Votes | % | ±% | |
---|---|---|---|---|---|
Liberal Federation | Percy Heggaton (elected) | 3,209 | 42.3 | ||
Liberal Federation | Herbert Hudd (elected) | 946 | 12.5 | ||
Liberal Federation | George Laffer (elected) | 635 | 8.4 | ||
Country | Frederick Ayers | 1,936 | 25.5 | ||
Country | William Scarborough | 508 | 6.7 | ||
Country | Lindsay Yelland | 352 | 4.6 | ||
Total formal votes | 7,586 | 91.5 | |||
Informal votes | 706 | 8.5 | |||
Turnout | 8,292 | 61.4 | |||
Party total votes | |||||
Liberal Federation | 4,790 | 63.1 | |||
Country | 2,796 | 36.9 |
Party | Candidate | Votes | % | ±% | |
---|---|---|---|---|---|
Labor | George Cooke (elected) | 4,114 | 43.0 | ||
Labor | Thomas Edwards (elected) | 235 | 2.5 | ||
Labor | Leonard Hopkins (elected) | 116 | 1.2 | ||
Liberal Federation | Henry Crosby | 3,276 | 34.2 | ||
Liberal Federation | Herbert Lyons | 299 | 3.1 | ||
Independent | Herbert Basedow | 1,383 | 14.5 | ||
People | Richard Thompson | 80 | 0.8 | ||
People | Horace Barnes | 66 | 0.7 | ||
Total formal votes | 9,569 | 93.5 | |||
Informal votes | 666 | 6.5 | |||
Turnout | 10,235 | 78.5 | |||
Party total votes | |||||
Labor | 4,465 | 46.7 | |||
Liberal Federation | 3,575 | 37.4 | |||
Independent | Herbert Basedow | 1,383 | 14.5 | ||
People | 146 | 1.5 |
Party | Candidate | Votes | % | ±% | |
---|---|---|---|---|---|
Labor | Jack Critchley (elected) | 3,983 | 41.0 | ||
Labor | Sydney McHugh (elected) | 990 | 10.2 | ||
Labor | Even George (elected) | 144 | 1.5 | ||
Liberal Federation | George Jenkins | 3,604 | 37.1 | ||
Liberal Federation | Reginald Carter | 575 | 5.9 | ||
Liberal Federation | Philip McBride | 413 | 4.3 | ||
Total formal votes | 9,709 | 93.8 | |||
Informal votes | 636 | 6.2 | |||
Turnout | 10,345 | 78.3 | |||
Party total votes | |||||
Labor | 5,117 | 52.7 | |||
Liberal Federation | 4,592 | 47.3 |
Party | Candidate | Votes | % | ±% | |
---|---|---|---|---|---|
Labor | Beasley Kearney (elected) | 11,240 | 44.8 | ||
Labor | Frank Nieass (elected) | 864 | 3.5 | ||
Labor | Arthur McArthur (elected) | 460 | 1.8 | ||
Liberal Federation | Frederick Coneybeer | 10,426 | 41.6 | ||
Liberal Federation | Walter Hamilton | 1,538 | 6.1 | ||
Liberal Federation | Albert Sutton | 541 | 2.2 | ||
Total formal votes | 25,069 | 94.7 | |||
Informal votes | 1,389 | 5.3 | |||
Turnout | 26,458 | 69.9 | |||
Party total votes | |||||
Labor | 12,564 | 50.1 | |||
Liberal Federation | 12,505 | 49.9 |
Party | Candidate | Votes | % | ±% | |
---|---|---|---|---|---|
Single Tax League | Edward Craigie (elected) | 2,777 | 34.0 | ||
Liberal Federation | James Moseley (elected) | 1,927 | 23.6 | ||
Liberal Federation | Alfred Barns | 518 | 6.4 | ||
Labor | Myles Cronin | 1,014 | 12.4 | ||
Labor | David Whait | 340 | 4.2 | ||
Country | Edwin Barraud | 511 | 6.3 | ||
Country | Albert Wishart | 311 | 3.8 | ||
Independent Labor | John O'Connor | 763 | 9.4 | ||
Total formal votes | 8,161 | 95.6 | |||
Informal votes | 377 | 4.4 | |||
Turnout | 8,538 | 70.6 | |||
Party total votes | |||||
Single Tax League | 2,777 | 34.0 | |||
Liberal Federation | 2,445 | 30.0 | |||
Labor | 1,354 | 16.6 | |||
Country | 822 | 10.1 | |||
Independent Labor | John O'Connor | 763 | 9.4 |
Party | Candidate | Votes | % | ±% | |
---|---|---|---|---|---|
Liberal Federation | Hermann Homburg | 2,436 | 26.8 | ||
Liberal Federation | Ernest Hannaford | 1,061 | 11.7 | ||
Liberal Federation | George Morphett | 1,027 | 11.3 | ||
Labor | Clement Collins (elected) | 3,622 | 29.8 | ||
Labor | Frank Staniford (elected) | 613 | 6.7 | ||
Labor | Robert Hunter (elected) | 81 | 0.9 | ||
Independent | Raphael Cilento | 264 | 2.9 | ||
Total formal votes | 9,104 | 91.4 | |||
Informal votes | 857 | 8.6 | |||
Turnout | 9,961 | 75.3 | |||
Party total votes | |||||
Liberal Federation | 4,524 | 49.7 | |||
Labor | 4,316 | 47.4 | |||
Independent | Raphael Cilento | 264 | 2.9 |
Party | Candidate | Votes | % | ±% | |
---|---|---|---|---|---|
Labor | Thomas Butterfield (elected) | unopposed | |||
Labor | William Harvey (elected) | unopposed |
Party | Candidate | Votes | % | ±% | |
---|---|---|---|---|---|
Labor | Frederick Birrell (elected) | 6,953 | 45.9 | ||
Labor | Walter Warne (elected) | 977 | 6.5 | ||
Liberal Federation | Shirley Jeffries | 5,955 | 39.3 | ||
Liberal Federation | Victor Newland | 1,265 | 8.4 | ||
Total formal votes | 15,150 | 97.0 | |||
Informal votes | 465 | 3.0 | |||
Turnout | 15,615 | 72.4 | |||
Party total votes | |||||
Labor | 7,930 | 52.4 | |||
Liberal Federation | 7,220 | 47.6 |
Party | Candidate | Votes | % | ±% | |
---|---|---|---|---|---|
Labor | John Jonas (elected) | 13,460 | 68.5 | ||
Labor | Albert Thompson (elected) | 2,073 | 10.5 | ||
Independent Labor | Harold Butler | 3,544 | 18.0 | ||
Independent Labor | Joshua Pedlar | 588 | 3.0 | ||
Total formal votes | 19,665 | 95.0 | |||
Informal votes | 1,024 | 5.0 | |||
Turnout | 20,689 | 70.8 | |||
Party total votes | |||||
Labor | 15,533 | 79.0 | |||
Independent Labor | 4,132 | 21.0 |
Party | Candidate | Votes | % | ±% | |
---|---|---|---|---|---|
Labor | Lionel Hill (elected) | unopposed | |||
Labor | John Fitzgerald (elected) | unopposed |
Party | Candidate | Votes | % | ±% | |
---|---|---|---|---|---|
Liberal Federation | John Lyons (elected) | 2,802 | 43.1 | ||
Liberal Federation | Robert Nicholls (elected) | 914 | 14.1 | ||
Country | Oliver Badman | 2,512 | 38.6 | ||
Country | Henry Sargent | 273 | 4.2 | ||
Total formal votes | 6,501 | 94.9 | |||
Informal votes | 346 | 5.1 | |||
Turnout | 6,847 | 73.7 | |||
Party total votes | |||||
Liberal Federation | 3,716 | 57.2 | |||
Country | 2,785 | 42.8 |
Party | Candidate | Votes | % | ±% | |
---|---|---|---|---|---|
Labor | Bob Dale (elected) | 16,116 | 47.1 | ||
Labor | Thomas Grealy | 1,218 | 3.6 | ||
Labor | Edgar Dawes (elected) | 511 | 1.5 | ||
Liberal Federation | Ernest Anthoney (elected) | 13,034 | 38.1 | ||
Liberal Federation | Herbert Richards | 1,413 | 4.1 | ||
Liberal Federation | Edward Vardon | 646 | 1.9 | ||
Women's Non-Party | Leonora Polkinghorne | 1,255 | 3.7 | ||
Total formal votes | 34,193 | 93.4 | |||
Informal votes | 2,423 | 6.6 | |||
Turnout | 36,616 | 69.5 | |||
Party total votes | |||||
Labor | 17,845 | 52.2 | |||
Liberal Federation | 15,093 | 44.1 | |||
Women's Non-Party | Leonora Polkinghorne | 1,255 | 3.7 |
Party | Candidate | Votes | % | ±% | |
---|---|---|---|---|---|
Liberal Federation | Peter Reidy (elected) | 4,217 | 41.2 | ||
Liberal Federation | Vernon Petherick | 1,066 | 10.4 | ||
Labor | Eric Shepherd (elected) | 4,614 | 45.1 | ||
Labor | Francis Young | 329 | 3.2 | ||
Total formal votes | 10,226 | 94.3 | |||
Informal votes | 612 | 5.7 | |||
Turnout | 10,838 | 94.5 | |||
Party total votes | |||||
Liberal Federation | 5,283 | 51.7 | |||
Labor | 4,913 | 48.3 |
Party | Candidate | Votes | % | ±% | |
---|---|---|---|---|---|
Labor | John Pedler (elected) | 2,263 | 50.1 | ||
Labor | Robert Richards (elected) | 423 | 9.4 | ||
Independent | Frank Filmer | 1,039 | 23.0 | ||
Independent | Richard Kitto | 551 | 12.2 | ||
Independent | William Price | 238 | 5.3 | ||
Total formal votes | 4,514 | 96.1 | |||
Informal votes | 183 | 3.9 | |||
Turnout | 4,697 | 83.7 | |||
Party total votes | |||||
Labor | 2,686 | 59.5 | |||
Independent | Frank Filmer | 1,039 | 23.0 | ||
Independent | Richard Kitto | 551 | 12.2 | ||
Independent | William Price | 238 | 5.3 |
Party | Candidate | Votes | % | ±% | |
---|---|---|---|---|---|
Labor | Alfred Blackwell (elected) | 14,311 | 69.7 | ||
Labor | John McInnes (elected) | 1,092 | 5.3 | ||
Independent Labor | Clive Caldicott | 3,638 | 17.7 | ||
Independent Labor | Louis Crosby | 1,142 | 5.6 | ||
Communist | Thomas McGillick | 360 | 1.8 | ||
Total formal votes | 20,543 | 94.8 | |||
Informal votes | 1,131 | 5.2 | |||
Turnout | 21,674 | 65.3 | |||
Party total votes | |||||
Labor | 15,403 | 75.0 | |||
Independent Labor | 4,780 | 23.3 | |||
Communist | 360 | 1.8 |
Party | Candidate | Votes | % | ±% | |
---|---|---|---|---|---|
Country | Archie Cameron (elected) | 3,970 | 48.8 | ||
Country | Brian Richardson | 106 | 1.3 | ||
Country | Samuel Dennison (elected) | 95 | 1.2 | ||
Liberal Federation | Richard Butler (elected) | 3,714 | 45.6 | ||
Liberal Federation | Friedrich Heinrich | 143 | 1.8 | ||
Liberal Federation | William Marshman | 114 | 1.4 | ||
Total formal votes | 8,142 | 95.0 | |||
Informal votes | 429 | 5.0 | |||
Turnout | 8,571 | 81.2 | |||
Party total votes | |||||
Country | 4,171 | 51.2 | |||
Liberal Federation | 3,971 | 48.8 |
Party | Candidate | Votes | % | ±% | |
---|---|---|---|---|---|
Liberal Federation | Edward Giles (elected) | 1,987 | 39.2 | ||
Liberal Federation | Baden Pattinson (elected) | 1,360 | 26.8 | ||
Country | Joseph Honner | 1,509 | 29.8 | ||
Country | Stepney Pontifex | 212 | 4.2 | ||
Total formal votes | 5,068 | 95.1 | |||
Informal votes | 262 | 4.9 | |||
Turnout | 5,330 | 73.5 | |||
Party total votes | |||||
Liberal Federation | 3,347 | 66.0 | |||
Country | 1,721 | 34.0 |
The Legislative Council, or upper house, is one of the two chambers of the Parliament of South Australia. Its central purpose is to act as a house of review for legislation passed through the lower house, the House of Assembly. It sits in Parliament House in the state capital, Adelaide.
The House of Assembly, or lower house; Is one of the two chambers of the Parliament of South Australia. The other is the Legislative Council. It sits in Parliament House in the state capital, Adelaide.
The Parliament of South Australia is the bicameral legislature of the Australian state of South Australia. It consists of the 47-seat House of Assembly and the 22-seat Legislative Council. General elections are held every 4 years, with all of the lower house and half of the upper house filled at each election. It follows a Westminster system of parliamentary government with the executive branch required to both sit in parliament and hold the confidence of the House of Assembly. The parliament is based at Parliament House on North Terrace in the state capital of Adelaide.
Maylands is a Legislative Assembly electorate in the state of Western Australia. Maylands is named for the inner northeastern Perth suburb of Maylands, which falls within its borders.
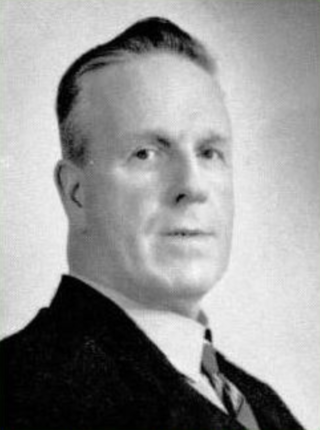
William Henry Carpenter was an Australian politician. He held seats in three parliaments: the South Australian Legislative Assembly, the Australian House of Representatives and the Western Australian Legislative Assembly.
The Liberal Federation was a South Australian political party from 16 October 1923 to 1932. It came into existence as a merger between the rival Liberal Union and National Party, to oppose Labor.
The lower houses of the parliaments of the states and territories of Australia are divided into electoral districts. Most electoral districts send a single member to a state or territory's parliament using the preferential method of voting. The area of a state electoral district is dependent upon the Electoral Acts in the various states and vary in area between them. At present, there are 409 state electoral districts in Australia.
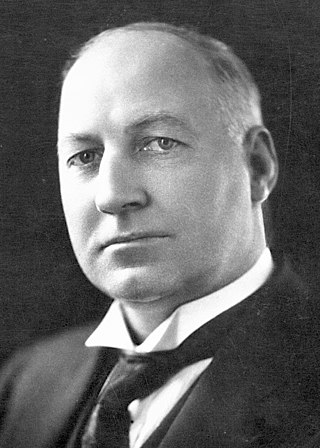
Albert Victor Thompson was a member of the Australian House of Representatives and the South Australian House of Assembly.
This is a list of members of the Western Australian Legislative Assembly between the 1930 election and the 1933 election, together known as the 14th Parliament. It took place under radically altered boundaries as enacted within the Redistribution of Seats Act 1929, whose effect had been exaggerated by the lack of a redistribution for the previous 18 years. The gold mining areas, populous at the time of the 1911 redistribution, had been reduced to pocket boroughs by the decline in gold mining as an economic activity in the State; meanwhile, the agricultural and metropolitan areas had grown substantially. Ironically, the changes were enacted by a Labor government even though most of the safe seats being abolished were Labor seats—and for the fourth time in a row, the government enacting the redistribution lost the subsequent election.
State elections were held in South Australia on 26 March 1927. All 46 seats in the South Australian House of Assembly were up for election. The incumbent Australian Labor Party government led by Premier of South Australia Lionel Hill was defeated by the opposition Liberal Federation led by Leader of the Opposition Richard L. Butler, and the Country Party (SA) led by Archie Cameron. Each district elected multiple members, with voters casting multiple votes.
State elections were held in South Australia on 5 April 1930. All 46 seats in the South Australian House of Assembly were up for election. The incumbent Liberal Federation government led by Premier of South Australia Richard L. Butler was defeated by the opposition Australian Labor Party led by Leader of the Opposition Lionel Hill.
State elections were held in South Australia on 29 April 1944. All 39 seats in the South Australian House of Assembly were up for election. The incumbent Liberal and Country League government led by Premier of South Australia Thomas Playford IV defeated the opposition Australian Labor Party led by Leader of the Opposition Robert Richards.
Members of the New South Wales Legislative Assembly who served in the 29th parliament held their seats from 1930 to 1932. They were elected at the 1930 state election, and at by-elections. The Nationalist Party was replaced by the United Australia Party in 1931. The Speaker was Frank Burke.
Members of the New South Wales Legislative Assembly who served in the 28th parliament of New South Wales held their seats from 1927 to 1930. They were elected at the 1927 state election, and at by-elections. The Speaker was Sir Daniel Levy.
The Protestant Independent Labour Party, alternatively spelt Protestant Independent Labor and sometimes known as the Protestant Labour Party, was a minor Australian political party that operated mainly in New South Wales, Queensland and South Australia in the 1920s and 1930s. It was formed by Walter Skelton in July 1923 as the Protestant Independent Labour Party. who had stood for the New South Wales Legislative Assembly district of Newcastle at the 1922 election, campaigning as a Protestant Independent Labour candidate, in which he was elected first of five members, receiving 25.19% of the vote. In 1925 he was re-elected to the Assembly under the Protestant Labour label, as the second of five members, receiving 17.70% of the vote. The party stood candidates in 12 of the 24 districts however Skelton was the only one elected, with the next highest candidate receiving 5.10% of the district vote.
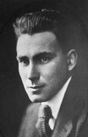
Edgar Rowland Dawes was an Australian politician. He was a Labor Party member of the South Australian House of Assembly from 1930 until 1933, representing the electorate of Sturt. He was the leader of the official Labor Party in South Australia in the aftermath of the 1931 Labor split from May 1932 until his defeat at the 1933 state election.
This is a list of members of the South Australian House of Assembly from 1927 to 1930, as elected at the 1927 state election:
The Parliamentary Labor Party was a political party active in South Australia from August 1931 until June 1934.
The Country Party was a political party in South Australia in the first part of the 20th century. It was formed out of the Farmers and Settlers Association in September 1917 to represent the association's interests in parliament. The party endorsed seven candidates in the 1918 election, with two elected. In the early years, their representatives were usually identified as Farmers and Settlers' Association representatives or as the parliamentary wing of the Farmers and Settlers' Association, but referred to in some sources as Country Party, Independent Country Party or independent members. The Country Party name was formally adopted after the 1921 election.
The South Australian Labor Party, officially known as the Australian Labor Party (South Australian Branch) and commonly referred to simply as South Australian Labor, is the South Australian Branch of the Australian Labor Party, originally formed in 1891 as the United Labor Party of South Australia. It is one of two major parties in the bicameral Parliament of South Australia, the other being the Liberal Party of Australia (SA Division).