South Australian state election, 4 March 1950 [1] Contents
| ||||||
---|---|---|---|---|---|---|
Enrolled voters | 311,658 | |||||
Votes cast | 290,306 | Turnout | 93.15% | –0.22% | ||
Informal votes | 9,667 | Informal | 3.33% | –0.30% | ||
Summary of votes by party | ||||||
Party | Primary votes | % | Swing | Seats | Change | |
Labor | 134,952 | 48.09% | –0.55% | 12 | – 1 | |
Liberal and Country | 113,673 | 40.51% | +0.12% | 23 | ± 0 | |
Communist | 3,749 | 1.34% | –1.63% | 0 | ± 0 | |
Independent | 28,265 | 10.07% | +3.87% | 4 | + 1 | |
Total | 280,639 | 39 | ||||
Two-party-preferred | ||||||
Liberal and Country | 51.30% | –0.70% | ||||
Labor | 48.70% | +0.70% |
This is a list of House of Assembly results for the 1950 South Australian state election.
Party | Candidate | Votes | % | ±% | |
---|---|---|---|---|---|
Labor | Sam Lawn | 4,857 | 38.3 | -12.4 | |
Independent | Bert Edwards | 4,177 | 33.0 | +33.0 | |
Independent | Doug Bardolph | 1,940 | 15.3 | -23.0 | |
Independent | W J Welsh | 1,695 | 13.4 | +13.4 | |
Total formal votes | 12,669 | 92.3 | +2.6 | ||
Informal votes | 1,059 | 7.7 | −2.6 | ||
Turnout | 13,728 | 90.7 | +1.2 | ||
Two-candidate-preferred result | |||||
Labor | Sam Lawn | 7,161 | 56.5 | ||
Independent | Bert Edwards | 5,508 | 43.5 | ||
Labor hold | Swing | N/A |
Party | Candidate | Votes | % | ±% | |
---|---|---|---|---|---|
Liberal and Country | Malcolm McIntosh | unopposed | |||
Liberal and Country hold | Swing |
Party | Candidate | Votes | % | ±% | |
---|---|---|---|---|---|
Liberal and Country | David Brookman | unopposed | |||
Liberal and Country hold | Swing |
Party | Candidate | Votes | % | ±% | |
---|---|---|---|---|---|
Liberal and Country | Berthold Teusner | 4,418 | 75.9 | +5.6 | |
Independent | Henry Schneider | 1,403 | 24.1 | +24.1 | |
Total formal votes | 5,821 | 97.0 | −0.4 | ||
Informal votes | 179 | 3.0 | +0.4 | ||
Turnout | 6,000 | 96.3 | +0.3 | ||
Liberal and Country hold | Swing | N/A |
Party | Candidate | Votes | % | ±% | |
---|---|---|---|---|---|
Liberal and Country | Geoffrey Clarke | unopposed | |||
Liberal and Country hold | Swing |
Party | Candidate | Votes | % | ±% | |
---|---|---|---|---|---|
Liberal and Country | George Hawker | 2,633 | 61.3 | +2.8 | |
Labor | Even George | 1,661 | 38.7 | -2.8 | |
Total formal votes | 4,294 | 99.0 | +0.2 | ||
Informal votes | 44 | 1.0 | −0.2 | ||
Turnout | 4,338 | 94.7 | −0.6 | ||
Liberal and Country hold | Swing | +2.8 |
Party | Candidate | Votes | % | ±% | |
---|---|---|---|---|---|
Independent | William MacGillivray | 2,711 | 40.3 | -19.0 | |
Liberal and Country | Ross Story | 2,363 | 35.1 | +35.1 | |
Labor | Robert Lambert | 1,653 | 24.6 | -16.1 | |
Total formal votes | 6,727 | 97.3 | −0.2 | ||
Informal votes | 186 | 2.7 | +0.2 | ||
Turnout | 6,913 | 95.4 | +1.3 | ||
Two-candidate-preferred result | |||||
Independent | William MacGillivray | 4,084 | 60.7 | +1.4 | |
Liberal and Country | Ross Story | 2,643 | 39.3 | +39.3 | |
Independent hold | Swing | N/A |
Party | Candidate | Votes | % | ±% | |
---|---|---|---|---|---|
Liberal and Country | Arthur Christian | unopposed | |||
Liberal and Country hold | Swing |
Party | Candidate | Votes | % | ±% | |
---|---|---|---|---|---|
Liberal and Country | Rex Pearson | unopposed | |||
Liberal and Country hold | Swing |
Party | Candidate | Votes | % | ±% | |
---|---|---|---|---|---|
Labor | Mick O'Halloran | unopposed | |||
Labor hold | Swing |
Party | Candidate | Votes | % | ±% | |
---|---|---|---|---|---|
Labor | Leslie Duncan | 3,179 | 54.2 | +0.5 | |
Liberal and Country | Eldred Riggs | 2,686 | 45.8 | -0.5 | |
Total formal votes | 5,865 | 98.9 | +0.5 | ||
Informal votes | 64 | 1.1 | −0.5 | ||
Turnout | 5,929 | 95.4 | +0.3 | ||
Labor hold | Swing | +0.5 |
Party | Candidate | Votes | % | ±% | |
---|---|---|---|---|---|
Liberal and Country | Baden Pattinson | 13,673 | 62.3 | +1.7 | |
Labor | John Sexton | 8,272 | 37.7 | +2.3 | |
Total formal votes | 21,945 | 97.3 | +0.2 | ||
Informal votes | 617 | 2.7 | −0.2 | ||
Turnout | 22,562 | 93.9 | 0.0 | ||
Liberal and Country hold | Swing | N/A |
Party | Candidate | Votes | % | ±% | |
---|---|---|---|---|---|
Labor | Frank Walsh | 11,131 | 54.5 | +3.5 | |
Liberal and Country | Herbert Kemp | 9,288 | 45.5 | -3.5 | |
Total formal votes | 20,419 | 98.4 | +1.2 | ||
Informal votes | 341 | 1.6 | −1.2 | ||
Turnout | 20,760 | 92.9 | −0.4 | ||
Labor hold | Swing | +3.5 |
Party | Candidate | Votes | % | ±% | |
---|---|---|---|---|---|
Liberal and Country | Rufus Goldney | 4,036 | 70.5 | +6.5 | |
Labor | Archibald Riddoch | 1,685 | 29.5 | -6.5 | |
Total formal votes | 5,721 | 97.8 | −0.2 | ||
Informal votes | 127 | 2.2 | +0.2 | ||
Turnout | 5,848 | 95.6 | +0.6 | ||
Liberal and Country hold | Swing | +6.5 |
Party | Candidate | Votes | % | ±% | |
---|---|---|---|---|---|
Liberal and Country | Thomas Playford | unopposed | |||
Liberal and Country hold | Swing |
Party | Candidate | Votes | % | ±% | |
---|---|---|---|---|---|
Labor | Cyril Hutchens | unopposed | |||
Labor hold | Swing |
Party | Candidate | Votes | % | ±% | |
---|---|---|---|---|---|
Liberal and Country | Herbert Michael | unopposed | |||
Liberal and Country hold | Swing |
Party | Candidate | Votes | % | ±% | |
---|---|---|---|---|---|
Liberal and Country | Henry Dunks | 12,384 | 68.5 | +1.4 | |
Labor | Charles Smith | 5,684 | 31.5 | -1.4 | |
Total formal votes | 18,068 | 98.4 | +0.4 | ||
Informal votes | 291 | 1.6 | −0.4 | ||
Turnout | 18,359 | 92.5 | −0.4 | ||
Liberal and Country hold | Swing | +1.4 |
Party | Candidate | Votes | % | ±% | |
---|---|---|---|---|---|
Independent | John Fletcher | 4,905 | 64.4 | -2.0 | |
Labor | John Shepherdson | 2,717 | 35.6 | +2.0 | |
Total formal votes | 7,622 | 98.4 | +0.2 | ||
Informal votes | 125 | 1.6 | −0.2 | ||
Turnout | 7,747 | 93.7 | −0.7 | ||
Independent hold | Swing | -2.0 |
Party | Candidate | Votes | % | ±% | |
---|---|---|---|---|---|
Labor | Richard McKenzie | 3,247 | 50.8 | -4.6 | |
Liberal and Country | Hector White | 3,143 | 49.2 | +4.6 | |
Total formal votes | 6,390 | 98.3 | −0.2 | ||
Informal votes | 108 | 1.7 | +0.2 | ||
Turnout | 6,498 | 95.4 | −0.5 | ||
Labor hold | Swing | -4.6 |
Party | Candidate | Votes | % | ±% | |
---|---|---|---|---|---|
Liberal and Country | George Jenkins | 2,601 | 71.3 | -28.7 | |
Labor | Leonard Pilton | 1,048 | 28.7 | +28.7 | |
Total formal votes | 3,649 | 98.9 | |||
Informal votes | 40 | 1.1 | |||
Turnout | 3,689 | 86.1 | |||
Liberal and Country hold | Swing | N/A |
Party | Candidate | Votes | % | ±% | |
---|---|---|---|---|---|
Liberal and Country | Roy Moir | 9,081 | 54.3 | +2.9 | |
Labor | Edward Souter | 7,336 | 43.9 | -4.7 | |
Communist | Alfred Watt | 305 | 1.8 | +1.8 | |
Total formal votes | 16,722 | 94.9 | −2.4 | ||
Informal votes | 894 | 5.1 | +2.4 | ||
Turnout | 17,616 | 93.7 | +0.5 | ||
Two-party-preferred result | |||||
Liberal and Country | Roy Moir | 54.5 | +3.1 | ||
Labor | Edward Souter | 45.5 | -3.1 | ||
Liberal and Country hold | Swing | +3.1 |
Party | Candidate | Votes | % | ±% | |
---|---|---|---|---|---|
Liberal and Country | Howard Shannon | 4,530 | 61.1 | +10.7 | |
Labor | Frank Staniford | 2,887 | 38.9 | +5.1 | |
Total formal votes | 7,417 | 98.6 | +0.7 | ||
Informal votes | 107 | 1.4 | −0.7 | ||
Turnout | 7,524 | 94.9 | −0.2 | ||
Liberal and Country hold | Swing | N/A |
Party | Candidate | Votes | % | ±% | |
---|---|---|---|---|---|
Labor | James Stephens | 20,091 | 90.2 | +7.6 | |
Communist | Peter Symon | 2,185 | 9.8 | -7.6 | |
Total formal votes | 22,276 | 94.6 | +2.2 | ||
Informal votes | 1,277 | 5.4 | −2.2 | ||
Turnout | 23,553 | 92.8 | −0.9 | ||
Labor hold | Swing | +7.6 |
Party | Candidate | Votes | % | ±% | |
---|---|---|---|---|---|
Labor | Charles Davis | 4,965 | 69.5 | -30.5 | |
Independent | Charles Emery | 1,155 | 16.2 | +16.2 | |
Independent | Leslie Kyte | 1,027 | 14.4 | +14.4 | |
Total formal votes | 7,147 | 90.9 | |||
Informal votes | 714 | 9.1 | |||
Turnout | 7,861 | 95.0 | |||
Labor hold | Swing | N/A |
Party | Candidate | Votes | % | ±% | |
---|---|---|---|---|---|
Liberal and Country | Elder Whittle | 10,603 | 55.5 | +1.2 | |
Labor | James Marner | 7,883 | 41.2 | -4.5 | |
Communist | Alan Finger | 626 | 3.3 | +3.3 | |
Total formal votes | 19,112 | 95.5 | −2.3 | ||
Informal votes | 892 | 4.5 | +2.3 | ||
Turnout | 20,004 | 94.5 | +0.7 | ||
Two-party-preferred result | |||||
Liberal and Country | Elder Whittle | 55.8 | +1.5 | ||
Labor | James Marner | 44.2 | -1.5 | ||
Liberal and Country hold | Swing | +1.5 |
Party | Candidate | Votes | % | ±% | |
---|---|---|---|---|---|
Independent | Tom Stott | unopposed | |||
Independent hold | Swing |
Party | Candidate | Votes | % | ±% | |
---|---|---|---|---|---|
Liberal and Country | James Heaslip | unopposed | |||
Liberal and Country hold | Swing |
Party | Candidate | Votes | % | ±% | |
---|---|---|---|---|---|
Labor | Harold Tapping | 15,173 | 80.5 | -19.5 | |
Independent | Joseph Talbot | 3,681 | 19.5 | +19.5 | |
Total formal votes | 18,854 | 94.2 | |||
Informal votes | 1,155 | 5.8 | |||
Turnout | 20,009 | 92.1 | |||
Labor hold | Swing | N/A |
Party | Candidate | Votes | % | ±% | |
---|---|---|---|---|---|
Independent | Percy Quirke | 2,335 | 47.2 | +47.2 | |
Liberal and Country | Alexander Knappstein | 1,755 | 35.5 | -14.4 | |
Labor | Cyril Hasse | 856 | 17.3 | -32.8 | |
Total formal votes | 4,946 | 98.8 | −0.1 | ||
Informal votes | 60 | 1.2 | +0.1 | ||
Turnout | 5,006 | 96.9 | +1.4 | ||
Two-candidate-preferred result | |||||
Independent | Percy Quirke | 2,970 | 60.0 | ||
Liberal and Country | Alexander Knappstein | 1,976 | 40.0 | ||
Independent gain from Labor | Swing | N/A |
Party | Candidate | Votes | % | ±% | |
---|---|---|---|---|---|
Liberal and Country | Herbert Dunn | 3,711 | 56.6 | -43.4 | |
Independent | William Jenkins | 2,844 | 43.4 | +43.4 | |
Total formal votes | 6,555 | 98.3 | |||
Informal votes | 115 | 1.7 | |||
Turnout | 6,670 | 95.2 | |||
Liberal and Country hold | Swing | N/A |
Party | Candidate | Votes | % | ±% | |
---|---|---|---|---|---|
Labor | Lindsay Riches | 8,219 | 92.8 | +5.3 | |
Communist | John Sendy | 633 | 7.2 | -5.3 | |
Total formal votes | 8,852 | 96.2 | 0.0 | ||
Informal votes | 352 | 3.8 | 0.0 | ||
Turnout | 9,204 | 85.5 | −0.3 | ||
Labor hold | Swing | +5.3 |
Party | Candidate | Votes | % | ±% | |
---|---|---|---|---|---|
Labor | Fred Walsh | unopposed | |||
Labor hold | Swing |
Party | Candidate | Votes | % | ±% | |
---|---|---|---|---|---|
Liberal and Country | Shirley Jeffries | 9,954 | 54.5 | -0.5 | |
Labor | Herbert Baldock | 8,299 | 45.5 | +0.5 | |
Total formal votes | 18,253 | 98.2 | +0.9 | ||
Informal votes | 339 | 1.8 | −0.9 | ||
Turnout | 18,592 | 92.2 | −0.4 | ||
Liberal and Country hold | Swing | -0.5 |
Party | Candidate | Votes | % | ±% | |
---|---|---|---|---|---|
Liberal and Country | Colin Dunnage | 10,048 | 57.8 | -1.3 | |
Labor | Leslie McLean Wright | 7,335 | 42.2 | +1.3 | |
Total formal votes | 17,383 | 98.0 | +0.5 | ||
Informal votes | 360 | 2.0 | −0.5 | ||
Turnout | 17,743 | 92.3 | −0.8 | ||
Liberal and Country hold | Swing | -1.3 |
Party | Candidate | Votes | % | ±% | |
---|---|---|---|---|---|
Liberal and Country | Roy McLachlan | 4,716 | 52.7 | +2.5 | |
Labor | Jim Corcoran | 4,235 | 47.3 | -2.5 | |
Total formal votes | 8,951 | 99.0 | +2.2 | ||
Informal votes | 90 | 1.0 | −2.2 | ||
Turnout | 9,041 | 94.4 | −2.4 | ||
Liberal and Country hold | Swing | +2.5 |
Party | Candidate | Votes | % | ±% | |
---|---|---|---|---|---|
Labor | Hughie McAlees | 2,539 | 51.0 | -10.1 | |
Liberal and Country | Leslie Heath | 2,050 | 41.2 | +2.3 | |
Independent | Spence Crosby | 392 | 7.9 | +7.9 | |
Total formal votes | 4,981 | 97.4 | −0.9 | ||
Informal votes | 131 | 2.6 | +0.9 | ||
Turnout | 5,112 | 95.2 | +0.1 | ||
Two-party-preferred result | |||||
Labor | Hughie McAlees | 58.1 | -3.0 | ||
Liberal and Country | Leslie Heath | 41.9 | +3.0 | ||
Labor hold | Swing | -3.0 |
Party | Candidate | Votes | % | ±% | |
---|---|---|---|---|---|
Liberal and Country | Cecil Hincks | unopposed | |||
Liberal and Country hold | Swing |
Party | Candidate | Votes | % | ±% | |
---|---|---|---|---|---|
Liberal and Country | Robert Nicholls | unopposed | |||
Liberal and Country hold | Swing |
The state election for the 51st Parliament of South Australia was held in the Australian state of South Australia on 18 March 2006 to elect all members of the South Australian House of Assembly and 11 members of the South Australian Legislative Council. The election was conducted by the independent State Electoral Office.
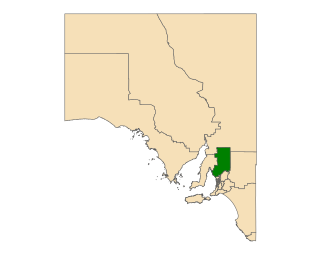
Frome is a single-member electoral district for the South Australian House of Assembly. It is named after Edward Charles Frome, the third surveyor-general of South Australia. The electorate stretches north-eastwards from the Gawler River and Gulf St Vincent in the south, and includes many of the agricultural areas of the Clare and Gilbert Valleys. It covers a total of 12,921 km2 (4,989 sq mi) and takes in the towns of Auburn, Clare, Mintaro, Port Broughton, Saddleworth, Snowtown and Riverton. Prior to the 2020 redistribution, its main population centre was Port Pirie, since transferred to Stuart.
The 1968South AustralianState election was held in South Australia on 2 March 1968. All 39 seats in the South Australian House of Assembly were up for election; 38 of the 39 contests were won by candidates from Australia's two major political parties. The incumbent Labor Party South Australia led by Premier of South Australia Don Dunstan and the Liberal and Country League led by Leader of the Opposition Steele Hall) both won 19 seats. The sole independent candidate to win a race, Tom Stott of the Ridley electorate, joined with the LCL's 19 seats to form a coalition government that held a 20 to 19 majority, thus defeating the Dunstan Labor government.
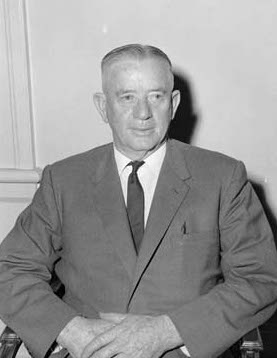
State elections were held in South Australia on 6 March 1965. All 39 seats in the South Australian House of Assembly were up for election. The incumbent Liberal and Country League led by Premier of South Australia Thomas Playford IV, in power since 1938, was defeated by the Australian Labor Party led by Leader of the Opposition Frank Walsh.
State elections were held in South Australia on 3 March 1962. All 39 seats in the South Australian House of Assembly were up for election. The incumbent Liberal and Country League led by Premier of South Australia Thomas Playford IV defeated the Australian Labor Party led by Leader of the Opposition Frank Walsh.
State elections were held in South Australia on 7 March 1959. All 39 seats in the South Australian House of Assembly were up for election. The incumbent Liberal and Country League led by Premier of South Australia Thomas Playford IV defeated the Australian Labor Party led by Leader of the Opposition Mick O'Halloran.
State elections were held in South Australia on 3 March 1956. All 39 seats in the South Australian House of Assembly were up for election. The incumbent Liberal and Country League led by Premier of South Australia Thomas Playford IV defeated the Australian Labor Party led by Leader of the Opposition Mick O'Halloran.
State elections were held in South Australia on 7 March 1953. All 39 seats in the South Australian House of Assembly were up for election. The incumbent Liberal and Country League led by Premier of South Australia Thomas Playford IV defeated the Australian Labor Party led by Leader of the Opposition Mick O'Halloran.
State elections were held in South Australia on 4 March 1950. All 39 seats in the South Australian House of Assembly were up for election. The incumbent Liberal and Country League led by Premier of South Australia Thomas Playford IV defeated the Australian Labor Party led by Leader of the Opposition Mick O'Halloran.
State elections were held in South Australia on 29 April 1944. All 39 seats in the South Australian House of Assembly were up for election. The incumbent Liberal and Country League government led by Premier of South Australia Thomas Playford IV defeated the opposition Australian Labor Party led by Leader of the Opposition Robert Richards.
State elections were held in South Australia on 8 March 1947. All 39 seats in the South Australian House of Assembly were up for election. The incumbent Liberal and Country League government led by Premier of South Australia Thomas Playford IV defeated the opposition Australian Labor Party led by Leader of the Opposition Robert Richards.
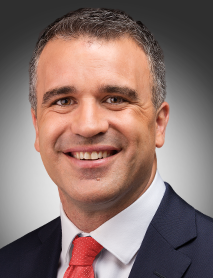
The 2018 South Australian state election to elect members to the 54th Parliament of South Australia was held on 17 March 2018. All 47 seats in the House of Assembly or lower house, whose members were elected at the 2014 election, and 11 of 22 seats in the Legislative Council or upper house, last filled at the 2010 election, were contested. The record-16-year-incumbent Australian Labor Party (SA) government led by Premier Jay Weatherill was seeking a fifth four-year term, but was defeated by the opposition Liberal Party of Australia (SA), led by Opposition Leader Steven Marshall. Nick Xenophon's new SA Best party unsuccessfully sought to obtain the balance of power.
A by-election was held for the New South Wales Legislative Assembly seat of Rockdale on 2 August 1986. It was triggered by the resignation of sitting Labor MP Brian Bannon. The by-election was won by Labor candidate and Premier Barrie Unsworth.
This is a list of House of Assembly results for the 1959 South Australian state election.
This is a list of House of Assembly results for the 1956 South Australian state election.
Elections were held in the Australian state of Victoria on Saturday 21 June 1958 to elect 17 of the 34 members of the state's Legislative Council for six year terms. MLCs were elected in single-member provinces using preferential voting. This was the last time Legislative Council elections were held separately to those of the Legislative Assembly.
This is a list of electoral district results of the 1950 Western Australian election.
The 2021 Western Australian state election was held on Saturday, March 13, to elect members to the Parliament of Western Australia, where all 59 seats in the Legislative Assembly and all 36 seats in the Legislative Council were up for election.
This is a list of electoral district results for the Victorian 1958 election.
The 2022 South Australian state election was held on 19 March 2022 to elect members to the 55th Parliament of South Australia. All 47 seats in the House of Assembly, and half the seats in the Legislative Council were up for re-election.