South Australian state election, 2 March 1968 [1] Contents
| ||||||
---|---|---|---|---|---|---|
Enrolled voters | 609,627 | |||||
Votes cast | 575,949 | Turnout | 94.48% | –0.11% | ||
Informal votes | 13,291 | Informal | 2.31% | –0.50% | ||
Summary of votes by party | ||||||
Party | Primary votes | % | Swing | Seats | Change | |
Labor | 292,445 | 51.98% | –3.06% | 19 | - 2 | |
Liberal and Country | 246,560 | 43.82% | +7.89% | 19 | + 2 | |
Democratic Labor | 9,223 | 1.64% | –2.71% | 0 | ± 0 | |
Social Credit | 4,792 | 0.85% | –1.07% | 0 | ± 0 | |
National | 2,251 | 0.40% | –0.05% | 0 | ± 0 | |
Communist | 1,606 | 0.29% | –0.15% | 0 | ± 0 | |
Independent | 5,781 | 1.03% | –0.85% | 1 | ± 0 | |
Total | 562,658 | 39 | ||||
Two-party-preferred | ||||||
Liberal and Country | 46.80% | +1.10% | ||||
Labor | 53.20% | –1.10% |
This is a list of House of Assembly results for the 1968 South Australian state election.
Party | Candidate | Votes | % | ±% | |
---|---|---|---|---|---|
Labor | Sam Lawn | 8,315 | 61.3 | -11.6 | |
Liberal and Country | Donald Maddocks | 4,026 | 29.7 | +29.7 | |
Communist | Elliott Johnston | 1,226 | 9.0 | +3.8 | |
Total formal votes | 13,567 | 96.4 | +3.5 | ||
Informal votes | 542 | 3.8 | -3.5 | ||
Turnout | 14,109 | 93.7 | +1.8 | ||
Two-party-preferred result | |||||
Labor | Sam Lawn | 9,418 | 69.4 | -10.1 | |
Liberal and Country | Donald Maddocks | 4,149 | 30.6 | +30.6 | |
Labor hold | Swing | N/A | |||
Party | Candidate | Votes | % | ±% | |
---|---|---|---|---|---|
Liberal and Country | Bill Nankivell | 5,872 | 76.7 | -23.3 | |
Labor | Graham Maguire | 1,783 | 23.3 | +23.3 | |
Total formal votes | 7,655 | 98.4 | |||
Informal votes | 125 | 1.7 | |||
Turnout | 7,780 | 95.4 | |||
Liberal and Country hold | Swing | N/A | |||
Party | Candidate | Votes | % | ±% | |
---|---|---|---|---|---|
Liberal and Country | David Brookman | 6,349 | 48.7 | -9.0 | |
Labor | Robert Harris | 5,910 | 45.3 | +3.0 | |
Independent | Betty Bishop | 442 | 3.4 | +3.4 | |
National | William Johns | 350 | 2.7 | +2.7 | |
Total formal votes | 13,051 | 98.1 | 0.0 | ||
Informal votes | 255 | 1.9 | 0.0 | ||
Turnout | 13,306 | 95.9 | +0.1 | ||
Two-party-preferred result | |||||
Liberal and Country | David Brookman | 7,040 | 53.9 | -3.8 | |
Labor | Robert Harris | 6,011 | 46.1 | +3.8 | |
Liberal and Country hold | Swing | -3.8 | |||
Party | Candidate | Votes | % | ±% | |
---|---|---|---|---|---|
Liberal and Country | Berthold Teusner | 4,351 | 68.0 | -32.0 | |
Labor | Brian Chatterton | 2,045 | 32.0 | +32.0 | |
Total formal votes | 6,396 | 97.9 | |||
Informal votes | 135 | 2.1 | |||
Turnout | 6,531 | 96.1 | |||
Liberal and Country hold | Swing | N/A | |||
Party | Candidate | Votes | % | ±% | |
---|---|---|---|---|---|
Labor | Molly Byrne | 8,792 | 52.5 | +1.0 | |
Liberal and Country | Roger Goldsworthy | 7,608 | 45.4 | -0.8 | |
Democratic Labor | Bernard McRae | 216 | 1.3 | +0.4 | |
Independent | Luke Horan | 138 | 0.8 | +0.8 | |
Total formal votes | 16,754 | 98.1 | -0.5 | ||
Informal votes | 331 | 1.9 | +0.5 | ||
Turnout | 17,085 | 95.1 | -0.5 | ||
Two-party-preferred result | |||||
Labor | Molly Byrne | 8,893 | 53.1 | +0.8 | |
Liberal and Country | Roger Goldsworthy | 7,861 | 46.9 | -0.8 | |
Labor hold | Swing | +0.8 | |||
Party | Candidate | Votes | % | ±% | |
---|---|---|---|---|---|
Liberal and Country | Joyce Steele | 20,609 | 59.4 | -0.2 | |
Labor | Joyce Henriott | 14,059 | 40.6 | +5.4 | |
Total formal votes | 34,668 | 97.2 | -0.2 | ||
Informal votes | 980 | 2.8 | +0.2 | ||
Turnout | 35,648 | 95.2 | +1.0 | ||
Liberal and Country hold | Swing | -2.8 | |||
Party | Candidate | Votes | % | ±% | |
---|---|---|---|---|---|
Liberal and Country | Ernest Allen | 3,131 | 56.9 | -5.4 | |
Labor | John Phelan | 1,767 | 32.1 | -5.6 | |
Democratic Labor | William Ahern | 602 | 11.0 | +11.0 | |
Total formal votes | 5,500 | 98.7 | +0.1 | ||
Informal votes | 70 | 1.3 | -0.1 | ||
Turnout | 5,570 | 96.4 | +0.5 | ||
Two-party-preferred result | |||||
Liberal and Country | Ernest Allen | 3,643 | 66.2 | +3.9 | |
Labor | John Phelan | 1,857 | 33.8 | -3.9 | |
Liberal and Country hold | Swing | +3.9 | |||
Party | Candidate | Votes | % | ±% | |
---|---|---|---|---|---|
Liberal and Country | Peter Arnold | 3,392 | 47.4 | +0.1 | |
Labor | Reg Curren | 3,073 | 42.9 | -5.7 | |
National | James Trevor | 367 | 5.1 | +5.1 | |
Independent | Allan Anderson | 329 | 4.6 | +4.6 | |
Total formal votes | 7,161 | 97.3 | -0.1 | ||
Informal votes | 197 | 2.7 | +0.1 | ||
Turnout | 7,358 | 93.4 | -2.5 | ||
Two-party-preferred result | |||||
Liberal and Country | Peter Arnold | 4,008 | 56.0 | +6.7 | |
Labor | Reg Curren | 3,153 | 44.0 | -6.7 | |
Liberal and Country gain from Labor | Swing | +6.7 |
Party | Candidate | Votes | % | ±% | |
---|---|---|---|---|---|
Labor | Geoff Virgo | 18,055 | 57.5 | -2.9 | |
Liberal and Country | David Rogers | 11,399 | 36.3 | +4.0 | |
Independent | Helen Anderson | 1,948 | 6.2 | +6.2 | |
Total formal votes | 31,402 | 98.0 | 0.0 | ||
Informal votes | 645 | 2.0 | 0.0 | ||
Turnout | 32,047 | 93.9 | -1.0 | ||
Two-party-preferred result | |||||
Labor | Geoff Virgo | 18,347 | 58.4 | -3.4 | |
Liberal and Country | David Rogers | 13,055 | 41.6 | +3.4 | |
Labor hold | Swing | -3.4 | |||
Party | Candidate | Votes | % | ±% | |
---|---|---|---|---|---|
Labor | Jack Jennings | 28,246 | 67.2 | +6.0 | |
Liberal and Country | Allan Stock | 13,036 | 31.0 | +5.6 | |
Social Credit | Edwin Meier | 724 | 1.7 | -6.5 | |
Total formal votes | 42,006 | 97.5 | +1.0 | ||
Informal votes | 1,090 | 2.5 | -1.0 | ||
Turnout | 43,096 | 94.7 | -0.4 | ||
Two-party-preferred result | |||||
Labor | Jack Jennings | 28,608 | 68.1 | +1.1 | |
Liberal and Country | Allan Stock | 13,398 | 31.9 | -1.1 | |
Labor hold | Swing | +1.1 | |||
Party | Candidate | Votes | % | ±% | |
---|---|---|---|---|---|
Liberal and Country | Ernie Edwards | 3,292 | 45.4 | -1.4 | |
Independent | William Wilkins | 1,883 | 26.0 | +26.0 | |
Labor | Jack Mortimer | 1,306 | 18.0 | -8.9 | |
National | Morley Rodda | 775 | 10.7 | -15.7 | |
Total formal votes | 7,256 | 98.8 | +0.4 | ||
Informal votes | 89 | 1.2 | -0.4 | ||
Turnout | 7,345 | 96.0 | +0.4 | ||
Two-candidate-preferred result | |||||
Liberal and Country | Ernie Edwards | 3,987 | 54.9 | -5.3 | |
Independent | William Wilkins | 3,269 | 45.1 | +45.1 | |
Liberal and Country hold | Swing | N/A | |||
Party | Candidate | Votes | % | ±% | |
---|---|---|---|---|---|
Liberal and Country | Glen Pearson | 4,285 | 59.1 | +5.5 | |
Labor | Hugh Patterson | 2,512 | 34.7 | -4.3 | |
Democratic Labor | Douglas Barnes | 451 | 6.2 | -1.2 | |
Total formal votes | 7,248 | 98.1 | -0.5 | ||
Informal votes | 137 | 1.9 | +0.5 | ||
Turnout | 7,385 | 95.7 | -0.6 | ||
Two-party-preferred result | |||||
Liberal and Country | Glen Pearson | 4,578 | 63.2 | +3.3 | |
Labor | Hugh Patterson | 2,670 | 36.8 | -3.3 | |
Liberal and Country hold | Swing | +3.3 | |||
Party | Candidate | Votes | % | ±% | |
---|---|---|---|---|---|
Labor | Tom Casey | 2,672 | 58.8 | +0.9 | |
Liberal and Country | Maxwell Hams | 1,874 | 41.2 | +2.2 | |
Total formal votes | 4,546 | 98.1 | -0.4 | ||
Informal votes | 88 | 1.9 | +0.4 | ||
Turnout | 4,634 | 92.9 | +0.5 | ||
Labor hold | Swing | +0.5 | |||
Party | Candidate | Votes | % | ±% | |
---|---|---|---|---|---|
Labor | John Clark | 20,573 | 65.0 | +0.2 | |
Liberal and Country | Stewart Gilchrist | 9,720 | 30.7 | +5.3 | |
Social Credit | Frank Lawrence | 1,374 | 4.3 | +4.3 | |
Total formal votes | 31,667 | 97.2 | -0.3 | ||
Informal votes | 901 | 2.8 | +0.3 | ||
Turnout | 32,568 | 92.7 | -1.3 | ||
Two-party-preferred result | |||||
Labor | John Clark | 21,260 | 67.1 | -2.6 | |
Liberal and Country | Stewart Gilchrist | 10,407 | 32.9 | +2.6 | |
Labor hold | Swing | -2.6 | |||
Party | Candidate | Votes | % | ±% | |
---|---|---|---|---|---|
Labor | Hugh Hudson | 18,711 | 53.3 | +1.8 | |
Liberal and Country | John McCoy | 15,165 | 43.2 | -1.4 | |
Democratic Labor | Mark Posa | 1,203 | 3.4 | -0.5 | |
Total formal votes | 35,079 | 98.5 | -0.1 | ||
Informal votes | 536 | 1.5 | +0.1 | ||
Turnout | 35,615 | 95.2 | +0.2 | ||
Two-party-preferred result | |||||
Labor | Hugh Hudson | 18,891 | 53.9 | +1.8 | |
Liberal and Country | John McCoy | 16,188 | 46.1 | -1.8 | |
Labor hold | Swing | +1.8 | |||
Party | Candidate | Votes | % | ±% | |
---|---|---|---|---|---|
Liberal and Country | Steele Hall | 6,557 | 56.8 | -6.7 | |
Labor | Edward Eaton | 4,139 | 35.9 | -0.6 | |
Social Credit | Albert Apponyi | 579 | 5.0 | +5.0 | |
Democratic Labor | Peter Meredith | 261 | 2.3 | +2.3 | |
Total formal votes | 11,536 | 97.4 | 0.0 | ||
Informal votes | 305 | 2.6 | 0.0 | ||
Turnout | 11,841 | 94.6 | -0.8 | ||
Two-party-preferred result | |||||
Liberal and Country | Steele Hall | 7,069 | 61.3 | -2.2 | |
Labor | Edward Eaton | 4,467 | 38.7 | +2.2 | |
Liberal and Country hold | Swing | -2.2 | |||
Party | Candidate | Votes | % | ±% | |
---|---|---|---|---|---|
Liberal and Country | Bryant Giles | 4,740 | 67.9 | +3.1 | |
Labor | Cyril Swaine | 2,245 | 32.1 | +10.6 | |
Total formal votes | 6,985 | 98.4 | +0.5 | ||
Informal votes | 115 | 1.6 | -0.5 | ||
Turnout | 7,100 | 91.7 | -4.5 | ||
Liberal and Country hold | Swing | -5.2 | |||
Party | Candidate | Votes | % | ±% | |
---|---|---|---|---|---|
Labor | Cyril Hutchens | 14,874 | 72.2 | -7.9 | |
Liberal and Country | Richard Leeton | 5,741 | 27.8 | +27.8 | |
Total formal votes | 20,615 | 96.3 | +1.6 | ||
Informal votes | 796 | 3.7 | -1.6 | ||
Turnout | 21,411 | 95.1 | +0.9 | ||
Labor hold | Swing | N/A | |||
Party | Candidate | Votes | % | ±% | |
---|---|---|---|---|---|
Liberal and Country | John Freebairn | 3,873 | 68.9 | -31.1 | |
Labor | Ernest Fahey | 1,749 | 31.1 | +31.1 | |
Total formal votes | 5,622 | 98.2 | |||
Informal votes | 99 | 1.8 | |||
Turnout | 5,721 | 96.3 | |||
Liberal and Country hold | Swing | N/A | |||
Party | Candidate | Votes | % | ±% | |
---|---|---|---|---|---|
Labor | Des Corcoran | 3,635 | 50.0 | -11.8 | |
Liberal and Country | Martin Cameron | 3,634 | 50.0 | +11.8 | |
Total formal votes | 7,269 | 99.0 | +0.2 | ||
Informal votes | 73 | 1.0 | -0.2 | ||
Turnout | 7,342 | 96.0 | +1.0 | ||
Labor hold | Swing | -11.8 | |||
Party | Candidate | Votes | % | ±% | |
---|---|---|---|---|---|
Liberal and Country | Robin Millhouse | 16,056 | 64.8 | -0.8 | |
Labor | Peter Gilchrist | 8,727 | 35.2 | +2.8 | |
Total formal votes | 24,783 | 98.5 | +0.3 | ||
Informal votes | 381 | 1.5 | -1.5 | ||
Turnout | 25,164 | 93.0 | -0.8 | ||
Liberal and Country hold | Swing | -1.8 | |||
Party | Candidate | Votes | % | ±% | |
---|---|---|---|---|---|
Labor | Allan Burdon | 5,567 | 58.6 | -2.0 | |
Liberal and Country | Archibald Scott | 3,926 | 41.4 | +2.0 | |
Total formal votes | 9,493 | 98.0 | -0.2 | ||
Informal votes | 198 | 2.0 | +0.2 | ||
Turnout | 9,691 | 95.6 | +1.1 | ||
Labor hold | Swing | -2.0 | |||
Party | Candidate | Votes | % | ±% | |
---|---|---|---|---|---|
Labor | Gabe Bywaters | 4,051 | 49.0 | -18.1 | |
Liberal and Country | Ivon Wardle | 4,044 | 48.9 | +16.0 | |
Democratic Labor | Terence Critchley | 178 | 2.1 | +2.1 | |
Total formal votes | 8,273 | 98.3 | +0.2 | ||
Informal votes | 142 | 1.7 | -0.2 | ||
Turnout | 8,415 | 96.4 | +0.1 | ||
Two-party-preferred result | |||||
Liberal and Country | Ivon Wardle | 4,157 | 50.2 | +17.3 | |
Labor | Gabe Bywaters | 4,116 | 49.8 | -17.3 | |
Liberal and Country gain from Labor | Swing | +17.3 |
Party | Candidate | Votes | % | ±% | |
---|---|---|---|---|---|
Labor | Don Dunstan | 9,981 | 56.4 | -1.2 | |
Liberal and Country | David Tonkin | 7,417 | 41.9 | -0.5 | |
Democratic Labor | Kevin McRae | 303 | 1.7 | +1.7 | |
Total formal votes | 17,701 | 97.9 | +1.2 | ||
Informal votes | 388 | 2.1 | -1.2 | ||
Turnout | 18,089 | 93.9 | +0.5 | ||
Two-party-preferred result | |||||
Labor | Don Dunstan | 10,026 | 56.6 | -1.0 | |
Liberal and Country | David Tonkin | 7,675 | 43.4 | +1.0 | |
Labor hold | Swing | -1.0 | |||
Party | Candidate | Votes | % | ±% | |
---|---|---|---|---|---|
Liberal and Country | Stan Evans | 4,228 | 57.6 | +0.5 | |
Labor | David Rhodes | 2,356 | 32.1 | -6.7 | |
National | Robert Harper | 759 | 10.3 | +10.3 | |
Total formal votes | 7,343 | 98.1 | -0.1 | ||
Informal votes | 145 | 1.9 | +0.1 | ||
Turnout | 7,488 | 95.3 | -0.5 | ||
Two-party-preferred result | |||||
Liberal and Country | Stan Evans | 4,911 | 66.9 | +7.8 | |
Labor | David Rhodes | 2,432 | 33.1 | -7.8 | |
Liberal and Country hold | Swing | +7.8 | |||
Party | Candidate | Votes | % | ±% | |
---|---|---|---|---|---|
Labor | John Ryan | 15,460 | 68.4 | -8.4 | |
Liberal and Country | Graeme Sargent | 4,811 | 23.6 | +23.6 | |
Social Credit | Denis McEvoy | 1,246 | 6.1 | +6.1 | |
Communist | Peter Symon | 380 | 1.9 | -2.6 | |
Total formal votes | 20,348 | 96.5 | +2.2 | ||
Informal votes | 740 | 3.5 | -2.2 | ||
Turnout | 21,088 | 93.5 | -1.2 | ||
Two-party-preferred result | |||||
Labor | John Ryan | 14,876 | 73.1 | -0.9 | |
Liberal and Country | Graeme Sargent | 5,472 | 26.9 | +0.9 | |
Labor hold | Swing | -0.9 | |||
Party | Candidate | Votes | % | ±% | |
---|---|---|---|---|---|
Labor | Dave McKee | 4,301 | 69.1 | -20.3 | |
Liberal and Country | Graham Hancock | 1,378 | 22.1 | +22.1 | |
Independent | Wesley Thomas | 547 | 8.8 | +8.8 | |
Total formal votes | 6,226 | 97.8 | +1.0 | ||
Informal votes | 141 | 2.2 | -1.0 | ||
Turnout | 6,367 | 95.5 | -0.7 | ||
Two-party-preferred result | |||||
Labor | Dave McKee | 4,574 | 73.5 | -0.5 | |
Liberal and Country | Graham Hancock | 1,652 | 26.5 | +0.5 | |
Labor hold | Swing | -0.5 | |||
Party | Candidate | Votes | % | ±% | |
---|---|---|---|---|---|
Independent | Tom Stott | 2,824 | 40.3 | -26.6 | |
Liberal and Country | Geoffrey Blight | 2,624 | 37.4 | +37.4 | |
Labor | Francis Bulbeck | 1,568 | 22.3 | -10.8 | |
Total formal votes | 7,016 | 98.6 | +0.2 | ||
Informal votes | 99 | 1.4 | -0.2 | ||
Turnout | 7,115 | 96.6 | -1.4 | ||
Two-candidate-preferred result | |||||
Independent | Tom Stott | 3,901 | 55.6 | -11.3 | |
Liberal and Country | Geoffrey Blight | 3,115 | 44.4 | +44.4 | |
Independent hold | Swing | N/A | |||
Party | Candidate | Votes | % | ±% | |
---|---|---|---|---|---|
Liberal and Country | Howard Venning | 3,671 | 70.1 | +3.5 | |
Labor | James Dunford | 1,565 | 29.9 | -3.5 | |
Total formal votes | 5,236 | 97.9 | -0.4 | ||
Informal votes | 110 | 2.1 | +0.4 | ||
Turnout | 5,346 | 96.4 | -0.1 | ||
Liberal and Country hold | Swing | +3.5 | |||
Party | Candidate | Votes | % | ±% | |
---|---|---|---|---|---|
Labor | Reg Hurst | 15,613 | 69.6 | -8.5 | |
Liberal and Country | Reginald Appelkamp | 6,076 | 27.1 | +27.1 | |
Social Credit | Edward Wright | 731 | 3.3 | -5.4 | |
Total formal votes | 22,520 | 97.0 | +2.1 | ||
Informal votes | 692 | 3.0 | -2.1 | ||
Turnout | 23,112 | 95.1 | -0.4 | ||
Two-party-preferred result | |||||
Labor | Reg Hurst | 15,978 | 71.3 | -0.7 | |
Liberal and Country | Reginald Appelkamp | 6,442 | 28.7 | +28.7 | |
Labor hold | Swing | N/A | |||
Party | Candidate | Votes | % | ±% | |
---|---|---|---|---|---|
Liberal and Country | William McAnaney | 5,124 | 72.0 | +1.1 | |
Labor | Glenton Gregory | 1,989 | 28.0 | -1.1 | |
Total formal votes | 7,113 | 98.3 | -0.7 | ||
Informal votes | 122 | 1.7 | +0.7 | ||
Turnout | 7,235 | 96.3 | -0.2 | ||
Liberal and Country hold | Swing | +1.1 | |||
Party | Candidate | Votes | % | ±% | |
---|---|---|---|---|---|
Labor | Lindsay Riches | 6,002 | 73.9 | -13.8 | |
Liberal and Country | Robert Semmens | 2,124 | 26.1 | +26.1 | |
Total formal votes | 8,126 | 98.0 | +2.3 | ||
Informal votes | 169 | 2.0 | -2.3 | ||
Turnout | 8,295 | 93.8 | +0.7 | ||
Labor hold | Swing | N/A | |||
Party | Candidate | Votes | % | ±% | |
---|---|---|---|---|---|
Liberal and Country | John Coumbe | 9,126 | 52.3 | +3.8 | |
Labor | Terry McRae | 7,578 | 42.6 | -1.1 | |
Democratic Labor | George Basivovs | 1,076 | 6.1 | -0.1 | |
Total formal votes | 17,780 | 97.5 | -0.4 | ||
Informal votes | 462 | 2.5 | +0.4 | ||
Turnout | 18,242 | 93.6 | -0.6 | ||
Two-party-preferred result | |||||
Liberal and Country | John Coumbe | 10,041 | 56.5 | +2.4 | |
Labor | Terry McRae | 7,739 | 43.5 | -2.4 | |
Liberal and Country hold | Swing | +2.4 | |||
Party | Candidate | Votes | % | ±% | |
---|---|---|---|---|---|
Labor | Gil Langley | 8,820 | 50.8 | +0.1 | |
Liberal and Country | Lewis Short | 7,689 | 44.3 | -0.6 | |
Democratic Labor | Ted Farrell | 852 | 4.9 | +1.2 | |
Total formal votes | 17,361 | 97.5 | -0.1 | ||
Informal votes | 450 | 2.5 | +0.1 | ||
Turnout | 17,811 | 92.9 | -1.1 | ||
Two-party-preferred result | |||||
Labor | Gil Langley | 8,948 | 51.5 | -0.1 | |
Liberal and Country | Lewis Short | 8,413 | 48.5 | +0.1 | |
Labor hold | Swing | -0.1 | |||
Party | Candidate | Votes | % | ±% | |
---|---|---|---|---|---|
Liberal and Country | Allan Rodda | 4,439 | 62.3 | +11.2 | |
Labor | Reginald Jordan | 1,942 | 28.1 | -11.4 | |
Independent | Alfred Donnelly | 527 | 7.6 | +7.6 | |
Total formal votes | 6,908 | 97.9 | -1.2 | ||
Informal votes | 149 | 2.1 | +1.2 | ||
Turnout | 7,057 | 95.6 | +0.4 | ||
Two-party-preferred result | |||||
Liberal and Country | Allan Rodda | 4,703 | 68.1 | +9.8 | |
Labor | Reginald Jordan | 2,205 | 31.9 | -9.8 | |
Liberal and Country hold | Swing | +9.8 | |||
Party | Candidate | Votes | % | ±% | |
---|---|---|---|---|---|
Labor | Lloyd Hughes | 2,899 | 52.0 | -7.1 | |
Liberal and Country | Keith Russack | 2,612 | 46.8 | +5.9 | |
Democratic Labor | John McMahon | 67 | 1.2 | +1.2 | |
Total formal votes | 5,578 | 98.7 | +0.6 | ||
Informal votes | 74 | 1.3 | -0.6 | ||
Turnout | 5,652 | 96.9 | +0.4 | ||
Two-party-preferred result | |||||
Labor | Lloyd Hughes | 2,909 | 52.2 | -6.9 | |
Liberal and Country | Keith Russack | 2,669 | 47.8 | +6.9 | |
Labor hold | Swing | -6.9 | |||
Party | Candidate | Votes | % | ±% | |
---|---|---|---|---|---|
Labor | Glen Broomhill | 20,283 | 55.7 | -1.1 | |
Liberal and Country | Ross Stanford | 14,838 | 40.7 | -2.5 | |
Democratic Labor | Gary Lockwood | 1,295 | 3.6 | +3.6 | |
Total formal votes | 36,416 | 97.9 | +0.6 | ||
Informal votes | 771 | 2.1 | -0.6 | ||
Turnout | 37,187 | 94.5 | +0.4 | ||
Two-party-preferred result | |||||
Labor | Glen Broomhill | 20,477 | 56.2 | -0.6 | |
Liberal and Country | Ross Stanford | 15,939 | 43.8 | +0.6 | |
Labor hold | Swing | -0.6 | |||
Party | Candidate | Votes | % | ±% | |
---|---|---|---|---|---|
Labor | Ron Loveday | 9,268 | 75.1 | -4.7 | |
Liberal and Country | Colin Norton | 3,072 | 24.9 | +24.9 | |
Total formal votes | 12,340 | 96.5 | +0.1 | ||
Informal votes | 449 | 3.5 | -0.1 | ||
Turnout | 12,789 | 90.5 | +2.9 | ||
Labor hold | Swing | N/A | |||
Party | Candidate | Votes | % | ±% | |
---|---|---|---|---|---|
Liberal and Country | James Ferguson | 4,651 | 74.9 | +5.4 | |
Labor | Leo Travis | 1,563 | 25.2 | -5.4 | |
Total formal votes | 6,214 | 98.4 | +0.2 | ||
Informal votes | 99 | 1.6 | -0.2 | ||
Turnout | 6,313 | 96.3 | -1.2 | ||
Liberal and Country hold | Swing | +5.4 | |||
The Legislative Council, or upper house, is one of the two chambers of the Parliament of South Australia. Its central purpose is to act as a house of review for legislation passed through the lower house, the House of Assembly. It sits in Parliament House in the state capital, Adelaide.
The House of Assembly, or lower house, is one of the two chambers of the Parliament of South Australia. The other is the Legislative Council. It sits in Parliament House in the state capital, Adelaide.
The Parliament of South Australia is the bicameral legislature of the Australian state of South Australia. It consists of the 47-seat House of Assembly and the 22-seat Legislative Council. General elections are held every 4 years, with all of the lower house and half of the upper house filled at each election. It follows a Westminster system of parliamentary government with the executive branch required to both sit in parliament and hold the confidence of the House of Assembly. The parliament is based at Parliament House on North Terrace in the state capital of Adelaide.
The state election for the 51st Parliament of South Australia was held in the Australian state of South Australia on 18 March 2006 to elect all members of the South Australian House of Assembly and 11 members of the South Australian Legislative Council. The election was conducted by the independent State Electoral Office.
Since 1970, the South Australian House of Assembly — the lower house of the Parliament of South Australia — has consisted of 47 single-member electoral districts consisting of approximately the same number of enrolled voters. The district boundaries are regulated by the State Electoral Office, according to the requirements of the South Australian Constitution and are subject to mandatory redistributions by the South Australian Electoral Districts Boundaries Commission in order to respond to changing demographics.
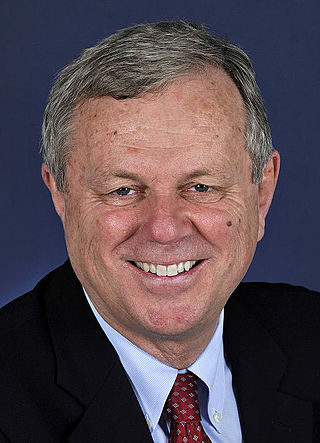
State elections were held in South Australia on 9 February 2002. All 47 seats in the South Australian House of Assembly were up for election, along with half of the 22 seats in the South Australian Legislative Council. The incumbent Liberal Party of Australia led by Premier of South Australia Rob Kerin was defeated by the Australian Labor Party led by Leader of the Opposition Mike Rann. The Labor Party won 23 out of 47 seats, and then secured the one more seat it needed for a majority by gaining the support of independent Peter Lewis.
State elections were held in South Australia on 10 March 1973. All 47 seats in the South Australian House of Assembly were up for election. The incumbent Australian Labor Party led by Premier of South Australia Don Dunstan won a second term in government, defeating the Liberal and Country League led by Leader of the Opposition Bruce Eastick.
State elections were held in South Australia on 30 May 1970. All 47 seats in the South Australian House of Assembly were up for election. The incumbent Liberal and Country League led by Premier of South Australia Steele Hall was defeated by the Australian Labor Party led by Leader of the Opposition Don Dunstan.
The 1968South AustralianState election was held in South Australia on 2 March 1968. All 39 seats in the South Australian House of Assembly were up for election; 38 of the 39 contests were won by candidates from Australia's two major political parties. The incumbent Australian Labor Party and the Liberal and Country League both won 19 seats. The sole independent candidate to win a race, Tom Stott of the Ridley electorate, joined with the LCL's 19 seats to form a coalition government that held a 20 to 19 majority, thus defeating the Dunstan Labor government.
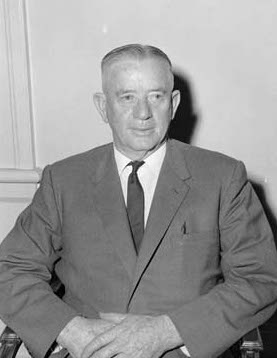
State elections were held in South Australia on 6 March 1965. All 39 seats in the South Australian House of Assembly were up for election. The incumbent Liberal and Country League led by Premier of South Australia Thomas Playford IV, in power since 1938, was defeated by the Australian Labor Party led by Leader of the Opposition Frank Walsh.
State elections were held in South Australia on 3 March 1962. All 39 seats in the South Australian House of Assembly were up for election. The incumbent Liberal and Country League led by Premier of South Australia Thomas Playford IV defeated the Australian Labor Party led by Leader of the Opposition Frank Walsh.
State elections were held in South Australia on 8 March 1947. All 39 seats in the South Australian House of Assembly were up for election. The incumbent Liberal and Country League government led by Premier of South Australia Thomas Playford IV defeated the opposition Australian Labor Party led by Leader of the Opposition Robert Richards.
The 2014 South Australian state election elected members to the 53rd Parliament of South Australia on 15 March 2014, to fill all 47 seats in the House of Assembly and 11 of 22 seats in the Legislative Council. The 12-year-incumbent Australian Labor Party (SA) government, led by Premier Jay Weatherill, won its fourth consecutive four-year term in government, a record 16 years of Labor government, defeating the opposition Liberal Party of Australia (SA), led by Opposition Leader Steven Marshall.
Murray is a defunct electoral district that elected members to the House of Assembly, the lower house of the bicameral legislature of the Australian state of South Australia. The electorate, incorporating part of the River Murray, was rural in nature, with Mannum the only large town within its boundaries. From its establishment to the 1938 state election, Murray was a three-member electorate, but was made a single-member electorate afterwards, as part of a system of electoral malapportionment known as the "Playmander". In both incarnations it elected candidates from both major parties as marginal and safe seat holders at various times. If just 21 LCL votes were Labor votes in Murray at the 1968 election, Labor would have formed majority government. Murray was one of two gains in 1968 that put the LCL in office. The electorate was abolished prior to the 1985 election, with its territory now forming part of the districts of Hammond, Kavel, and Schubert. In total, 24 people represented Murray between 1902 and 1985, with its most notable member being Thomas Playford IV, who later served as Premier of South Australia.
The 2018 South Australian state election to elect members to the 54th Parliament of South Australia was held on 17 March 2018. All 47 seats in the House of Assembly or lower house, whose members were elected at the 2014 election, and 11 of 22 seats in the Legislative Council or upper house, last filled at the 2010 election, were contested. The record-16-year-incumbent Australian Labor Party (SA) government led by Premier Jay Weatherill was seeking a fifth four-year term, but was defeated by the opposition Liberal Party of Australia (SA), led by Opposition Leader Steven Marshall. Nick Xenophon's new SA Best party unsuccessfully sought to obtain the balance of power.
This is a list of House of Assembly results for the 1965 South Australian state election.
The Liberal Party of Australia (South Australian Division), commonly known as the South Australian Liberals, is the South Australian Division of the Liberal Party of Australia. It was formed as the Liberal and Country League (LCL) in 1932 and became the South Australian Division of the Liberal Party when the Liberal Party was formed in 1945. It retained its Liberal and Country League name before changing to its current name in 1974. It is one of two major parties in the bicameral Parliament of South Australia, the other being the Australian Labor Party (SA Branch). The party has been led by Leader of the Opposition David Speirs since the 2022 state election after a one-term government.
SA-Best, formerly known as Nick Xenophon's SA-BEST, is a political party in South Australia. It was founded in 2017 by Nick Xenophon as a state-based partner to his Nick Xenophon Team party. After an unsuccessful 2022 South Australian state election, the party has two representatives in the South Australian Legislative Council, Connie Bonaros and Frank Pangallo, whose current terms expire in 2026.
The 2022 South Australian state election was held on 19 March 2022 to elect members to the 55th Parliament of South Australia. All 47 seats in the House of Assembly, and half the seats in the Legislative Council were up for re-election.